

Pgiam/iStock via Getty Images
Investment Thesis
Over the last decade, discovering new growth opportunities was relatively easy. However, with average earnings growth estimates hovering around 10% for most large-cap growth stocks, investors should look elsewhere. The iShares Russell Mid-Cap Growth ETF (NYSEARCA:IWP) is a nice mid-cap fund I found, and it comes with an impressive 21+ year track record and a 20% estimated earnings growth rate. The 30x forward earnings valuation is expensive, but I support a small allocation to IWP based on solid earnings momentum. I look forward to discussing this straightforward but exciting fund below.
IWP Overview
Strategy Discussion
IWP tracks the Russell MidCap Growth Index, selecting Russell MidCap Index companies with relatively higher price-book ratios, five-year trailing sales growth per share, and forecasted two-year earnings per share. Russell U.S. Indexes begin their annual reconstitution process in May, with changes communicated to the market in June. The process is summarized as follows:
- Start with all publicly-traded U.S. companies.
- Remove ineligible companies due to structure, size, share type, etc.
- Rank in descending order by market capitalization. The largest 1,000 form the Russell 1000 Index. The next 2,000 forms the Russell 2000 Index. Weights are assigned based on free-float market capitalization.
- New members are assigned based on absolute breakpoints. Existing ones retain their spot even if they fall within 5% outside the breakpoint.
- The Russell MidCap Index comprises the 800 smallest members of the Russell 1000 Index.
Overall, it’s straightforward and part of the appeal of Russell Indexes. The growth factors used are standard, and I prefer estimated earnings growth over historical ones. In fast-changing markets, it’s essential to avoid buying high and selling low. My fundamental analysis shortly will give readers insight into other valuable metrics like valuation, profitability, and earnings momentum.
Sector Exposures and Top Ten Holdings
IWP’s sector exposures are listed below alongside the Vanguard Mid-Cap Growth ETF (VOT) and the iShares Morningstar Mid-Cap Growth ETF (IMCG). I chose these peers because they have weighted-average market capitalizations of around $25 billion, similar to IWP. In contrast, ETFs that track the S&P MidCap 400 Growth Index (MDYG, IVOG, IJK) are about $8 billion.
Morningstar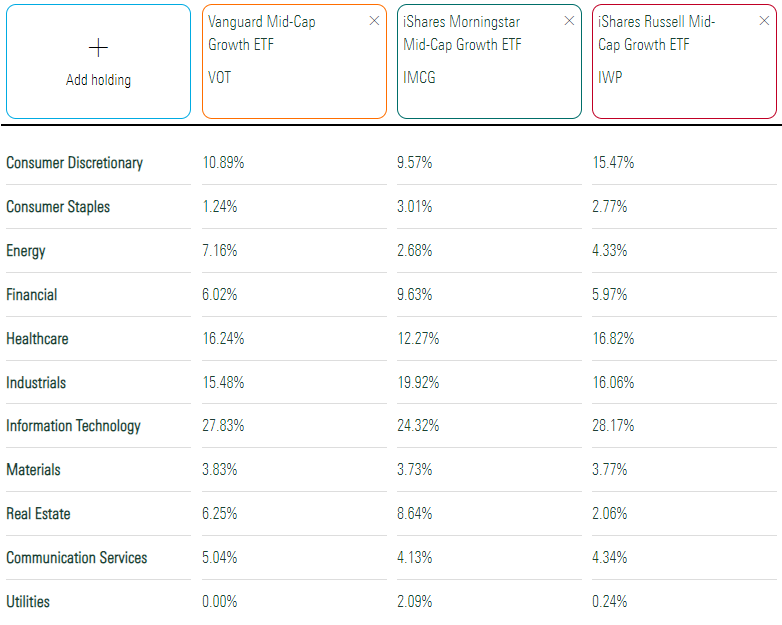
IWP differentiates itself with a 15.47% exposure to Consumer Discretionary, 4-6% more than VOT and IMCG. It’s average on Energy and light on Real Estate, which is a possible headwind. For example, IMCG’s Real Estate holdings are up 13.68% YTD on average. IWP’s Real Estate holdings are doing just as well, but nearly all have negligible weightings.
IWP’s top ten holdings are below, led by Synopsys (SNPS), Cadence Design Systems (CDNS), and Chipotle Mexican Grill (CMG). This list represents 12% of the portfolio, less than VOT’s 15% but more than IMCG’s 10%. IWP’s largest industry is Application Software (8.35%). With a $51 billion market capitalization, CDNS is the largest, followed by Trade Desk (TTD), Datadog (DDOG), ANSYS (ANSS), and Zoom Video Communications (ZM), all within the top 100 holdings list.
iShares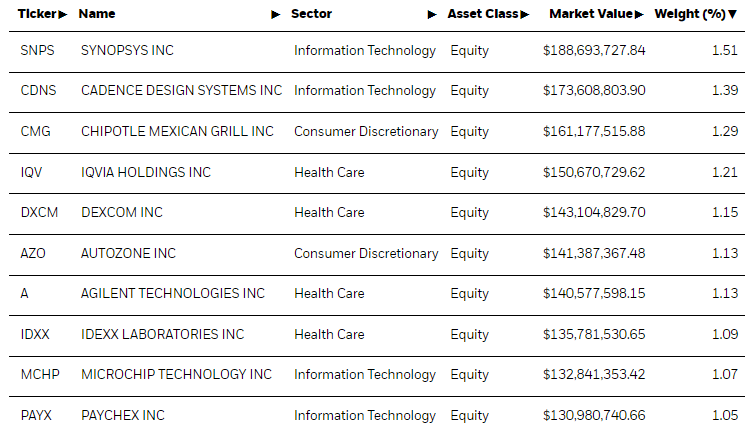
Performance Analysis
Since its inception in July 2001, IWP has gained an annualized 9.00% compared to 8.89% for the large-cap-focused Vanguard Growth ETF (VUG). Except for 2002, 2008, and 2022, neither fund experienced significant annual losses. Therefore, growth stocks should form part of your portfolio, should your time horizon be long enough. In 2008, IWP declined by 45%, too much for most individuals nearing or in retirement to handle.
Portfolio Visualizer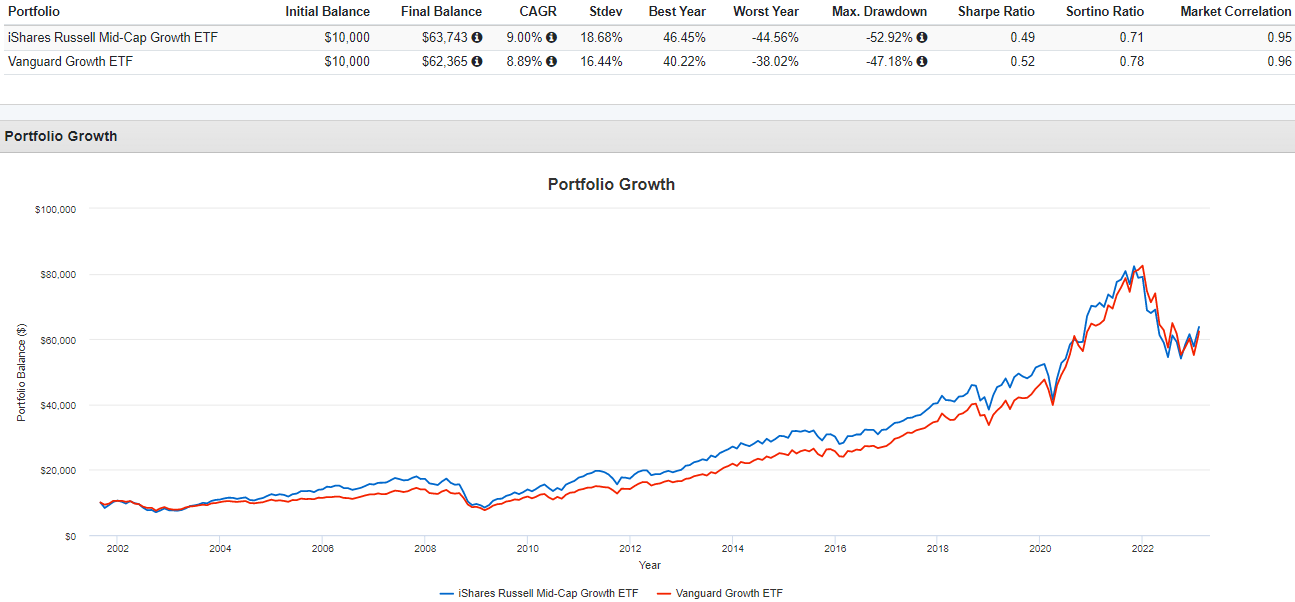
IWP’s outperformance occurred in earlier years. The following three-year rolling returns chart highlights how IWP has spent most of the last decade trailing VUG. A likely reason is that as mid-cap stocks become large enough, they graduate to a large-cap Index. The “sell your winners” strategy hasn’t worked, demonstrated by the persistent underperformance of equal-weighted vs. market-cap-weighted ETFs.
Portfolio Visualizer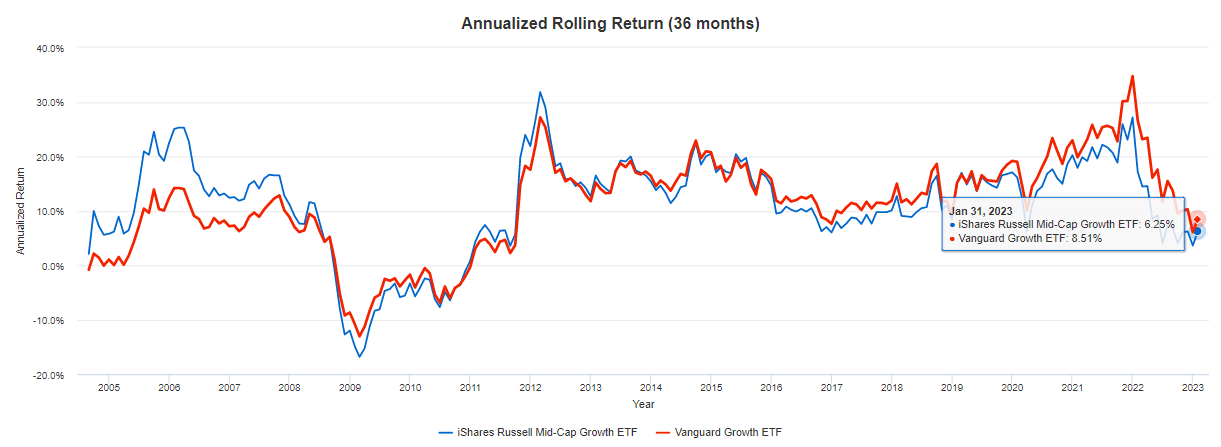
Compared with VOT and IMCG, IWP’s performance was average, gaining an annualized 9.53% since August 2006. VOT and IMCG gained 9.20% and 10.15%, and all three funds had similar standard deviation and drawdowns.
Portfolio Visualizer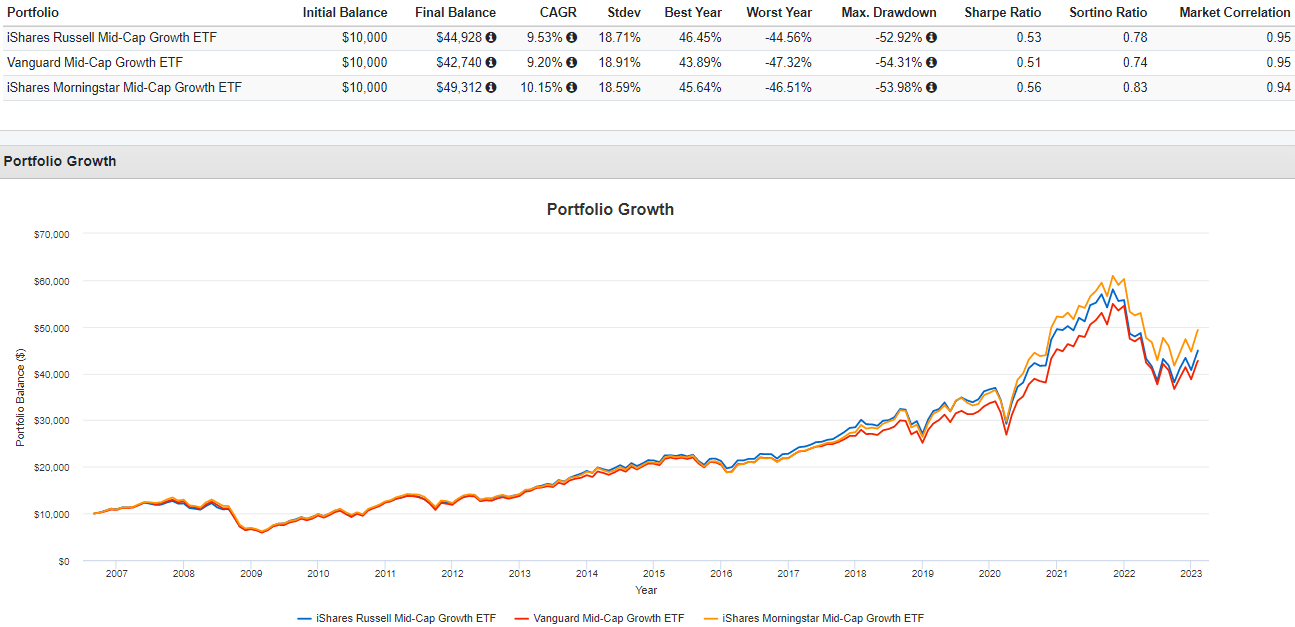
Finally, here is how IWP performed against a dozen other mid-cap growth ETFs through January 2023. As shown, its 195.67% total return over the last ten years was second best to IMCG. However, its 19.94% three-year return was the second-worst due to a 10% underperformance in 2020. It’s one minor cause for concern, but as I will demonstrate next, IWP’s growth potential is just as solid. I don’t expect that underperformance to occur again.
The Sunday Investor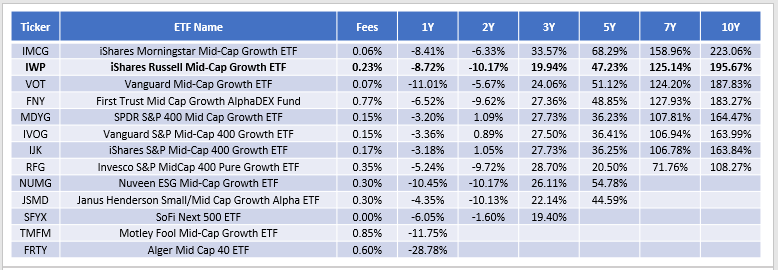
IWP Analysis
The following table highlights selected fundamental metrics for IWP’s top 25 industries. IWP trades at 29.81x forward earnings, slightly below IMCG and about two points cheaper than VOT. The portfolio’s 1.19 five-year beta indicates it’s the most volatile, but it also has the highest estimated earnings growth rate at 19.49%.
The Sunday Investor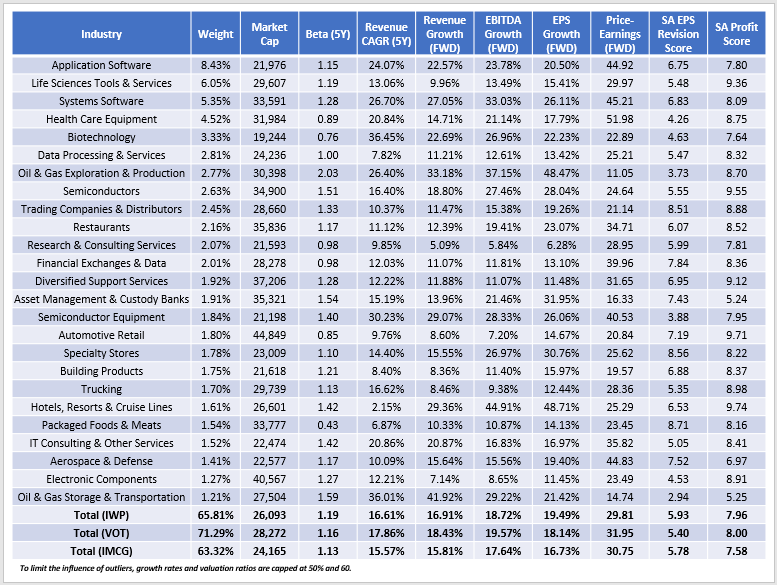
Calculating earnings growth rates for portfolios in the middle of earnings season is challenging since poor results cause analysts to revise future earnings estimates downward. Still, analysts are generally more optimistic about IWP’s constituents, as indicated by its 5.93/10 EPS Revision Score. This score is a solid leading indicator, and it’s relatively high for Application and Systems Software stocks that comprise 14% of the portfolio. Fortinet (FTNT) is a good example. The cybersecurity company beat analyst earnings estimates by 12% on Tuesday and had a perfect “A+” EPS Revision Grade as of the Monday close. Two consecutive double-digit earnings surprises and a 27.93% estimated earnings growth rate, consistent with its five-year average, help explain why this stock is up 23% YTD. These are my preferred return sources rather than the hype of irrational markets like in 2020.
Seeking Alpha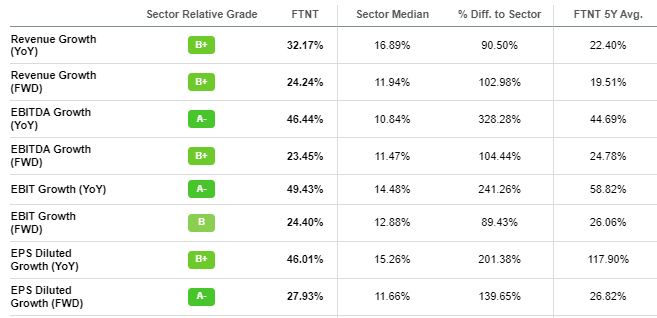
Several industries have estimated earnings growth rates above 20%, including Biotechnology, Oil & Gas Exploration & Production, Semiconductors, and Asset Management & Custody Banks. These growth opportunities are few and far between in the large-cap segment. Consider that the iShares Russell Top 200 Growth ETF (IWY) currently has a 10.48% estimated earnings growth rate and trades at a similar 29.43x forward earnings. Here is how the growth rates compare by industry for IWP vs. IWY:
- Application Software: 20.50% vs. 18.08%
- Life Sciences Tools & Services: 15.41% vs. 2.45%
- Systems Software: 26.11% vs. 10.40%
- Health Care Equipment: 17.79% vs. 6.61%
- Biotechnology: 22.23% vs. 3.75%
Also, several large-cap growth funds overweight Amazon (AMZN). A significant headwind is that Amazon Web Services margins are shrinking. In Q4 2022, they were 24.35% compared to 29.77% a year prior.
Amazon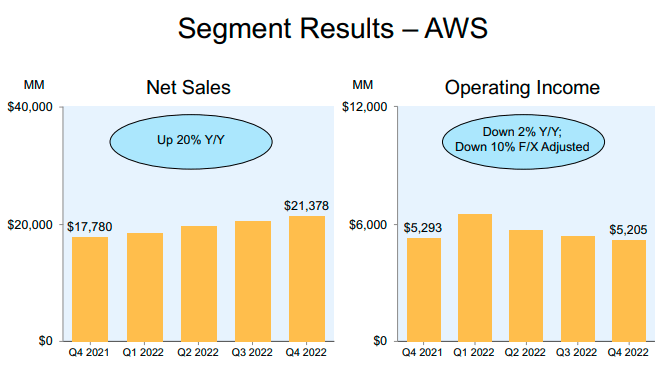
Growth investors should steer clear of large-cap growth ETFs until Amazon’s influence decreases. Currently, it’s 5.83% of IWY, and a further 35% is occupied by Apple (AAPL), Microsoft (MSFT), and Alphabet (GOOGL, GOOG), with low or negative earnings growth rates as follows:
Seeking Alpha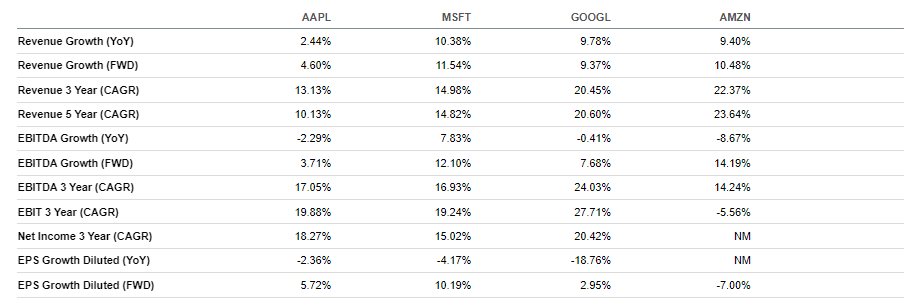
Investment Recommendation
Investors should consider owning IWP because mid-cap stocks feature far better growth opportunities than their large-cap alternatives but trade at the same 30x forward earnings valuation. Compared to direct peers like IMCG and VOT, IWP has the best combination of growth, valuation, and earnings momentum. It also has a solid long-term track record that’s delivered a nearly 200% return over the last ten years. The 0.23% expense ratio is slightly elevated, but the cost difference is negligible if you view this as the short-term opportunity I do. Thank you for reading, and I look forward to answering any questions in the comments section below.
Be the first to comment