

naphtalina/iStock via Getty Images
Could it “V” a bottom? The iShares Core S&P Total U.S. Market ETF (NYSEARCA:ITOT) is up 18.6% from its June 17 intraday low. The broad market fund nearly round-tripped to its February 2020 peak at $76.57 when it cratered to $80.39 two months ago. Since then, the rally has had the hallmarks of the ever-so-familiar “V-bottom” of the 2010s and through the March 2020 Covid Crash.
Many traders expected further downside after the domestic equity market dipped 25.7% off the early January 2022 all-time high. The major thrust, taking place immediately after the June Fed meeting and through the most recent July FOMC gathering, caught investors off guard since there was so much headline risk.
ITOT: Shares Held The February 2020 Peak
Stockcharts.com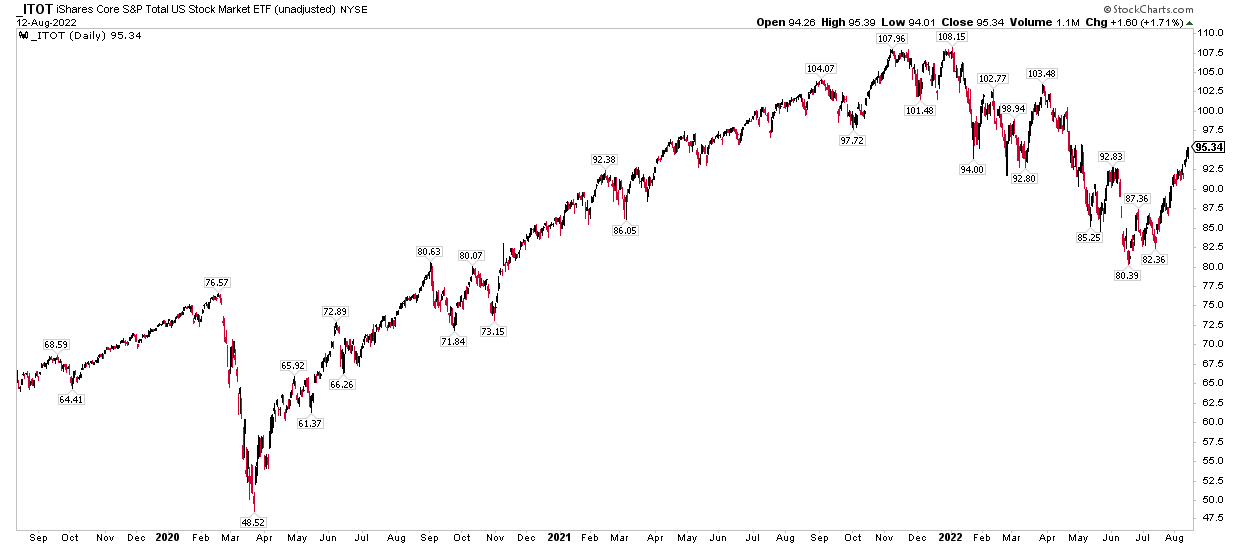
Consider that the market digested news of a technical recession having taken place during the first half of the year, according to the GDP report released in July. One of the major catalysts for such a sharp run-up among both large- and small-cap stocks since mid-June was undoubtedly a robust second-quarter corporate earnings season. While the S&P 500’s Q2 EPS growth rate was nothing to write home about compared with prior quarters, SMID cap companies flew under the radar with impressive bottom-line earnings growth. BofA reported that S&P SmallCap 600 profits per share rose at a 14% clip last quarter. A very strong U.S. dollar perhaps benefitted domestically oriented small firms.
Strong Bottom-Line Numbers From Small Companies
BofA Global Research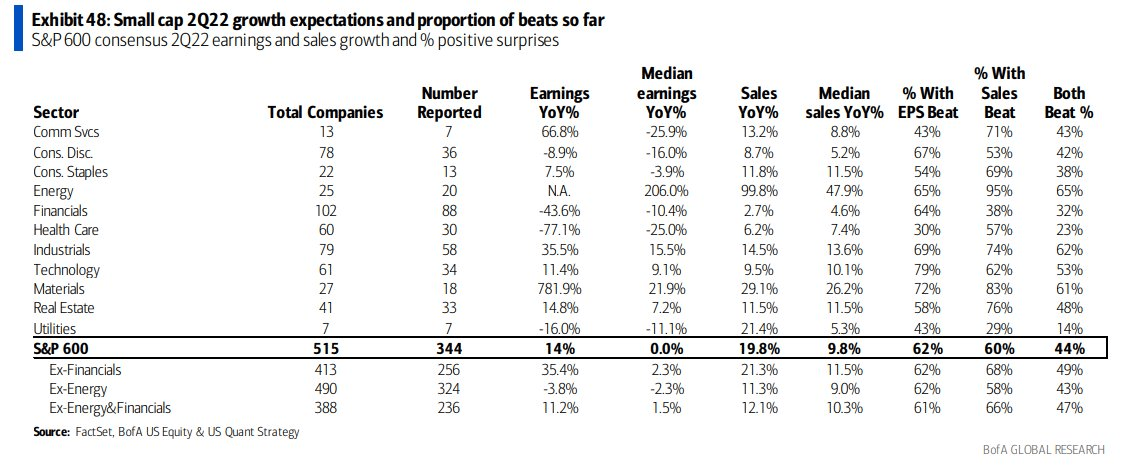
With the reporting season largely in the rearview mirror, aside from a handful of major retail stocks this coming week, it’s an ideal time to check in on the valuation picture. According to Yardeni Research, the S&P 500 trades at 17.5-times forward earnings, while SMID caps feature an earnings multiple of only 12.5 times estimated profits over the coming year. Moreover, there is likely more confidence in what earnings will be since Q2 profit figures did not fall off a cliff as some pundits feared.
Top Earnings Announcements This Week
Wall Street Horizon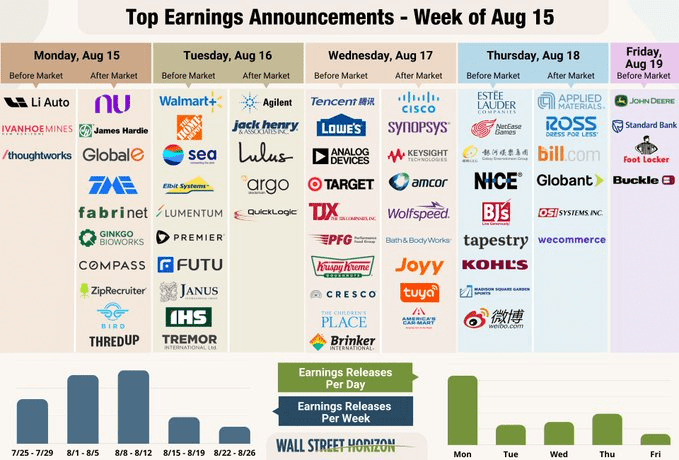
U.S. Stock Market Valuations: A Clearer Picture Post-Q2 Reporting Season
Yardeni.com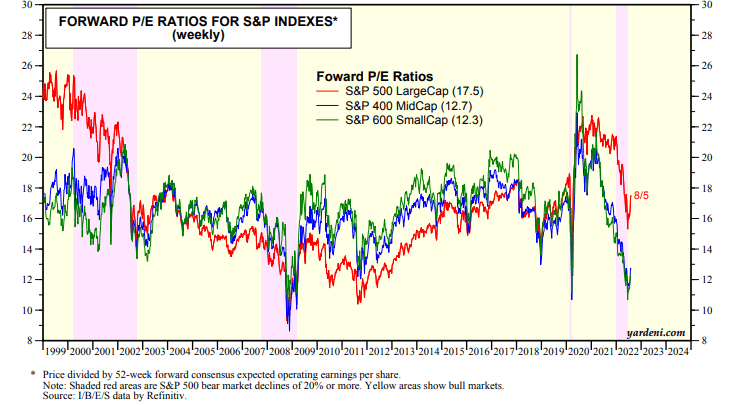
But let’s not overlook the monster move in some of the mega caps. Apple (AAPL) now represents more than 6.1% of the total U.S. stock market, according to iShares. Never has a single stock built up such a big position in the broad equity market. To close out 2021, the tech giant was 5.68% of the ITOT.
ITOT: Apple & Microsoft > 11% Weight
iShares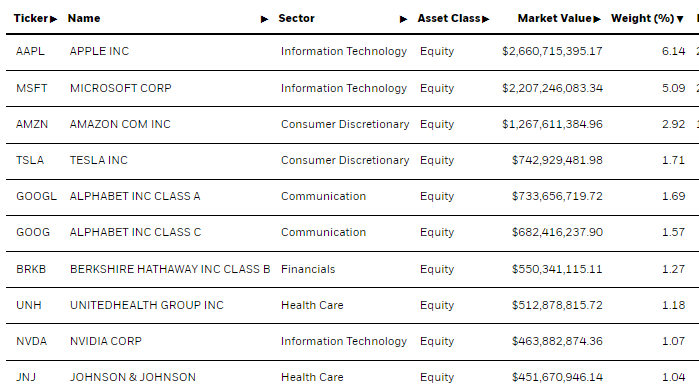
Have stocks come too far too fast? That’s the big question now as we enter a lull period between earnings seasons, after July’s big jobs and inflation reports, and still five weeks before the next Fed meeting. I think the market will simply digest gains here amid a mixed bag of economic data. It is also possible that a chunk of the bullish seasonal period that usually begins in mid-October might have been pulled forward.
Bullish Seasonality Coming Too Soon?
BofA Global Research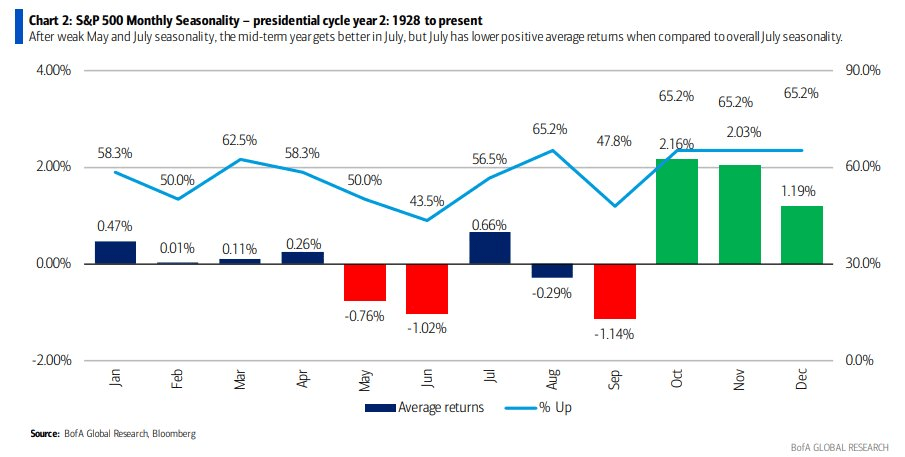
The Bottom Line
Don’t expect the swift bounce in ITOT to continue at the pace we have seen. For the first time since last November, the market has reached “overbought” territory, with ITOT’s RSI (14) above 70. Moreover, the market still has a bearish downward-sloping 200-day moving average, which could prove to be resistance. The good news is that the strong rally might usher in more of a “buy the dip” mentality should we see pullbacks now through before the all-important mid-term elections.
ITOT: Overbought With A Bearish Long-Term Moving Average Slope
Stockcharts.com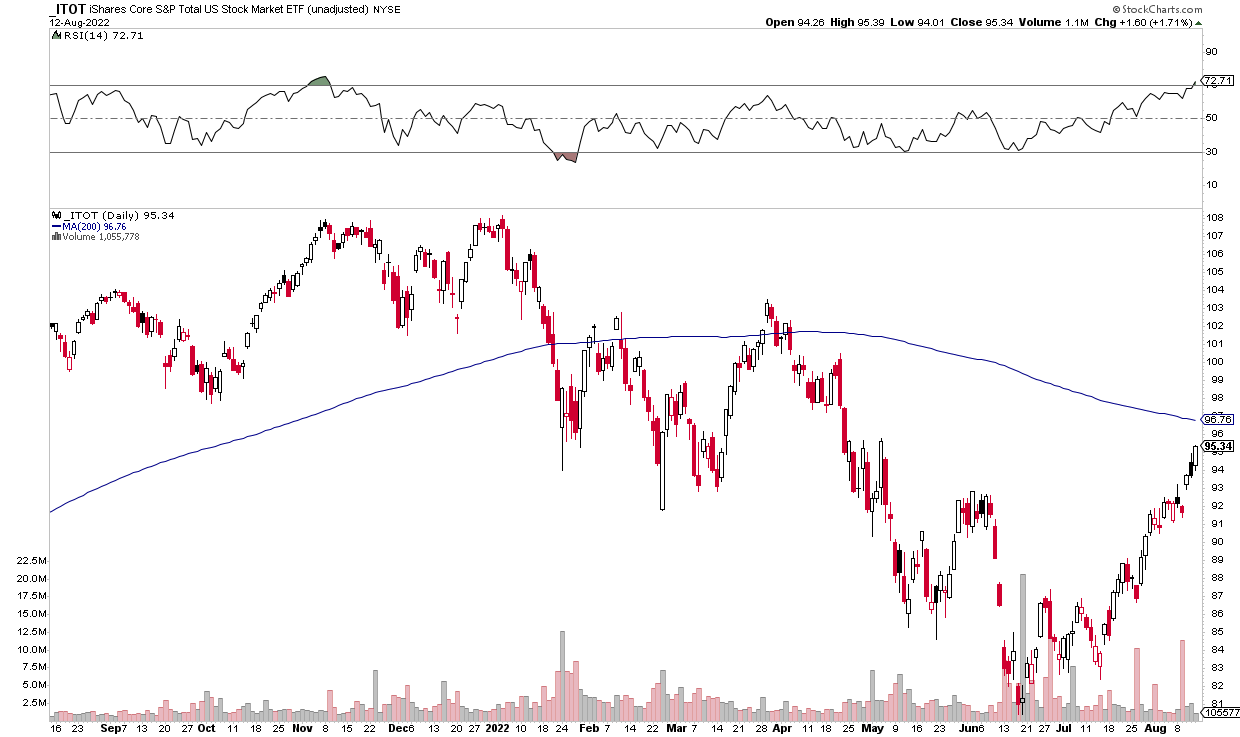
Be the first to comment