

JHVEPhoto
As most all of you know, the Energy Sector has been the big winner this year, and in fact is the only sector that is in the green over the past one-year and YTD (see graphic below). That being the case, many investors are probably like me: their energy holdings have helped keep them afloat during the 2022 bear-market (which, once again, points out the value of having a well-diversified portfolio). Today, I’ll take a look at the iShares U.S. Energy ETF (NYSEARCA:IYE) to see if it makes sense for your portfolio if you are looking to the Energy Sector for both income and capital gains.
Seeking Alpha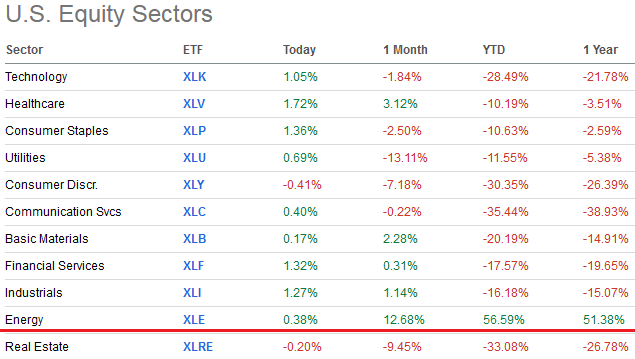
Investment Thesis
Most of my followers know I believe that – despite the false narrative currently being spun by many politicians – today we live in an “Era of Energy Abundance”. U.S. shale oil & gas producers have 10s of billions of bbls of proven oil & gas reserves (at $40/bbl WTI let alone $85/bbl) that can be easily drilled, completed, and brought on to existing pipeline infrastructure in a matter of a couple of months. Remember, the U.S. Energy company CEOs told you many times over the past decade that U.S. shale reserves were “short cycle”. That is, production can very economically and relatively quickly be ramped up (or scaled down) depending on price. These companies also already have thousands of Federal drilling permits, not to mention that the vast majority of shale oil & gas is produced on private property. So, what the false narratives typically don’t mention is the obvious (at least for anyone paying attention…): shale oil & gas operators simply refuse to allocate more capital to drilling despite the fact that it is currently very, very profitable to do so.
Meantime, Russia has weaponized energy as a means to assault the EU countries (and their economies, and the global economy) in order to weaken those countries’ support for Ukraine. So far, support for Ukraine is still strong, but Russia has been successful at raising the global price for oil and gas. And, of course, OPEC+ (primarily Saudi Arabia & Russia) recently decided to cut oil production despite the fact that Saudi likely is already sitting on what is probably a couple million of bpd of shut-in capacity.
Bottom line: while I still insist the world is living in an “Era of Energy Abundance”, it takes the (global) oil & gas industry to actually want to bring that energy to market. Currently, many U.S. producers are artificially holding back production (despite the fact they were drilling like crazy during the “drill baby drill” insanity when oil & gas prices were less than half of today …), and so is OPEC+. So, global oil and gas prices are strong and the U.S. oil and gas producers are simply killing it and generating tons of free-cash-flow. In turn, they are returning much of that FCF to investors in the form of dividends directly into their pockets.
So, let’s take a closer look at the iShares U.S. Energy ETF and see how it has positioned investors for success going forward.
Top-10 Holdings
The IYE ETF’s top-10 holdings are shown below and equate to what I consider to be a very concentrated 70% of the 42-company portfolio:
iShares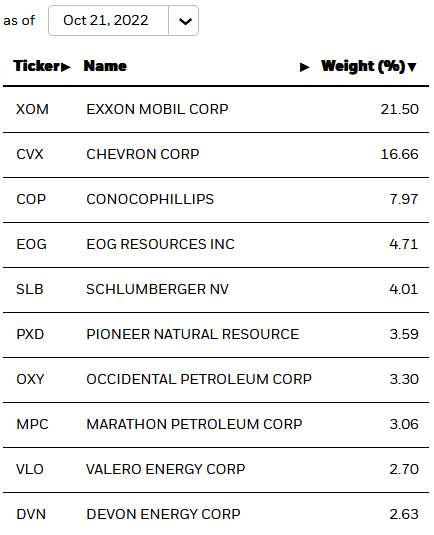
While I generally like to see a more diversified portfolio, in this case I like it: these top-10 names represent the best of the U.S.’s international and domestic oil & gas producers (with one exception I will note below).
As can be seen from the holdings, the top-two holdings – Exxon (XOM) and Chevron (CVX), in aggregate, are ~38% of the entire IYE portfolio. So, for all you investors that already have a full-weight in Exxon or Chevron, from a diversification point of view this might not be the best energy fund choice for you.
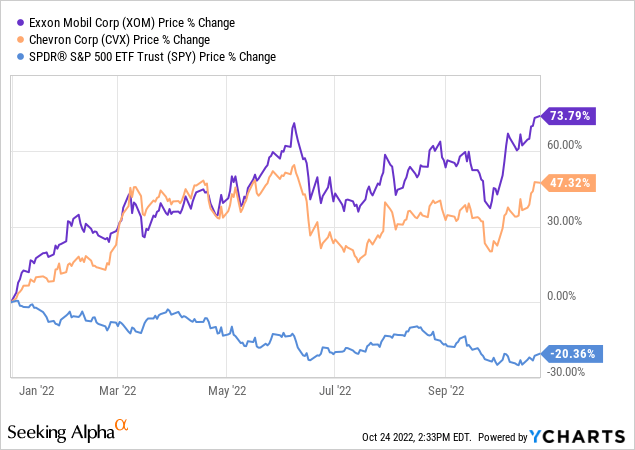
However, one cannot argue with success: Exxon and Chevron have both significantly outperformed the broad market as measured by the SPDR S&P 500 ETF (SPY) during the 2022 bear-market (and that doesn’t even include dividends):
Both of these companies are also generating tons of free-cash-flow. In Q2, Exxon generated $16.9 billion in FCF (an estimated $4/share). That obviously bodes well for XOM shareholders considering the current annual dividend obligation is only $3.52/share. During the quarter, Exxon produced an average of 550,000 boe/d from the Permian and expects its full-year 2022 production to grow by 25% yoy in the play.
Conditions are similar over at Chevron. In CVX’s second quarter, the company generated $10.6 billion in FCF, or a whopping $5.40/share – which actually comes close to covering CVX’s current annual dividend obligation ($5.68).
CVX’s average sales price per barrel of crude oil and NGLs was $89 in Q2 – up from $54 a year earlier. The average sales price for Chevron’s natural gas production was $9.23/MMcf in Q2 – up from $4.92 in last year’s second quarter. As a result of such strong pricing, Chevron’s Q2 earnings were up more than 3.5x on a sequential basis to $11.622 billion, or $5.95/share:
Chevron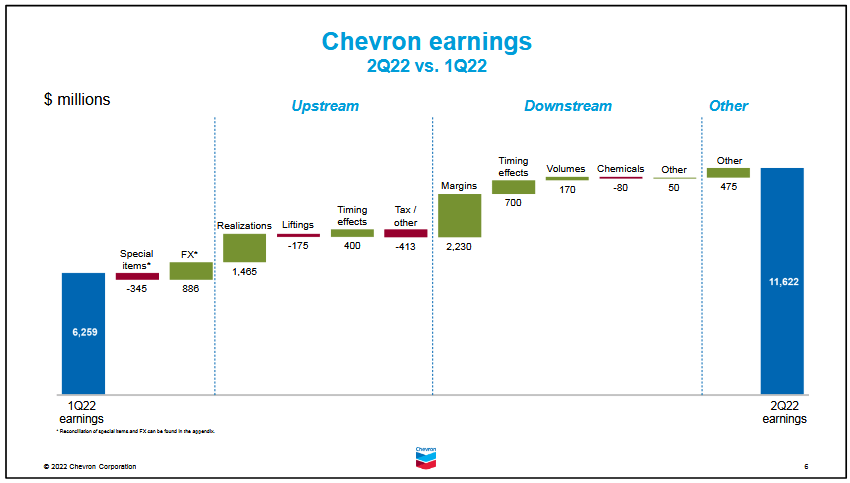
And despite the very strong upward moves in their stock prices this year, both Exxon and Chevron still deliver decent income – yielding 3.33% and 3.28%, respectively. Both companies are scheduled to report Q3 results this Friday and I expect both stocks will continue to exhibit strength into those reports because Q3 is likely to be a continuation of the strong Q2 results previously mentioned.
Four of the top-10 holdings: ConocoPhillips (COP), EOG Resources (EOG), Pioneer Natural Resources (PXD), and Occidental Petroleum (OXY) get the majority of their production from U.S. shale plays and have implemented (base + variable) dividend policies. As I point out in a recent Seeking Alpha article (see (FENY): Energy Stocks Keep Surging – And So Does Dividend Income), many websites are having a hard-time figuring out how to accurate report the dividend income and yields of these stocks. For example, SA currently reports COP’s dividend and yield as $1.84/share and 1.48%. However, from COP’s dividend webpage we can see all the dividend declarations so far this year:
ConocoPhillips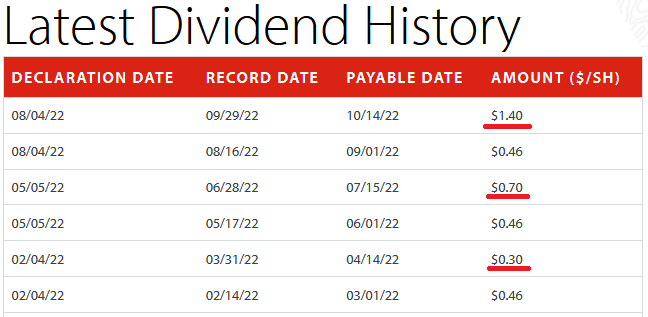
As you can see, in addition to COP’s $0.46/share quarterly base dividend, the company has also declared variable dividends (underlined in red) of $2.40/share over the first three quarters of the year. Therefore, the total dividend payments this year, even assuming no additional variable dividend payout in Q4 (yet there will be more given the high price environment), will be (base+variable) or ($1.84+$2.40) = $4.24/share. That being the case, COP’s real yield should be reported closer to 3.4%. However, I would expect another variable dividend declaration of at least ~$1.00 in November, pushing the total yield likely closer to ~4.6%.
The case for variable dividends is even stronger for EOG and PXD considering both of these companies prioritize dividends while COP is still over-emphasizing stock buybacks over dividends. Indeed, Pioneer Resources’ total dividends for the first three quarter of 2022 is a whopping $19.73/share.
The point is, all these U.S. shale producers typically have breakeven points below $40/bbl WTI while WTI is currently trading more than 2x that price ($84.73/bbl). That alone is a massive fundamental economic signal that investors need to be in these names.
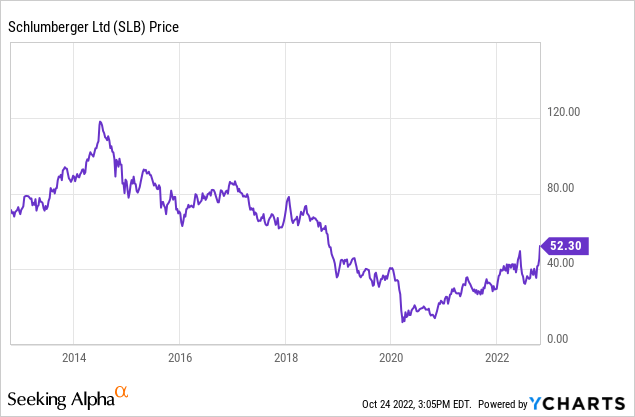
The “dog” of the top-10, in my opinion, is Schlumberger (SLB), which has been a complete disaster for investors over the past decade.
The fund would have been better off allocating that 4% to put Phillips 66 (PSX) in the top-10 (instead of #11 with only a 2.6% weight). PSX is currently killing it on diesel considering the companies has a much higher distillate yield as compared to its peers Marathon Petroleum (MPC) and Valero (VLO), which are the #8 and #9 holdings with a combined 5.8% allocation.
Performance
The graphic below shows the 10-year average total return of the IYE, and as you might have suspected, despite the recent strong returns in the energy sector, the 10-year average annual return is an abysmal (2.57%):
iShares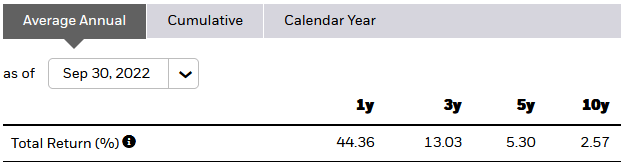
The chart below shows the 5-year share price performance of IYE against a couple of its peers: the SPDR Energy ETF (XLE), the Fidelity Energy ETF (FENY), and the Vanguard Energy ETF (VDE):
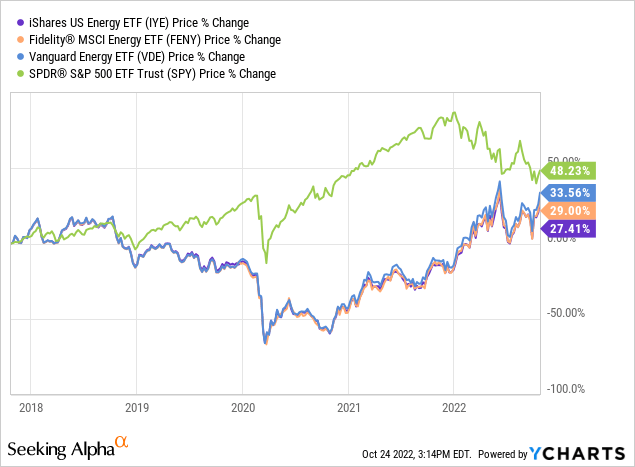
Note that despite the 2022 bear-market, and the huge rally in energy stocks this year, the S&P500 has still outperformed all of these energy funds over the past 5-years. The Vanguard ETF comes out on top, significantly outperforming the Fidelity and iShares funds (by about 4.5% and 6.0%, respectively). Part of is outperformance over IYE is because VDE has a much lower expense ratio (while FENY’s is the lowest):
- VDE: 0.10% expense ratio
- IYE: 0.39% expense ratio
- FENY: 0.08% expense ratio
Looking at these numbers, I see no reason why an energy investor would chose the IYE ETF given its expense ratio is a whopping ~30 basis points higher than its peers.
Risks
The primary risk for investing in an energy ETF at this point in the cycle is that O&G prices will fall as a result of a large drop in demand and the stocks will follow. That scenario could play out given large headwinds facing the global economy: high inflation/interest rates, covid-19 shut-downs in China, Russia’s war-on-Ukraine, a severe recession, etc.
Upside catalysts include US producers continuing to refuse to produce up to their potential, a rebound in demand from China, and more action taken by OPEC+ (i.e. cutting production further) to inflict even more damage on the economies of the U.S., the EU, the emerging markets, and – indeed – the global economy.
The EV transition poses a threat to long-term demand for gasoline (i.e. oil).
In Tesla’s Q3 earnings report last week, the company said it produced over 365,000 vehicles and delivered over 343,000 vehicles (+54% yoy). Indeed, on the Q3 conference call, Tesla CEO Elon Musk said:
Demand is a little higher than it would otherwise be. But as I said earlier, we are extremely confident of the great Q4, and we anticipate continuing to grow our vehicle production, sales deliveries by — on average 50% a year as far into the future as we can see.
Summary & Conclusion
There is obviously a number of good reasons why investors need to be directly exposed to the U.S. energy sector. Dividends is one good reason, and total returns is another given the very strong FCF these companies are generating and that is juicing their stock prices. However, the IYE isn’t the energy ETF for me – and probably isn’t for you either. Its expense fee of 0.39% is way out-of-sync with its peers, and the 4% allocation to Schlumberger is very difficult for me to understand. Either VDE or FENY is a better choice, or, you could simply choose to buy a number of the top names – for instance, Chevron, ConocoPhillips, and Phillips 66. All are spinning off strong free-cash-flow and strong dividend (and dividend growth) for investors.
Be the first to comment