

ChrisHepburn
The U.S. housing market has softened considerably since I last wrote about homebuilders in February. Back then I had four reasons why I thought profit margins for homebuilders were going to get squeezed. It’s taken several months, but it is starting to look like that trend is beginning.
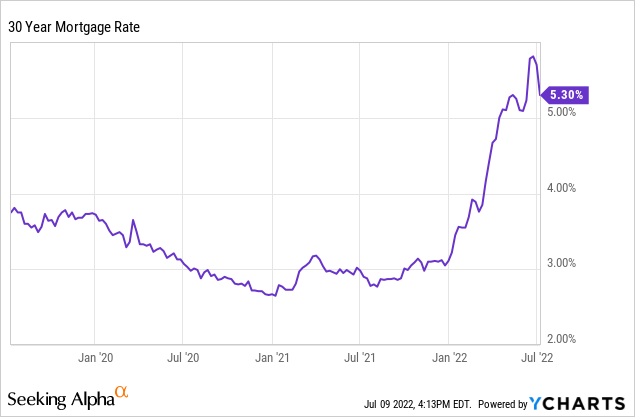
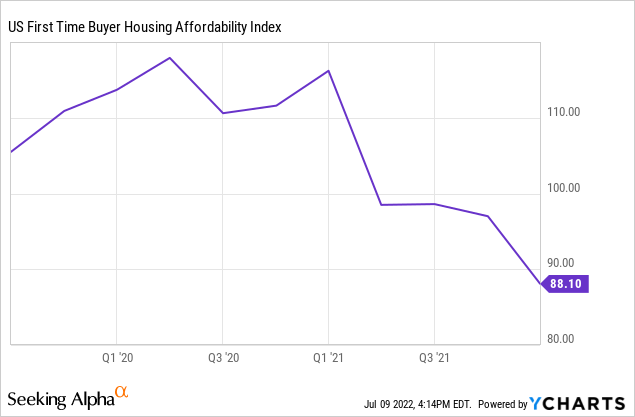
The entire investment thesis is centered around the 30-year mortgage rate. It was 3.7% in February and has climbed to 5.3% today. This change has absolutely cratered housing affordability and hollowed out homebuyer sentiment. The Fannie Mae Home Purchase Sentiment Index has dropped to 64.8. Less than 20% of those surveyed said it is a good time to buy a home, as the First Time Buyer Housing Affordability Index has fallen to 88.
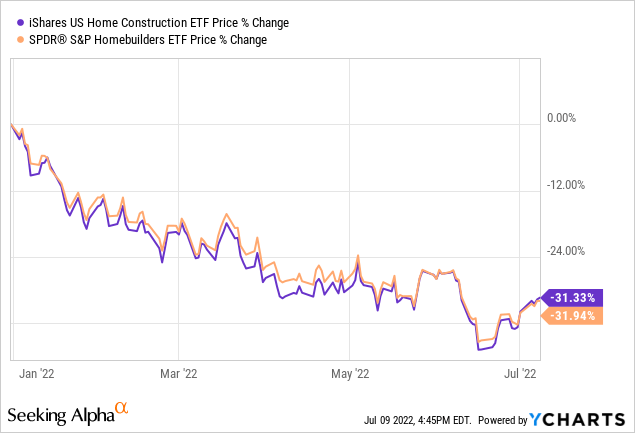
These measurable impacts to affordability are going to affect the bottom line for homebuilders. In June 2022, the monthly mortgage payment on the average new home was $2,600, which has doubled since January of 2021. The market has anticipated this issue, resulting in significant losses to homebuilder stocks in 2022. The iShares U.S. Home Construction ETF (BATS:ITB) and SPDR Homebuilders ETF (XHB) are both down over 30%.
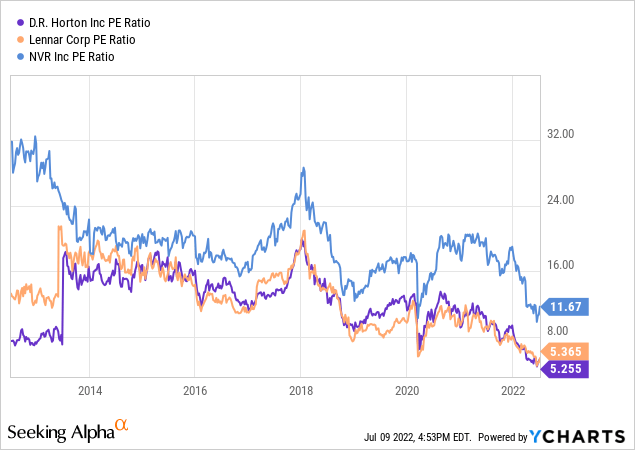
The result is the most attractive valuations in homebuilders in over a decade. As Brad Thomas pointed out in his recent article, homebuilder stocks are trading at very low valuations while profit margins continue to move higher. Today, ITB holdings LEN and DHI trade under 6x earnings.
Examine the following chart of price to earnings multiple for DHI from FAST Graphs. The last time this builder was valued so low was August of 2006, right before the Case Shiller Home Price Index rolled over. With hindsight, we know that DHI was a value trap in 2006 after falling 80% by 2008. With history (and data), we can see that homebuilders are a value trap, yet again.
FAST Graphs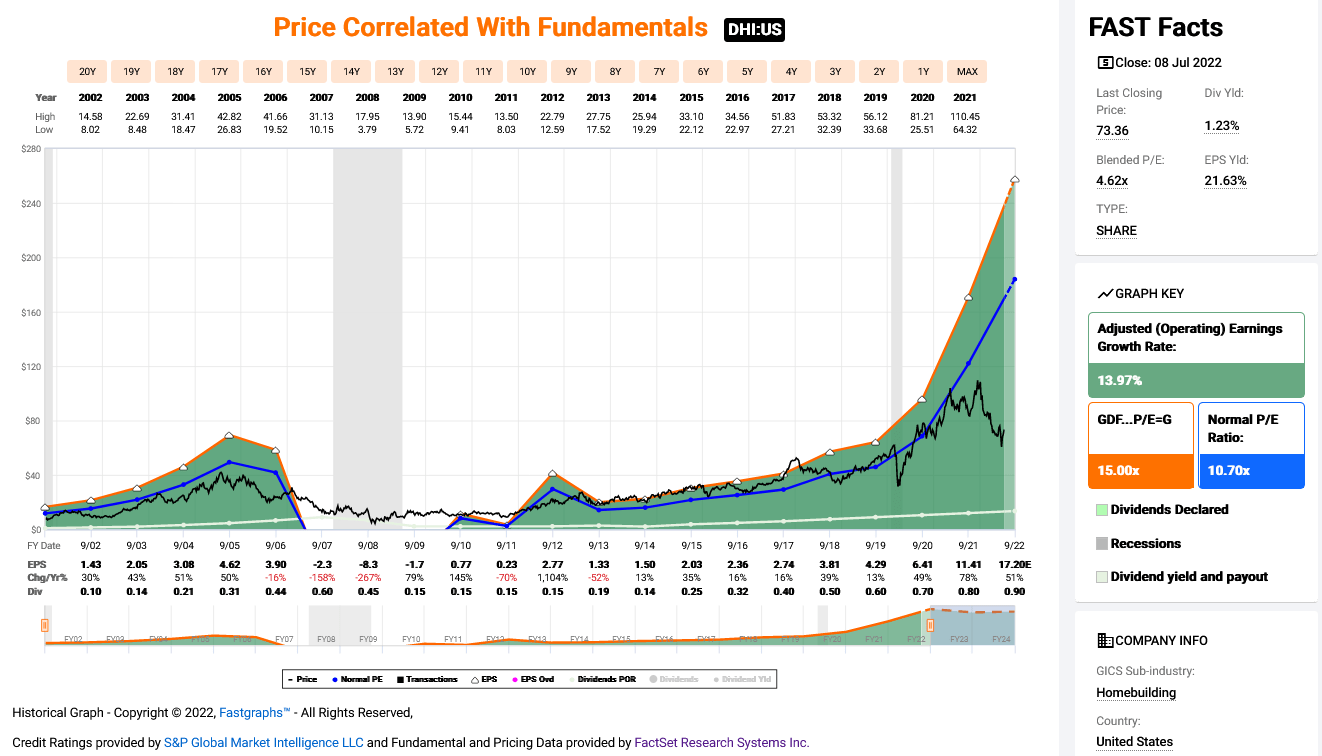
The Peak Is Near
House prices in the U.S. have continued relentlessly higher. Redfin reports the median sales price in May was an all-time high of $430,000. This is quite astonishing when compared to the cost of home ownership today.
Below is a chart from John Wake and realestatedecoded.com of the Real Mortgage Payment Price Index. In my opinion, this is the truest measure of housing valuation. This index adjusts the Case-Shiller Home Price Index for inflation and the cost of financing.
John Wake, Realestatedecoded.com (used with permission)
The last data point on the chart is April, which is a composite of three months of data. In April, it recorded a value higher than the peak of 126 in July 2006. Today, over three months after April, the index is higher still, perhaps at 135. This is screaming overvalued.
Despite price, signs of a slowdown in the housing market are impossible to ignore. Mortgage rate locks for second home purchases are down 50% YOY in June. Redfin has found that in the hottest housing markets as many as 40% of homes listed for sale are experiencing price cuts. As a whole, the market has the most price reductions since 2015 while the Homebuyer Demand Index is the lowest in three years, seasonally adjusted.
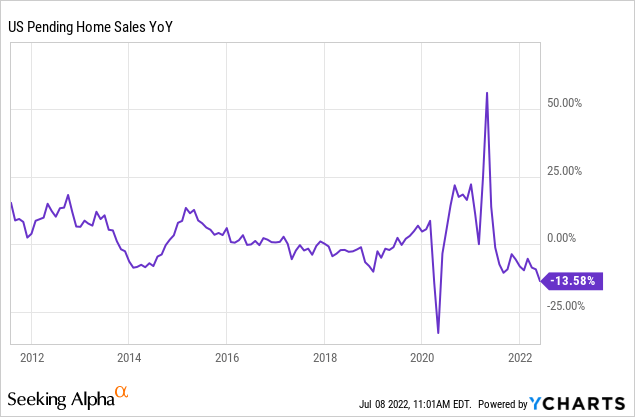
The rate of pending home sales contract cancellations has risen to 14.9% in June, the highest since April 2020. Pending home sales have declined to -13.5% YOY as home buyer enthusiasm wanes. As one example, active listings in the Phoenix area MLS have reached a seasonally adjusted 5-year high. In June, Realtor.com recorded an 18.7% YOY increase in inventory nationwide, the highest increase on record.
Perhaps prices could remain elevated with falling sales if inventory was limited. Contrary to popular belief, that is not the case. The ratio of housing inventory to population and housing inventory to working age population in the U.S. are near 20-year highs that rival those of 2008. The average household size in the U.S. is 2.6 in 2022, compared to 2.58 in 2010.
Federal Reserve Economic Data | FRED | St. Louis Fed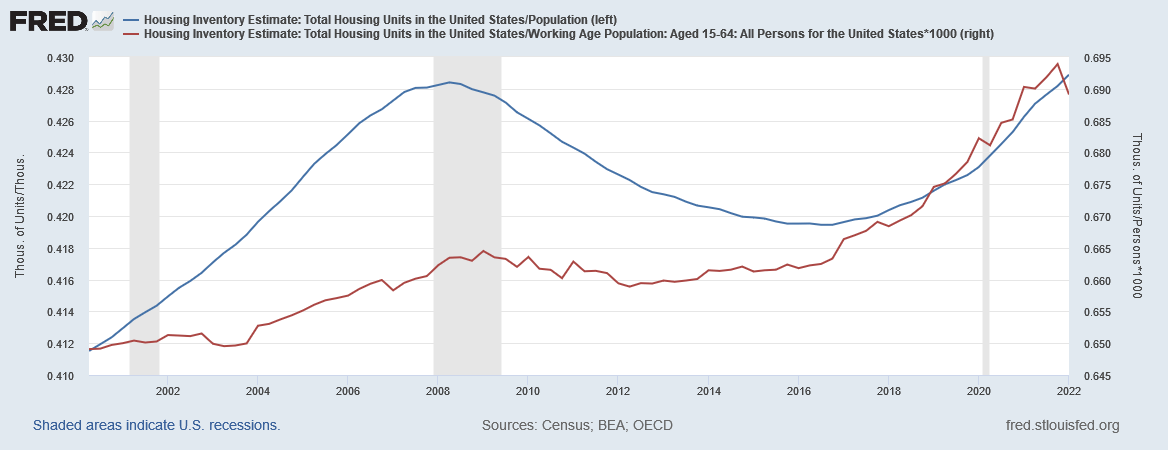
Foreclosures are now ramping up. The ATTOM U.S. Foreclosure Market Report showed a 39% QoQ and 132% YoY increase in foreclosure filings in Q1 2022. ATTOM Executive vice president Rick Sharga had this to say:
Foreclosure activity has continued to gradually return to normal levels since the expiration of the government’s moratorium, and the CFPB’s enhanced mortgage servicing guidelines. But even with the large year-over-year increase in foreclosure starts and bank repossessions, foreclosure activity is still only running at about 57% of where it was in Q1 2020, the last quarter before the government enacted consumer protection programs due to the pandemic.
It is not promising that the rate of foreclosures is still below pre-pandemic trend. It suggests that a reversion to mean would add more supply to the market and that trend is in motion.
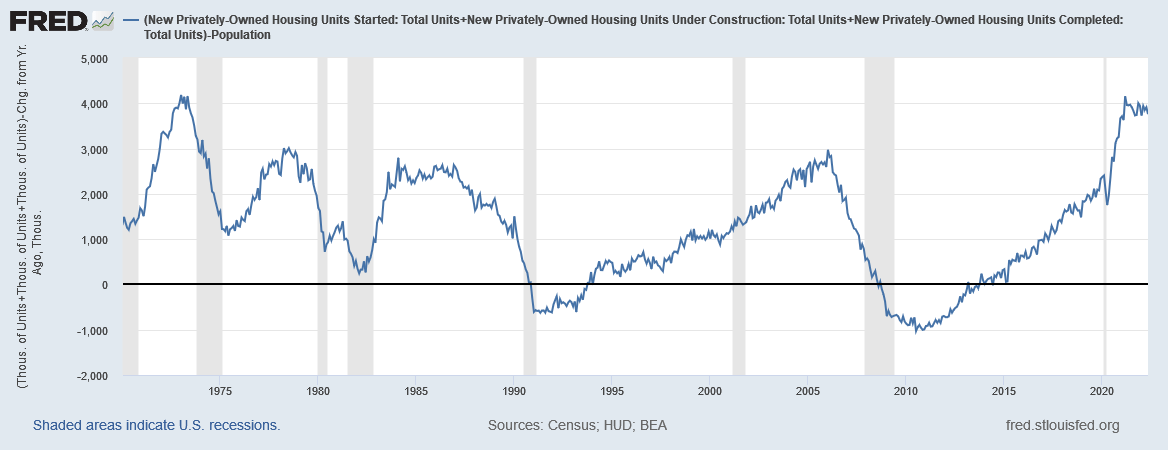
Speaking of supply, below is a chart of the number of new privately-owned housing units started, under construction, and completed in thousands [blue] compared to the growth in U.S. population in thousands [red]. The second chart is the difference between new housing units and population growth. The difference is the highest since 1973 at 3.7 million housing units above population growth. The last high was February of 2006 at 3 million units above growth. I believe this chart is putting in a top and heading toward mean reversion near 0 over the decade.
Federal Reserve Economic Data | FRED | St. Louis Fed Federal Reserve Economic Data | FRED | St. Louis Fed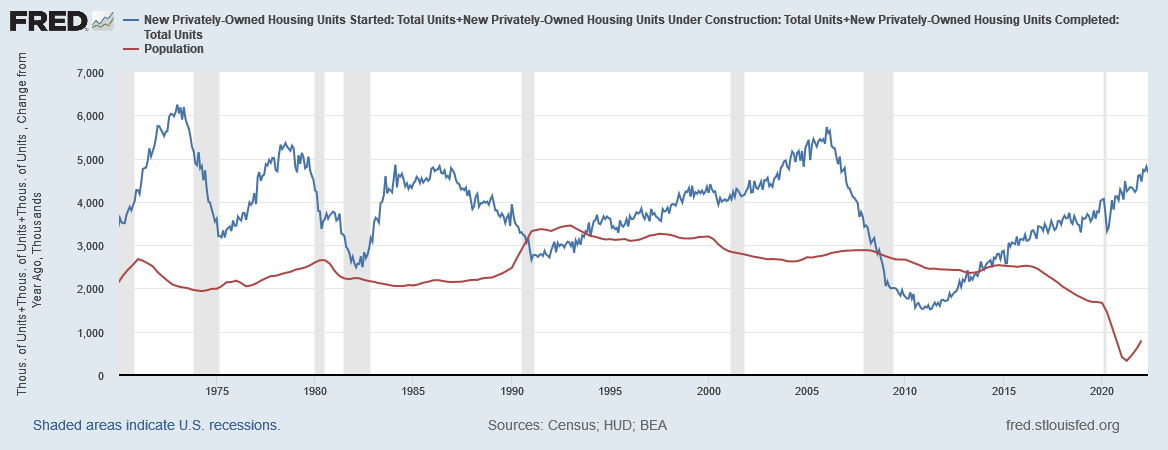
John Wake, in his article “The Great Appreciation Of Home Prices Is Now Over,” stated:
We might say that more than 100% of the real, inflation-adjusted appreciation in house prices from January 1990 to January 2021 was due to lower interest rates.
Now that mortgage interest rates appear to have bottomed out, what happens to real house price appreciation in the future?
I’ll answer that, John: appreciation goes down. All too often it is forgotten that lower mortgage rates cause home prices to rise and vice versa. Based on current mortgage rates, home prices would need to fall 20-30% just to be equal to 2020 home prices.
The Market Is Saying “Value Trap”
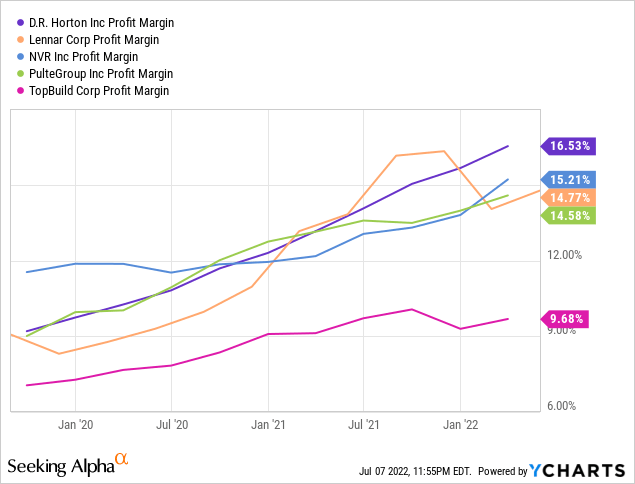
To my surprise, homebuilders have been able to grow their profit margins thus far this year. Lennar reported a 490-basis point increase to net margins in Q2 2022 to 23.4%. Their gross margin was 29.5% and are guiding for home sales gross margins of 28.5%-29.5% in Q3 2022.
I believe that builders have been able to maintain margins because new home prices have continued to grow for the following reasons:
- Many home buyers signed contracts for new homes many months prior to the rise in mortgage rates and are dissuaded from cancelling those contracts.
- Many home buyers rushed to buy a home as mortgage rates began to climb in order to lock in rates that may not return for years. This rate FOMO combined with rising price FOMO created a powerful incentive for home buyers and investors.
- Mortgage rates began to rise in earnest in January. Many buyers had homes under contract or locked in rates that took 60-90 days for transactions to settle.
- The housing market changes slowly. Buyers and sellers are both accustomed to the recent seller’s market where price is non-negotiable. It first leads to a stalemate situation where buyers pause while price is steady. Price falls only when sellers need to move their property.
For these reasons, I expect that changes in home price could easily lag behind changes in mortgage rates by 3-6 months. Basically, that brings us to today.
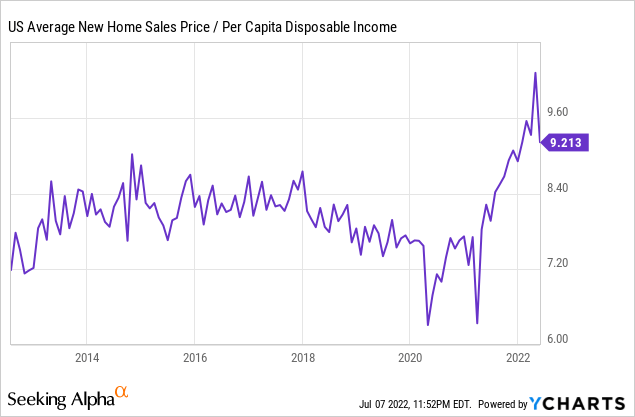
In May the average sales price for a new home sold in the U.S. declined by a whopping 10%. It is the largest MoM decline since September 2014. It may be premature, but the chart looks like it is printing in a top to me. That month homebuilders reported a modest cancellation rate of 10.4% YoY but by June cancellation rates rose to 14.5%. Aaron Layman pointed out one anecdote regarding a DHI development:
Nearby DR Horton development which was selling like hotcakes (from of a waiting list of customers) just a few months ago is now offering 5% BTSAs and $10,000 in buyer closing costs.
Charts by TradingView (adapted by author)
As a result, the new home price divided by per capita disposable income ratio declined to 9.2. This level is still above the pre-pandemic mean when mortgage rates were under 4%.
Take note that in 2008 homebuilder profit margins went from solid to negative in a matter of months. Leading up to the drop profit margins accelerated higher. Current margins have similarly been accelerating.
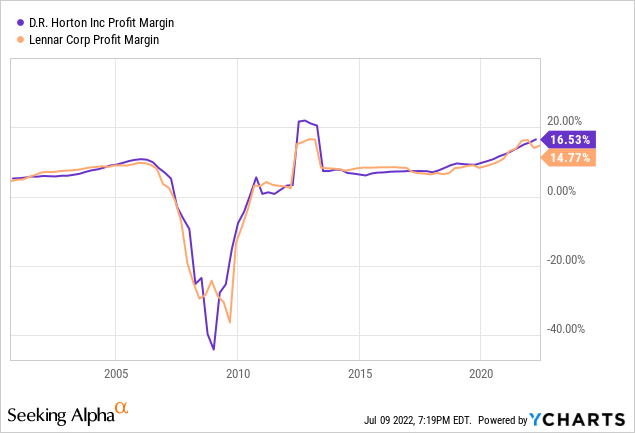
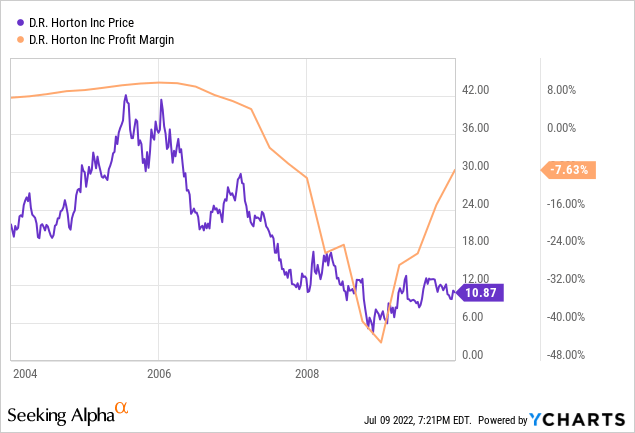
During the 2006-08 housing crash the share price of DHI began to decline prior to a fall in profit margins. The stock was already down 50% by the time profit margins turned negative.
Today the share price is falling while margins remain steady. The stock has lost over 30% already. I think the market has seen this movie before and is acting even earlier than it did last time.
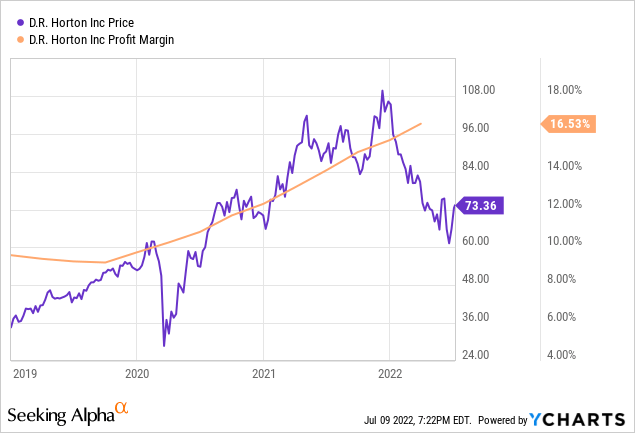
The first chart below is the share performance of DHI from 2003-2009 and the Case Shiller Home Price Index. The second chart is the share performance of DHI from 2019 to present and Case Shiller Home Price Index. The chart patterns appear eerily similar. While analogs are unreliable it does give us a sense about how this sector could behave.
Charts By TradingView (adapted by author) Charts By TradingView (adapted by author)

Summary
To be clear, I’m not saying this is the 2008 housing crash all over again. There are both similarities and differences to today. I wrote about them in detail in my article, U.S. Housing is a Dead Man Walking.
What I am suggesting is that Homebuilders cannot sustain current profit margins with current mortgage rates. Either rates decline or prices decline.
If we were to use 2006-2008 as an analog to today, I would compare the current market to that of Q3 2006. At that time, homebuilders like DHI rallied 37% over 6 months after reaching very oversold levels with the tailwind of falling mortgage rates. Today, homebuilders are likewise very oversold. After that correction homebuilders went on to lose 85% over two years. I think they could do at least half that this time.
Charts by TradingView (adapted by author)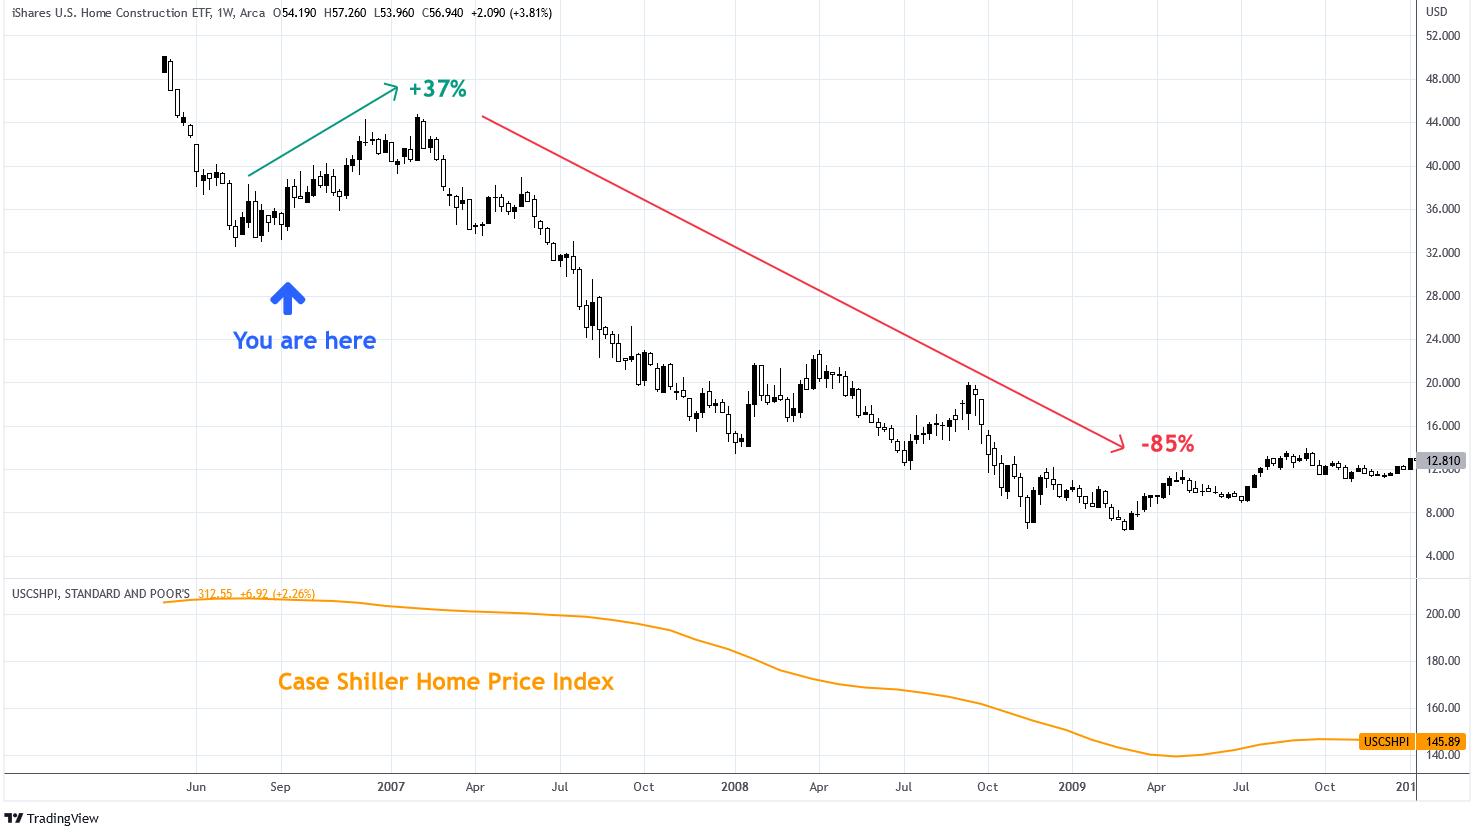
I shorted ITB when it broke support at $62 and closed my short last week. I’m looking for a retracement to the $62-65 level to reenter a short position.
Charts by TradingView (adapted by author)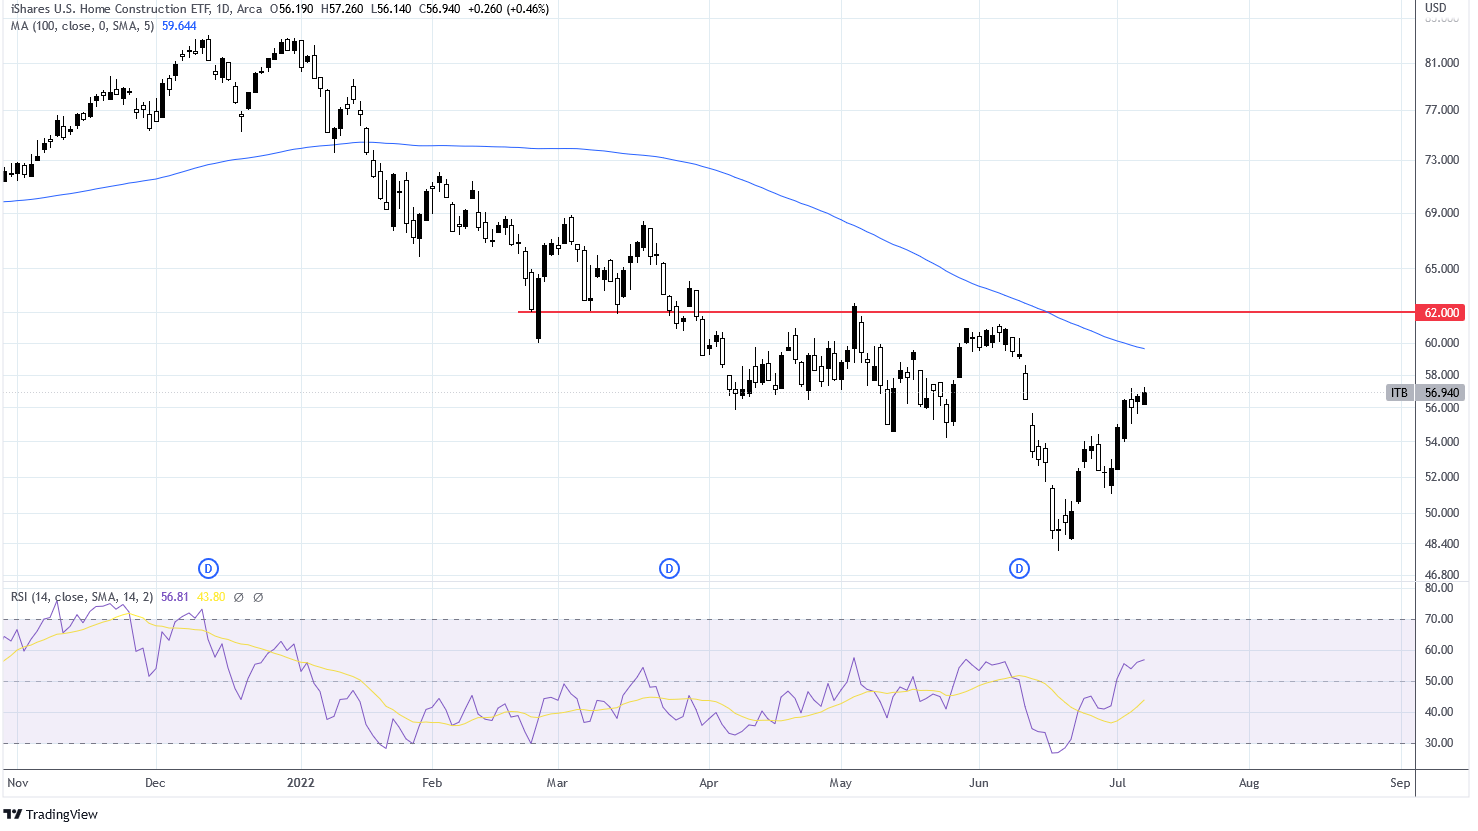
Be the first to comment