

utah778/iStock via Getty Images
This dividend ETF article series aims at evaluating products regarding the relative past performance of their strategies and quality metrics of their current portfolios. As holdings and their weights change over time, I may update reviews from time to time.
DVY strategy and portfolio
The iShares Select Dividend ETF (NASDAQ:DVY) has been tracking the Dow Jones U.S. Select Dividend Index since November 2003. Its current distribution yield is 2.93% and the total expense ratio is 0.38%.
As described in the prospectus by iShares, eligible stocks are issued by companies of the Dow Jones U.S. Index, excluding REITs, that pass the following rules:
- Dividend-per-share above its five-year average.
- Five-year average dividend coverage above 167%.
- Average daily trading volume above 100,000 shares (200,000 for new constituents).
- Paid dividends in each of the previous five years.
- Positive earnings-per-share.
- Float-adjusted market cap of at least $2 billion ($3 billion for new constituents).
The underlying index is composed of 100 of the highest dividend-yielding eligible stocks. It is reconstituted annually and rebalanced quarterly.
DVY invests almost exclusively in U.S. companies (98.2%), about 50% in the mid-cap segment, 39% in large companies, and 11% in small caps. DVY is much cheaper than the S&P 500 (SPY) regarding usual valuation ratios, reported in the table below.
|
DVY |
SPY |
|
|
Price / Earnings TTM |
13.35 |
21.92 |
|
Price / Book |
1.95 |
4.23 |
|
Price / Sales |
1.44 |
2.94 |
|
Price / Cash Flow |
9.91 |
17.15 |
The heaviest sectors are utilities (26.4%) and financials (21.5%). Other sectors are below 10%. Compared to SPY, the fund massively overweights the top 2 sectors, and to a lesser extent consumer staples, materials and energy. It underweights technology, consumer discretionary, healthcare, industrials, and communication services, and excludes real estate by design.
DVY sectors (Chart: author; data: Fidelity)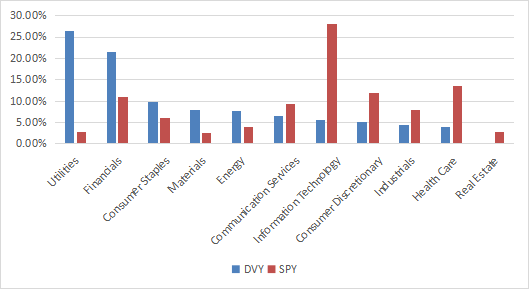
The top 10 holdings, listed below with weights and some fundamental ratios, represent about 18% of asset value. The largest holding is 2.46%, so risks related to individual stocks is low.
|
Ticker |
Name |
Weight% |
EPS growth %TTM |
P/E TTM |
P/E fwd |
Yield% |
|
Altria Group Inc |
2.46 |
-44.48 |
40.34 |
11.09 |
6.70 |
|
|
ONEOK Inc |
2.03 |
144.80 |
21.17 |
18.09 |
5.28 |
|
|
Valero Energy Corp |
1.84 |
164.66 |
45.69 |
12.49 |
3.79 |
|
|
International Business Machines Corp |
1.81 |
1.73 |
20.26 |
13.13 |
5.10 |
|
|
Philip Morris International Inc |
1.75 |
12.95 |
17.11 |
16.60 |
5.02 |
|
|
Gilead Sciences Inc |
1.66 |
6218.18 |
12.36 |
9.40 |
4.79 |
|
|
AT&T Inc |
1.59 |
464.54 |
8.59 |
8.06 |
4.68 |
|
|
Edison International |
1.58 |
0.97 |
35.46 |
15.69 |
3.96 |
|
|
LyondellBasell Industries NV |
1.57 |
294.80 |
5.98 |
6.51 |
4.51 |
|
|
Verizon Communications Inc |
1.57 |
23.76 |
9.90 |
9.67 |
4.86 |
Historical performance
Since inception in November 2003, DVY has underperformed SPY in total return and risk-adjusted performance (Sharpe ratio). The difference in annualized return is moderate: 1.3 percentage points. A deeper maximum drawdown points to a higher risk.
|
Total Return |
Annual.Return |
Drawdown |
Sharpe ratio |
|
|
DVY |
386.92% |
8.98% |
-62.88% |
0.58 |
|
SPY |
508.63% |
10.31% |
-55.42% |
0.67 |
Data calculated with Portfolio123
The next chart plots the equity value of $100 invested in DVY and SPY since DVY inception.
DVY vs, SPY (Chart: author; Data calculated with Portfolio123)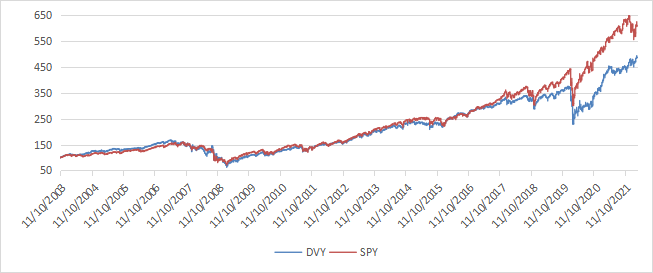
DVY was almost on par with SPY in its first 10 years, then it started underperforming in 2017, like many dividend funds.
In previous articles, I have shown how three factors may help cut the risk in a dividend portfolio: Return on Assets, Piotroski F-score, and Altman Z-score.
The next table compares DVY since inception with a subset of the S&P 500: stocks with above-average dividend yield and ROA, good Altman Z-score and Piotroski F-score, and a sustainable payout ratio. It is rebalanced annually to make it comparable with a passive index.
|
Total Return |
Annual.Return |
Drawdown |
Sharpe ratio |
|
|
DVY |
386.92% |
8.98% |
-62.88% |
0.58 |
|
Dividend & quality subset |
899.21% |
13.32% |
-42.60% |
0.87 |
Past performance is not a guarantee of future returns. Data Source: Portfolio123
The dividend quality subset beats DVY by 3.3 percentage points in annualized return and shows a much lower risk in drawdown. However, the fund’s performance is real, and the subset is hypothetical. My core portfolio holds 14 stocks selected in this subset (more info at the end of this post).
Scanning DVY with quality metrics
I have scanned DVY holdings with my quality metrics, considering that risky stocks are companies with at least 2 red flags from among: bad Piotroski score, negative ROA, unsustainable payout ratio, and bad or dubious Altman Z-score. I have excluded financials where these metrics are less relevant. With these assumptions, 14 stocks out of 100 are risky, and they weigh about 15% of asset value.
Based on my calculation, DVY’s aggregate Altman Z-score Piotroski F-score and return on assets are significantly below SPY’s aggregate values. These metrics point to a portfolio quality inferior to the benchmark.
|
Aggregates |
Altman Z-score |
Piotroski F-score |
ROA% TTM |
|
DVY |
2.00 |
6.0 |
5.38 |
|
SPY |
3.56 |
6.5 |
7.87 |
Takeaway
DVY holds 100 dividend stocks selected with systematic rules. REITs are excluded. Almost 48% of asset value are concentrated in two sectors: utilities and financials.
Value metrics look attractive, but they may be the result of sector bias: financials naturally have low valuation ratios. Portfolio quality is significantly below the benchmark according to my metrics.
DVY has underperformed the S&P 500 in total return since 2017. Historical data also point to a higher risk in drawdown. The 3% yield is attractive for income-seeking investors, but risk-adjusted performance is disappointing compared to dividend growth funds such as Vanguard Dividend Appreciation ETF (VIG) (review here) and WisdomTree U.S. Dividend Growth ETF (DGRW) (review here). For transparency, my equity investments are split between a passive ETF allocation (DVY is not part of it) and an actively managed stock portfolio, whose positions and trades are disclosed in Quantitative Risk & Value.
Be the first to comment