
fotofrog/E+ via Getty Images
Introduction
The Vanguard Consumer Staples ETF (NYSEARCA:VDC) is a passively managed ETF that tracks the MSCI US Investable Market Consumer Staples 25/50 Index. Stocks here, typically consist of large (~88% of the total portfolio), medium, and small-cap stocks that are exposed to food, beverage, tobacco manufacturing/distributing, personal products, non-durable household goods, hypermarkets, and food/drug retailing.
Investment Rationale
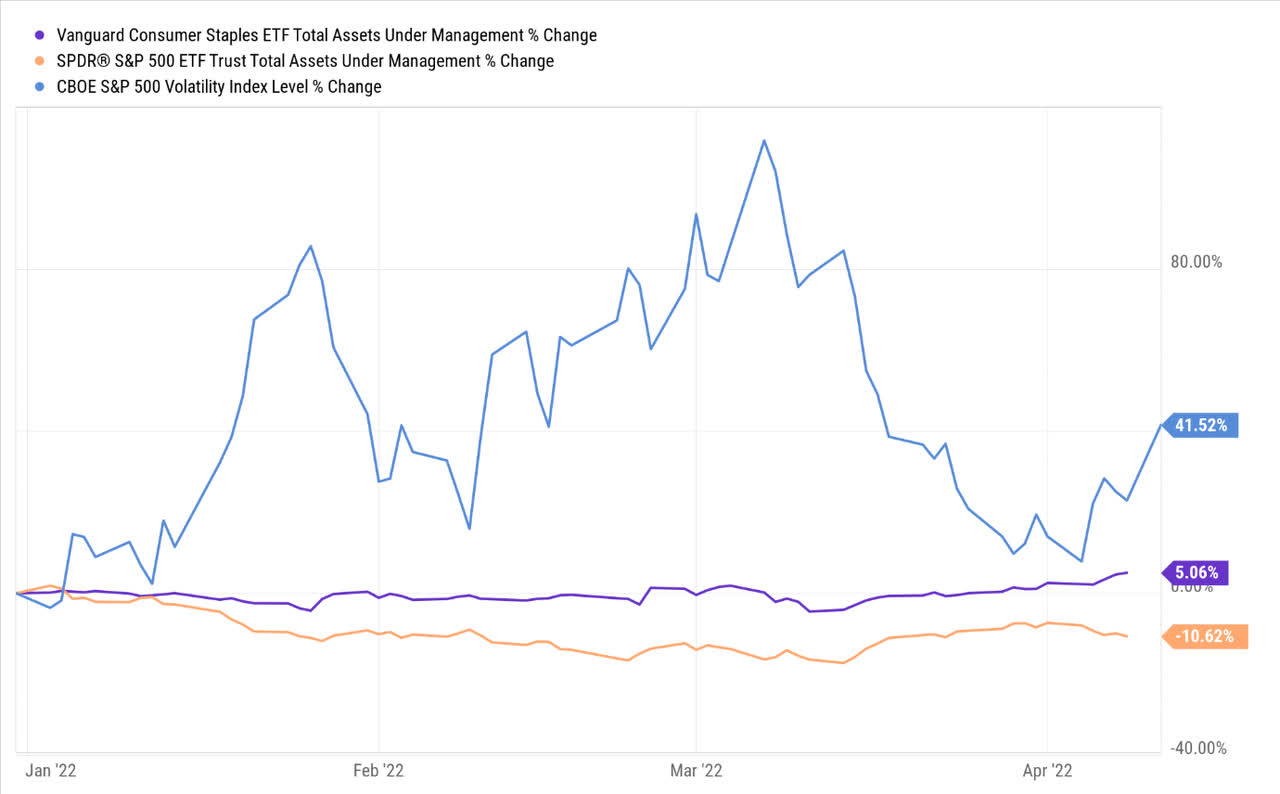
The staples sector is perceived to be something of a staid, unremarkable space, but I believe, if you want to build sustainable wealth over time, it isn’t sufficient to only own sectors that do well during periods of general market buoyancy; one also ought to expose a part of your capital to sectors such as consumer staples which can serve as metaphorical parachutes during a broad market freefall, or when volatility picks up steam (VDC is less sensitive to movements of the market as exemplified by a 3-year beta of only 0.66x). We’ve seen evidence of its usefulness already this year; on a YTD basis when the VIX has risen by 41%, the broader markets as represented by the SPY ETF has seen its AUM compress by 10%. During that same period, VDC has seen its AUM grow by 5%.
YCharts
The VIX may have cooled off for now, but I’m not sufficiently convinced that what we’re seeing is a return to normalized market conditions as there seems to be a lot of uncertainty around. The Russian-Ukraine talks may or may not be resolved soon enough, but we’ve already seen evidence of how this fiasco has disrupted the commodity markets and the broad supply chain; it would be imprudent to believe that the ramifications of this will be rectified overnight and what you’re likely to see is the lingering aftereffects of this development all through the year.
Then, most central banks the world over are currently in the midst of painting a canvass where the cost of capital is likely to become dearer and some would say, much too soon. Could this disrupt the fledgling post-pandemic growth narrative and trigger recession risk? The bond markets certainly appeared to be building some probability of this, as flagged by the inversion of the 2Y/10Y spread which flipped recently; over recent decades we’ve seen how the inverted yield curve has preceded recessionary patterns. Under tighter monetary conditions, astute investors are also likely to be more exacting with their stock screening lenses and I believe staple stocks with their solid balance sheets and strong cash positions will screen well as the investment climate becomes more fragile.
You also have this lingering inflation headwind which does not appear to be easing off; when I look at VDC’s portfolio, I can see that close to three-quarters of the portfolio consists of names from staple sub-segments such as household products, packaged food, beverages, hypermarkets, etc. The product portfolio linked to these sub-segments is inherently inelastic in nature, meaning these entities are well placed to pass on high input cost inflation, without witnessing a collapse in demand. This innate ability to maintain their margins through different economic cycles is not something that most other sectors can offer.
Stockcharts
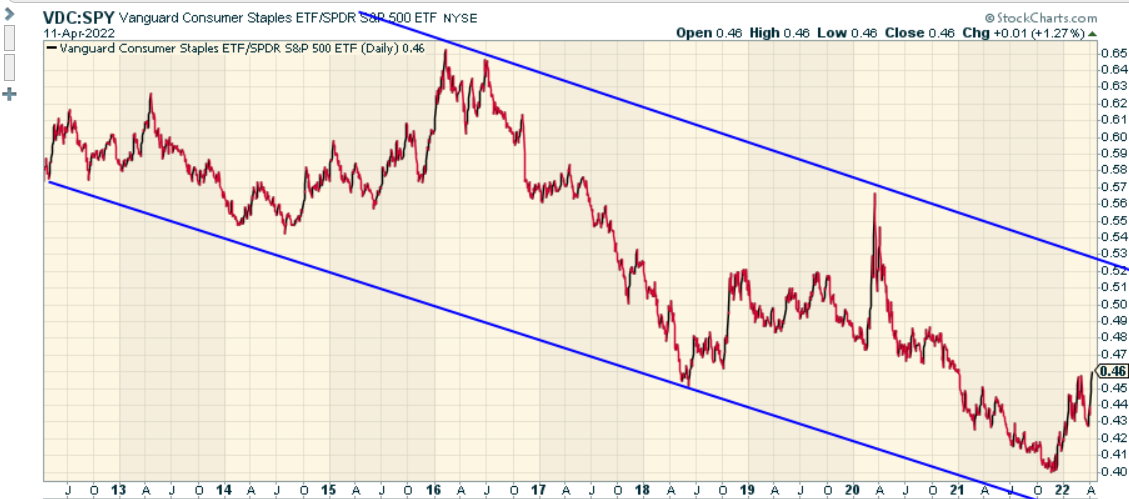
Then also consider that staple stocks have lost ground relative to the S&P500 over time (as represented by the downward sloping channel of the VDC: SPY ratio) and there’s a good opportunity to make up for lost ground, particularly as the ratio is still some way from the upper boundary of the channel.
VDC vs Peers
To measure the Vanguard Consumer Staples ETF’s qualities as a long-term investment vehicle, I’ve gauged the ETF across different lenses, and whilst it fairs reasonably well when compared to the broad ETF universe, I don’t believe it is the best option you can pick up in this space.
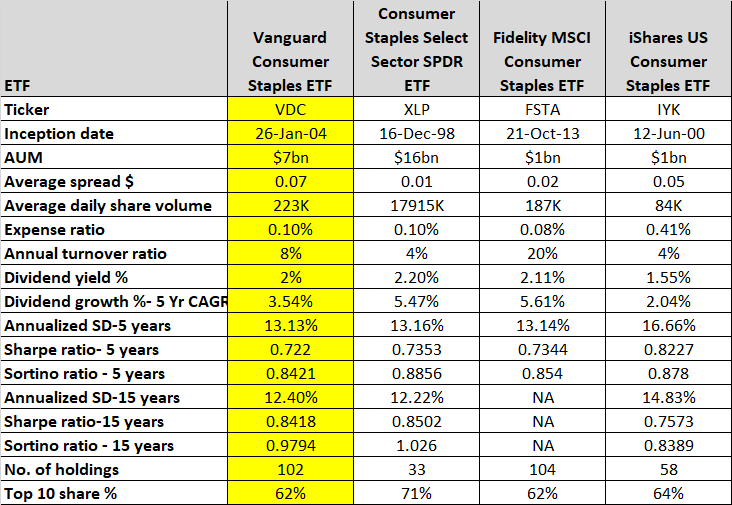
Firstly, it isn’t the most popular pick around; that honor goes to the Consumer Staples Select Sector SPDR ETF (XLP) which has been around since late 1998 (VDC was listed in early 2004) and has managed to accumulate a whopping $16bn in AUM (VDC- $7bn).
Then, if you’re not interested in sticking around for the long haul and are looking at staple options only from a trading perspective, I believe there are more accessible options including XLP, which offer much lower spreads (average spreads of $0.01 vs $0.07 for VDC); even other less popular options such as the Fidelity MSCI Consumer Staples ETF (FSTA) and the iShares US Consumer Staples ETF (IYK) offer lower spreads of $0.02 and $0.05 respectively.
Then consider the cost efficiency and the relative stability of the respective portfolios. As far as the cost efficiency goes, IYK appears to be the one outlier here with an expense ratio that is more than 4x higher than the other options including VDC (FSTA is the cheapest with a ratio of just 0.08%). If you’re sticking around for the long haul, you ideally want a portfolio that does not resort to ample churn, and I believe you can’t have too many complaints with VDC’s low portfolio turnover ratio of just 8%, but do note that XLP’s ratio is only half as much as this.
From an income angle, not an awful lot between these ETFs, but VDC comes in third best both from a yield angle and a growth angle.
Finally, consider the short and long-term risk-adjusted track record of these ETFs. There’s no guarantee that we see a return of these stats going forward but I believe it helps provide some perspective with regards to what one is getting into. With the exception of IYK, all three ETFs appear to have the same volatility profile (be it over a 5-year basis or a 15-year basis) as represented by the annualized standard deviation of monthly returns. The Sharpe ratio measures the ability of the ETF to generate excess returns after considering the standard deviation, and note here that VDC comes off with the lowest number on a 5-year basis and the second-lowest number on a 15-year basis (FSTA does not have a 15-year track record as it was only listed in 2013).
Then there’s the Sortino ratio which I believe is the more interesting risk-adjusted return metric as it helps shed light on how these ETFs have fared whilst coping with downside deviation. Once again over the last five years, VDC’s number is the lowest at 0.72, and whilst, there is an improvement over a longer time frame of 15 years, it still falls short of XLP’s number of 1.026.
What’s a key takeaway here? We know that all these ETFs are focusing on roughly the same stocks, but note that the ETF with the best performing risk-adjusted return stats (XLP) has the most focused and concentrated portfolio with only 33 stocks and a 71% top-10 weight. Based on these stats, one could perhaps question if VDC has a bunch of stocks that are largely just making up the numbers and reducing the overall efficiency of the ETF. It also does not appear as though spreading the portfolio across a wider pool of stocks (over 100 stocks as opposed to 33 stocks for XLP) has done anything meaningful in reducing the overall volatility of VDC as its annualized monthly standard deviation both across five years and 15 years is around the same level as XLP.
YCharts, Seeking Alpha, ETF.com
Closing thoughts- Is VDC A Buy, Sell, Or Hold?
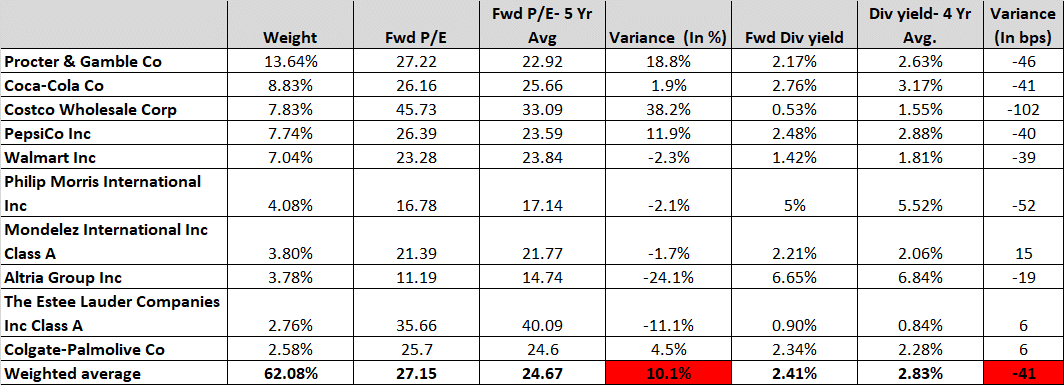
VDC appears to be a top-heavy ETF (the bottom 92 stocks only account for 38% of the total portfolio) and its prospects will largely be dependent on how those top 10 names fare. I’m not going to make any predictions with regard to the price trajectory of these stocks, but what’s evident is that value-conscious investors are unlikely to find the top-10 stocks particularly appealing.
Seeking Alpha
Note that the top-10 stocks trade at a weighted average forward P/E of over 27x, a 10% discount over the corresponding 5-year weighted average figure. Even from a dividend yield perspective, only the bottom two names of the top-10 appear to be trading at a better rate than their historical average with the overall forward yield well below the long-term average. This implies that it probably isn’t the most optimal point to be getting in.
Spreading the net beyond the top 10, note that the entire VDC portfolio trades at a forward P/E of 20.6x, this is pricier than the corresponding multiple of the broader markets, as represented by the SPY ETF which trades at 19.8x. Given VDC’s defensive usefulness, I suppose a slight premium shouldn’t be a problem, but then again, consider the drastic difference in the earnings potential of the broader markets and that of VDC. For SPY, YCharts shows forward earnings growth of 25% and a 5-year average of 14%. VDC pales in comparison with a forward earnings growth of 9% and a long-term earnings growth potential of only 7%.
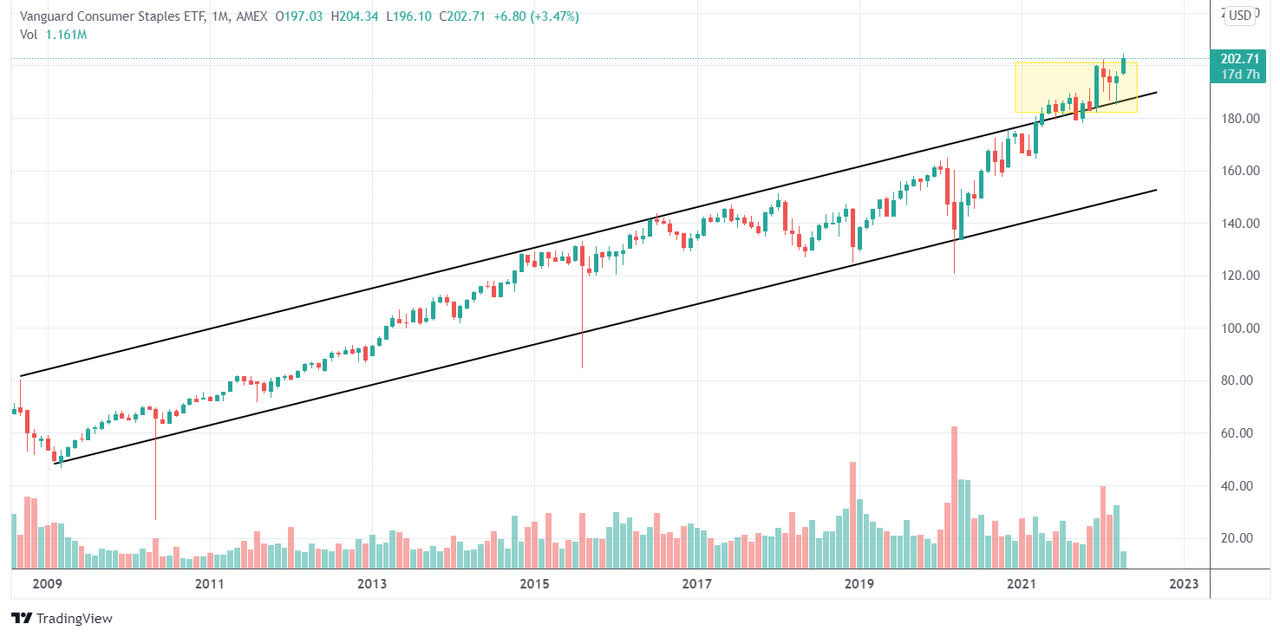
Trading View
Finally, consider the price imprints on the long-term chart of VDC; if you’re a momentum investor there’s a lot to like when you consider the developments over the past two months, but if you’re more value-conscious I’m not sure it’s the most optimal point to be latching on to VDC when it is trading at life time highs and also trading well above its long-term ascending channel. Clearing the risk-reward here isn’t ideal, so to conclude I rate VDC a HOLD.


Be the first to comment