

An image that illustrates the popular, incorrect idea that buying a REIT is like buying the kind of residential real estate most investors are familiar with. Kwarkot/iStock via Getty Images
I was recently asked whether the very popular Vanguard Real Estate ETF (NYSEARCA:VNQ) would be a good choice for income-seeking investors in a rising rate environment. Since it has been slightly more than a year since I looked at it, it’s time to take another look at the Vanguard Real Estate ETF. But first let’s review what I found when I looked at VNQ a year ago.
In 2021 VNQ Was Dominated by Tech Companies Using a REIT Corporate Structure
When I wrote about the Vanguard Real Estate ETF a year ago in my article VNQ: An Easy Way To Invest Clumsily In Real Estate, I concluded that VNQ was not a good way to invest in real estate, largely because a third of its value was concentrated in 10 top stocks. This isn’t’ quite as concentrated as are quite a few other sector ETFs I’ve been writing about. But the issue for me was that so many of those top holdings weren’t really investments in real estate.
Six of VNQ’s top holdings last year were categorized as “Specialty REITs.” That turned out to mean that that they were companies that used the REIT corporate structure to avoid corporate paying taxes but whose main business is not what your average investor thinks of when they think of Real Estate.
Three of the of the 10 largest companies in this market cap weighted ETF build, maintain, and rent out cell towers. They were American Tower (AMT) which made up 6.71% of the value of the entire Vanguard Real Estate ETF in March of 2021, Crown Castle International (CCI), which made up another 4.7%, and SBA Communications (SBAC) which made up another 1.98%. Two of these companies, Equinix (EQIX) and Digital Realty Trust (DLR), own and operate computer data centers. Together those two companies’ stock made up another 6.68% of the total value of VNQ. These technology-related REITs have been very profitable investments over the past several years, but when I reviewed their metrics last March they also looked extremely overvalued.
A Year Ago VNQ’s Dividend Was Too Low and Volatile To Attract Income Investors
The other problem I identified with VNQ a year ago was that its dividend was quite low for an investment that is bought almost entirely for that dividend given that the REIT corporate structure makes it very difficult for companies to grow their share price. That turned out to be a realistic assessment. Seeking Alpha’s Dividend Growth History for VNQ tells us that VNQ’s year end yield for 2021 was only 2.57%.
So how does VNQ look now?
What Do We Know About VNQ’s Current Holdings?
Not much, for several reasons, all of them having to do with Vanguard’s lack of transparency.
Vanguard’s Data is Almost 6 Weeks Out-Of-Date
To answer the question of what VNQ’s current holdings might be and how they were weighted after the recent Tech correction, I first went to the Vanguard Advisors website. But as is usual with all Vanguard ETFs that have a mutual fund partner, Vanguard currently reported information for VNQ is way out of date . The most current figures we are shown date back to Feb 28, 2022. Since VNQ’s price has surged a whopping 7.06% since Feb 28, it is quite possible that the actual weightings and the few other useful metrics Vanguard provides for VNQ may have changed. But for now we have to work with what we have.
VNQ Still Appears to be Top Heavy in Specialized REITs
Below you see a comparison of VNQ’s top holdings a year ago and as of Feb 28, 2022.
VNQ’s Top 10 Holdings
Vanguard, Dividend Data from Fasgraphs.com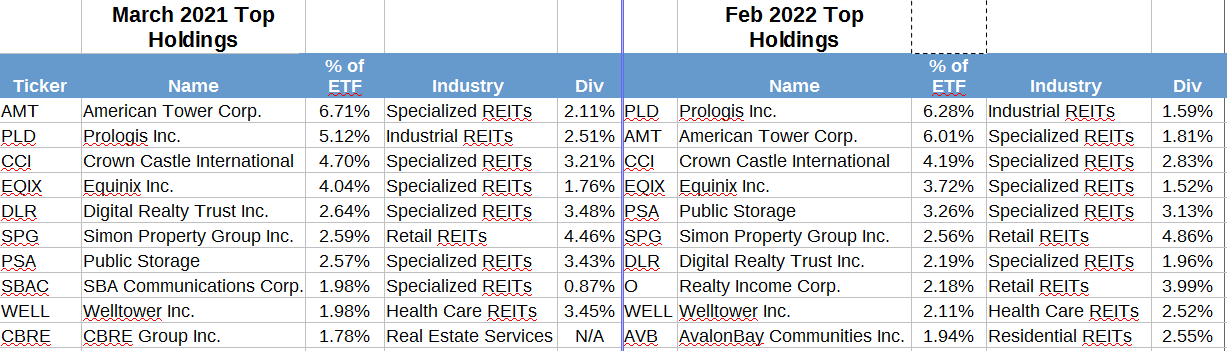
What we can deduce from the out-of-date list of holdings we have access to and their weights as of February 28, 2022 is that VNQ is still top heavy in the same kinds of stocks it was a year ago, with 34.44% of its total weight made up by its 10 top holdings. The biggest cell tower REITs, American Tower, Crown Castle International, and data center REITs Equinix and Digital Realty Trust were still listed in the 5 largest holdings. The third cell tower company, SBA Communications is now the 11th largest holding in VNQ. AvalonBay Communities (AVB) an apartment REIT has taken its place in the top 10. Realty Income (O) had made its way to the 8th largest holding, ranked by weight in that Top 10, making up 2.18% of the entire value of VNQ. It bumped CBRE Group (CBRE) down to being the 12th largest holding in VNQ.
Vanguard Does Not Publish REIT-Specific Valuation Metrics
I usually like to have a look at appropriate valuation metrics when I examine an ETF. But even if the metrics Vanguard provides us for VNQ were up-to-date they would be of little use in estimating the ETF’s valuation. That’s because Vanguard only provides us with valuation metrics like Price/Earnings Ratio and earnings growth rate. These metrics are appropriate for evaluating common stocks but they are not used to evaluate REITs.
Earnings per share are not all that useful a figure for evaluating the health of a corporation that, because of its REIT structure, is required to distribute at least 90% of its income to shareholders every year.
The commonly accepted financial metric that replaces earnings when evaluating a REIT is Funds from Operations (FFO). That’s because the amount of cash a REIT has access to tells us how healthy it is. But Vanguard doesn’t provide us with any data on how the funds from operations (FFO) of its holdings relate to their price.
Competitors’ Slightly More Transparent Data Is No Help Here
Sometimes I am able to estimate the valuation metrics of a Vanguard sector ETF if it tracks an index which is used by another ETF that does post its holdings and metrics daily. But in this case, I couldn’t use that strategy. It seems that VNQ is the only ETF currently tracking its MSCI Investable Market Real Estate 25/50 Index.
Though its most popular competitors are also market cap weighted and hold many of the same top stocks we find in VNQ, they all appear to follow different indexes. These indexes are probably ones commissioned by the ETF providers. Each ETF also holds a different number of stocks, so even commonly held stocks are held by each ETF in differing proportions.
Welcome to the new world of active stock picking disguised as passive index investing! The active element now has been buried in the design of these specially commissioned indexes the ETFs track. These indexes are tweaked periodically, and every so often these ETFs transition to new indexes.
A footnote on this Vanguard page tells us that Vanguard changed VNQ’s index most recently in 2018, and that before that VNQ also changed indexes in 2009. Given that, as we will see, VNQ’s performance has been trailing that of its competitors, don’t be surprised if Vanguard changes VNQ’s index again in another couple years. This is not your father’s index investing!
It is worth noting that all three of the other REIT ETFs I compared VNQ earlier provide Price/Cash Flow metrics for their ETFs. They range from a low of IYR’s 20.91 to XLRE’s 14.27 and SCHH’s high 24.64. These are slightly more helpful than P/E but I can’t find anything that tells me what a good range would be for this particular metric, or even if it is valid for comparing REITs.
Given that VNQ’s current top holding, Prologis (PLD)’s Price/FFO looks like this on FAST Graphs, I suspect we are still looking at a lot of over-valuation compared to historical Price/FFO ratios.
Prologis Price, FFO, and Dividend History
FAST Graphs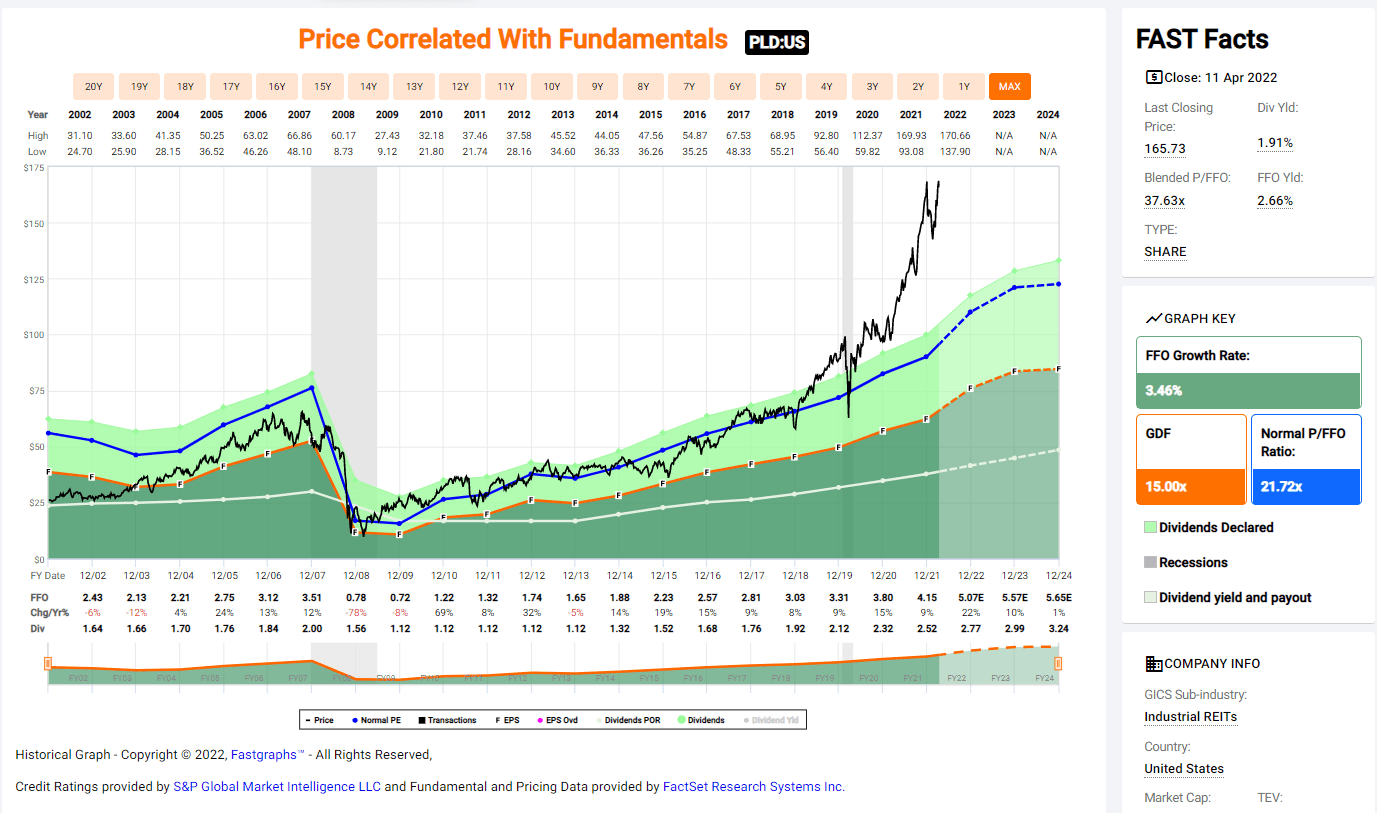
VNQ’s Trailing 12-Month Performance Lags Its Closest Competitors
As you can see from the graph below, though VNQ and its mutual fund share class partner VGSLX dominate the market for REIT funds and ETFs with assets under management of $81.1 billion, this past year we saw quite a bit of difference between the total return of VNQ and that of the next most heavily traded REIT ETF competitors. Those competitors were the Real Estate Select Sector SPDR Fund (XLRE), The Charles Schwab U.S. REIT ETF (SCHH) and iShares U.S. Real Estate ETF (IYR).
VNQ 1 Yr Return Compared to Most Active REIT ETF Competitors
Seeking Alpha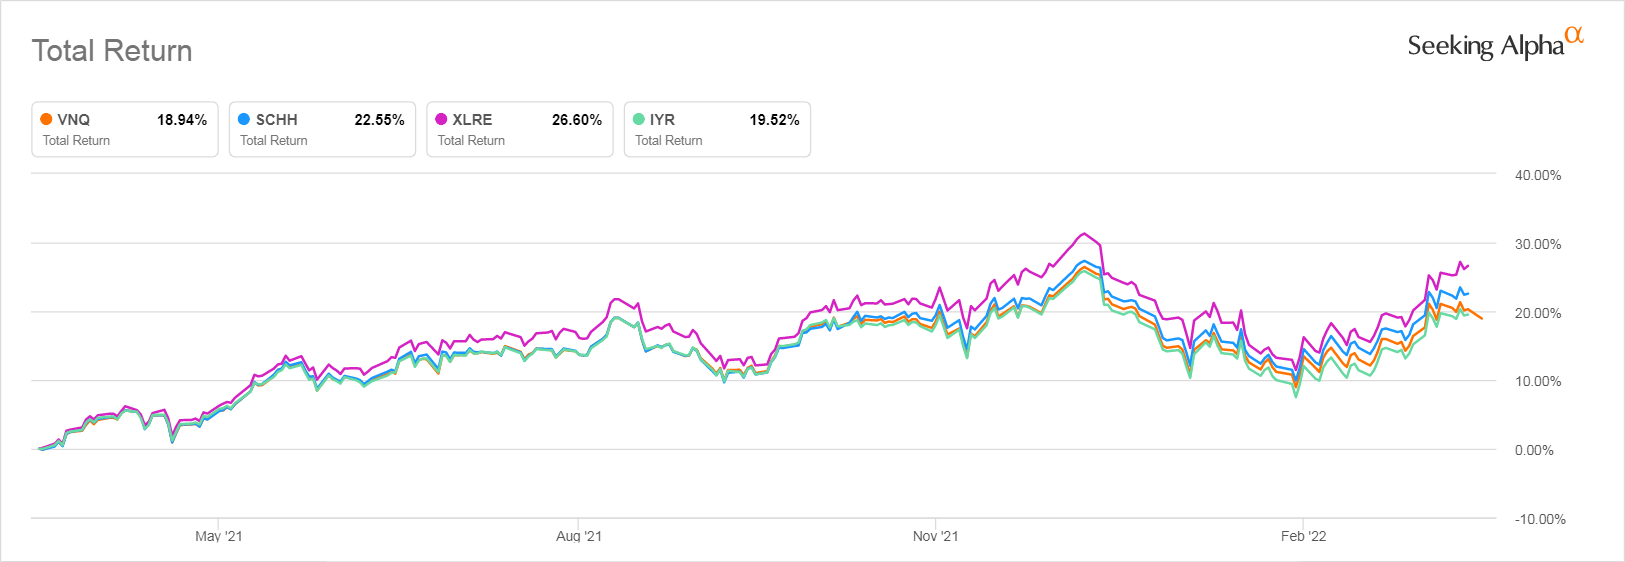
XLRE outperformed most strongly, largely because it only holds 30 cap weighted stocks while VNQ holds 166. Thus market cap weighted XLRE benefited most strongly from the upward momentum displayed by the top stocks in the Real Estate Sector before interest rates began to rise this winter, since it owned larger amounts of those top stocks. SCHH which holds 142 stocks also performed slightly better than VNQ over the year-long period.
IYR’s performance was about 1% better over the course of the whole past 12 months than VNQ’s, even though its .41% expense ratio is 3.4 times higher than Vanguard’s .12% expense ratio.
VNQ’s YTD Performance Compared to The Other Most Active REIT ETFs
The performance picture for all these REITs changed dramatically at the beginning of January after persistent inflation changed the Federal Reserves’ rate guidance.
All the most heavily traded REIT ETFs have seen their prices decline YTD as you can see from the chart below. But again, VNQ’s total return was the worst of the four. The picture is very similar when we just chart their price return.
VNQ Year-To-Date Return Compared to REIT ETF Competitors
Seeking Alpha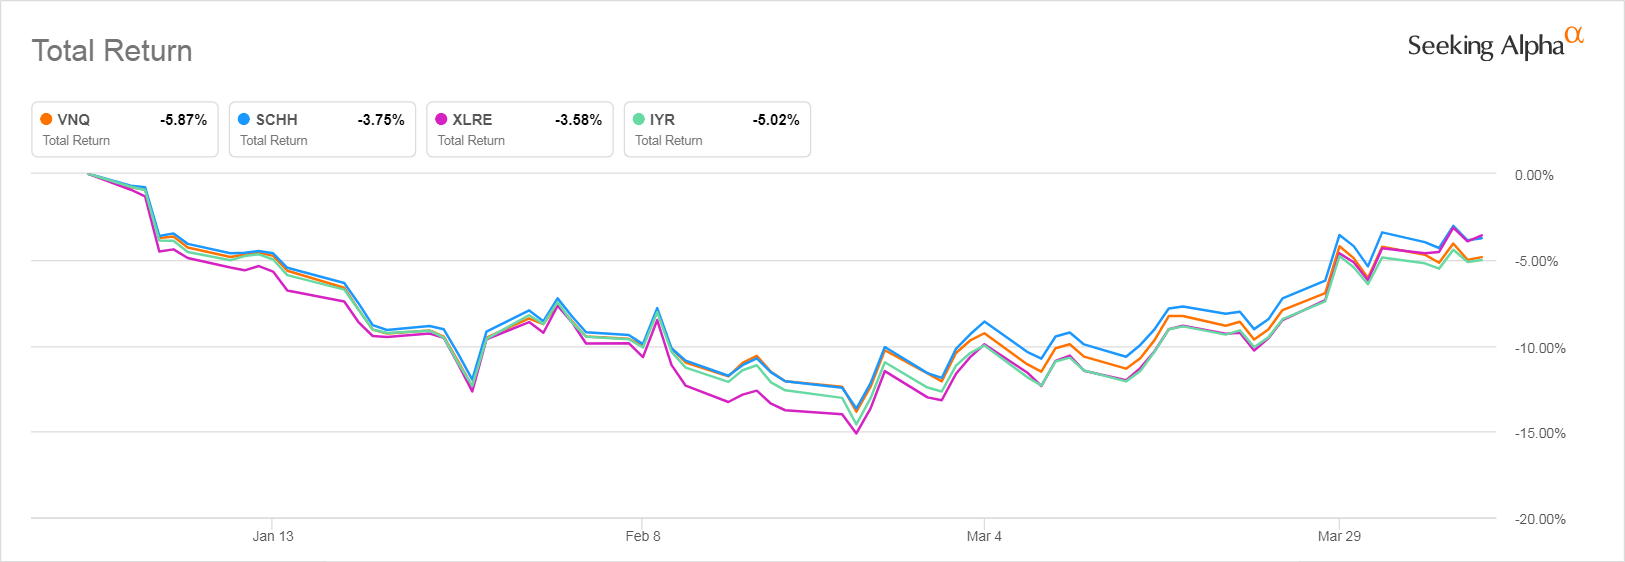
It is worth mentioning that even if we go back 5 years, VNQ still under-performs these other ETFs.
How VNQ’s Performance Compares to That of Common Stock High Dividend ETFs
Because the investment goal of most investors who buy a REIT ETF is income, I was curious to see how VNQ’s performance compared with that of two popular dividend ETFS: the Schwab U.S. Dividend Equity ETF (SCHD), The Vanguard High Dividend Yield ETF (VYM).
I also compared its performance to that of the Vanguard S&P 500 ETF (VOO) and to that of a relatively obscure equal weighted high dividend yield ETF that I have been paying attention to lately, the SPDR® Portfolio S&P 500 High Dividend ETF (SPYD). I included that ETF because of my suspicion that the REIT ETFs did as well as they did over the past year because their market cap weighting gave so much weight to the most momentum-driven stocks they owned whose prices might be the most likely to deteriorate if their upward momentum died.
Over the trailing 12-month time frame, VNQ outperformed all these other ETFS both on a price basis and a total return basis.
VNQ 1-Yr Total Return Compared to Other High Dividend ETFs and VOO
Seeking Alpha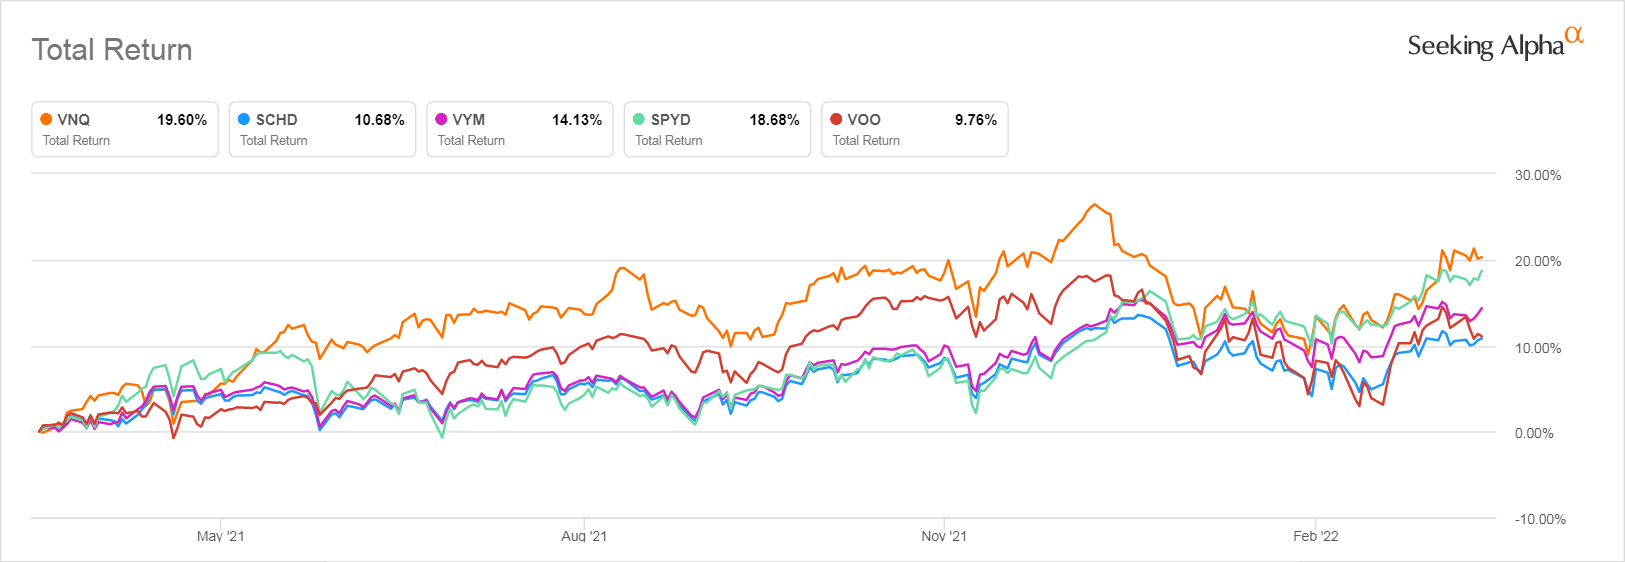
The story was very different, however, when I looked at VNQ’s performance since the beginning of January. Once the market got a hint of rising interest rates VNQ gave up more of its earlier gains than did the other dividend-focused ETFs and became the worst performing of these dividend investments, only outperforming the Vanguard S&P 500 ETF by less than 1%.
Note that the broader based dividend ETFs outperformed all of the REIT ETFs over this briefer period of rising interest rates. Note also how much better the equal weighted SPYD has done compared to all the rest of these ETFs. It is the only one that has shown a positive return since the threat of rising rates appeared.
VNQ YTD Total Return Compared to Other High Dividend ETFs and VOO
Seeking Alpha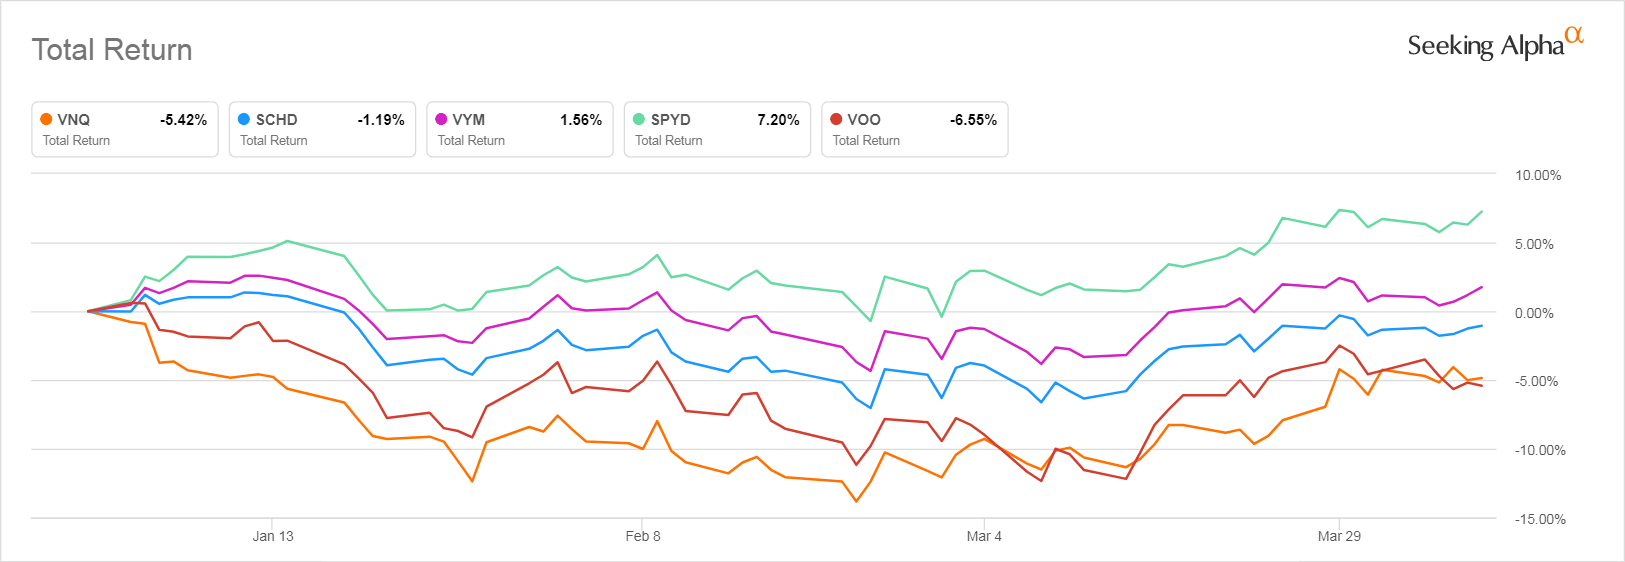
Why VNQ Is Not a Good Investment for Dividend Investors in an Inflationary Environment
Sometimes, though backward-looking metrics can be very deceiving when used to evaluate the future performance of an investment. That is particularly true now, as the economy has entered an inflationary phase that is forcing the Fed to raise rates because its dual mandate requires it to control inflation.
Investors considering VNQ or any other REIT ETF therefore have to think through, very carefully, what the impact of rising rates will be on their investment. They can’t look at past performance to get a feel for this either.
REIT Mutual Funds and ETFs Have Only Traded in a Market Where Rates Overall Were Falling
Though we are told the REIT form of corporation was invented in 1960, the first REIT mutual fund only dates back to 1985. Since then interest rates have been slowly but fairly consistently dropping from the high double digit rates of the early 1980s. Though there have been short periods where interest rates have risen, they have not been sustained during the 40 year bull market for bonds. Therefore back testing how REIT mutual funds and ETFs have performed won’t tell you how they will perform if interest rates were to rise steadily for more than a single year.
To predict how VNQ may perform going forward we have to use our brains and look carefully at what kinds of stocks are in VNQ and how both inflation and rising rates may affect them going forward.
VNQ Holds A Lot of Very Different Kinds of Stocks
There are 12 different kinds of REITs. Besides the specialty REITs we already mentioned, some own hotels, some own shopping centers, some own nursing homes, some own apartments, some own storage units, some own warehouses, some own casinos, some own a mix of all these various kinds of holdings, and some manage other company’s real estate holdings. Each one of these businesses may respond very differently to changes in the economy. This is usually the basis for the argument that an index fund’s diversification will protect you from unexpected economic blows.
This was true during the COVID-19 period. Nursing home REITs, did very poorly once COVID-19 started killing off nursing home residents and Office REITs had to contending with the move to work-from-home, but their losses were balanced by the surge in the large Tech-related holdings that dominate VNQ by weight.
But inflation and high rates challenge all REITs because of the unusual corporate structure that is the only common factor many of them share. Diversification will not help investors here.
The Nature and Quality of REIT Debt Will Make Or Break REITs
Because REITs must distribute 90% of their income to shareholders, to run their businesses to grow their businesses REITs must continually come up with new sources of capital if they seek to grow their cash flows and pay out the dividends their investors require. They are very much like the shark that can’t stop swimming.
REITs get their new capital by borrowing money and issuing new shares. They then use that money to buy more properties. Unfortunately, when we invest in REITs through an ETF we get no information about the amount of debt carried by the constituents of the ETF or about the extent of the share dilution that investors are suffering. This makes it very difficult to know how a REIT ETF will perform when rates rise.
We do know that when REITs carry a lot of debt, eventually it has to be refinanced. Given that REITs have only been around as rates dropped we have no data from which to estimate what happens with a REIT corporate structure in a world where money has suddenly become twice as expensive as it was the year before and refinancing takes up a much larger share of cash flow.
Inflation-Driven Costs and Inflexible Leases Are a Threat to REITs
Another set of issues investors in REITs must consider going into an inflationary period that isn’t disclosed anywhere in the statistics any REIT ETF gives us is this: How flexible are the leases these REITs have negotiated with the renters who are the other main source of their cash flow? Some leases have automatic rent escalations written into the contract that will raise rents based on some predefined factor like the CPI. Others do not and are tied into leases that can only be renegotiated at set periods. Some REITs own properties they must maintain while others pass on these costs to their tenants. Even the question of who pays for utilities can make a huge difference in the performance of a specific REIT in a period where energy costs may be doubling.
Diversification may or may not help you in market cap weighted REIT ETFs if the largest holdings can’t raise rents in an inflationary environment or if they are crippled by rising utility and maintenance costs.
This is one reason that all REITs have seen their prices drop as investors have become aware of the threat of continuing inflation.
REITs May Be A Type of Investment Going Forward Where Stock Picking Is Essential
The exposure of many REITs to the damage caused by rising rates may make REITs a kind of investment that can only be pursued safely by experienced investors who have the financial savvy to understand the balance sheets of individual REITs and who only buy shares in those REITs whose business model is such that it can survive in an inflationary environment.
The lack of any transparency as to the overall debt exposure of the REITs in an ETF and the nature of their leases makes it impossible to even guess at their valuation going forward.
VNQ’s Dividend Is Not Competitive
Investors might be tempted to ignore all the factors we just discussed if VNQ’s dividend was high enough to reimburse them for the risk they are taking in owning it. But it isn’t. As mentioned, VNQ’s dividend in 2021 was only 2.57%
Seeking Alpha’s dividend information page for VNQ also tells us that the amount of dividend it pays per share fluctuates unpredictably from year to year and does not trend upwards. As you can see, VNQ is not an appealing investment for dividend investors looking for dividend growth.
Vanguard Real Estate ETF Dividend Payout History
Seeking Alpha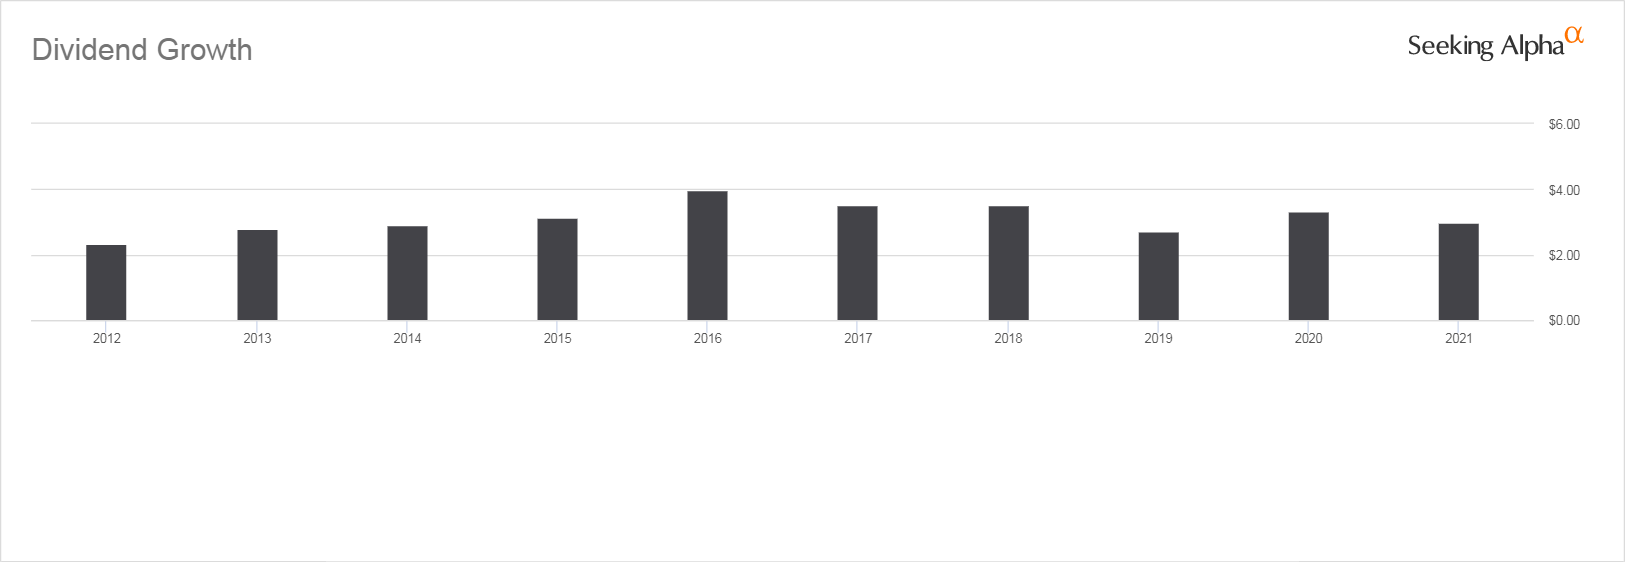
Vanguard tells us that its trailing 12 month dividend yield is 2.69%. They also tell us in the footnote that follows the term “SEC Yield” on the ETF information page that,
The current unadjusted effective yield is 2.60% as of 02/28/2022, which is based on the full amount of REIT distributions (dividend income, as well as return of capital and capital gain).
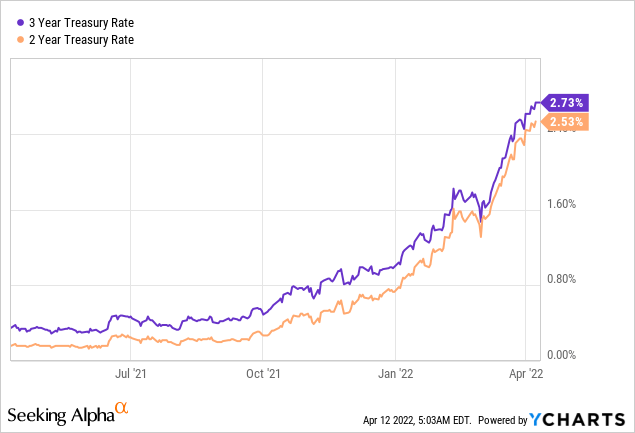
This is considerably less than the 2.738% Investors could have received from buying the 3-year Treasury Note at auction on Tuesday April 11, 2022. The escalation in the yield of the 2 and 3 year treasury notes, graphed below represents the single biggest threat to any stock that has been bought as a fixed income substitute during the past decade of rate suppression.
The Dramatic Change in Treasury Rates YTD
VNQ’s constituent stocks are already paying out 90% of their earnings. The only way that their dividend yield can rise enough from here to keep up with escalating Treasury yields is if their share prices drop.
CD rates have surged too over the past month, too. DepositAccounts now lists several nationally available CDs paying at least 2.25%. PenFed Credit Union is currently offering a 5year CD yielding 2.50% and a 7-year yielding 2.75%. These CD rates have been rising weekly, along with Treasury rates. It is quite likely we will be seeing 3% rates within another month unless something very unexpected occurs.
What has happened in the past when Treasury rates rise is that at first the Treasury rates are higher than CD rates. But within 6 months or so the CD rates exceed the Treasury rates. In 2018 when the Treasury rate reached 2.75% CD rates got as high as 4%.
Investors who fled to dividend stocks and REITs for income as the Fed destroyed all alternative sources of income over the past three years are very likely to return to safer fixed income investment vehicles as soon as their yields significantly exceed that of their stocks. This will be true even if those yields don’t beat inflation.
That’s because when you own fixed income the loss to inflation is limited to the difference between the yield and the inflation rate. Stock investors can lose both the difference between their yield and the inflation rate and the capital they invested in shares. History tells us that after a very frothy period in the stock market share prices can decline and take anywhere from a decade to almost 15 years to come back to their previous level. This could very easily happen to VNQ’s share price.
VNQ’s Dividends Are Not Qualified Dividends
VNQ is best held in an IRA because its distributions are made up of income dividends, return of capital, and capital gains. Yes, due to recent tax law changes the income portion of its dividends may be taxed at 20% rather than higher ordinary income rates due the way that the QBI deduction works. But only the income portion of VNQ’s dividend would qualify for the QBI deduction. The return of capital isn’t taxed but lowers your cost basis. Vanguard also tells us in the SEC yield footnote that,
The current adjusted effective yield [if VNQ] is 1.81% as of 02/28/2022. The adjusted yield reflects a reduction in the income included in the yield based on the average return of capital and capital gain distributions received from the fund’s REIT investments for the past 2 calendar years. (These percentages are 25.70% for 2018 and 25.16% for 2017.)
Capital gains will not qualify for the QBI deduction. Neither will the income portion if you get significant income from a small business. That’s because the QBI deduction gets phased out as income hits certain levels–at what income level the phase out occurs depends on whether you file as married or single, whether your total income comes from service business or an industrial business, and on what your total taxable income was for the year. Estimating the QBI deduction correctly while doing forward looking tax planning is impossible. At least I have found it so when doing the accounting for our family businesses.
Even if you can claim the QBI deduction, there is no guarantee that it will remain in the tax code in years to come. It is a fairly obscure provision of the tax code that is mostly of use to small businesses earning little, and was introduced mainly to make it sound like Congress was giving the little guy a tax break similar to the enormous tax cuts given huge corporations. It could easily be sacrificed to restore other, more popular tax breaks that were taken away from a lot more little guys, like an uncapped state and local income tax deduction.
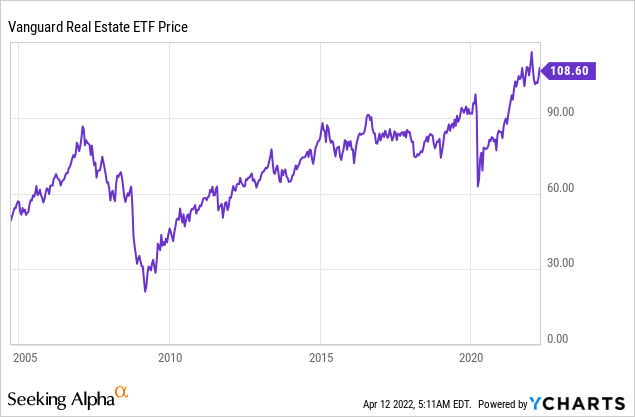
VNQ Is a Hold Only If You Bought at A Much Lower Price
Take a look at VNQ’s price history. As you can see, if you bought VNQ several years ago, when its price was more than 20% less than it is now, you can probably continue to hold this investment without suffering too much damage to your portfolio. But if you are one of the many investors who bought in at a price over $90/share over the past few years when bond and CD rates dropped to near zero, this would be a very good time to sell your shares.
Vanguard Real Estate ETF Price History Since ETF Inception
Bottom Line: VNQ Is A Poor Choice for Dividend Investors
All dividend-focused investments have become risky in an environment where their prices have been pushed up to unjustifiable levels by investors desperate for yield. But REITs have the added burden that they must distribute 90% of their income. This limits their access to the cash stores that will help other kinds of companies survive inflationary times. Many REITs also don’t have the kind of pricing power that traditional consumer staples dividend stocks have, as they are tied into long-term leases that didn’t foresee rampant inflation.
Some individual REITs are likely to continue being good investments: ones that can raise rents to keep up with inflation and costs without driving tenants into bankruptcy and ones that have excellent top management that have done a good job managing their debt loads. But when you buy a REIT ETF like VNQ you aren’t getting just those. You are getting all kinds of REITs owning all kinds of properties, with all kinds of leases, all kinds of debt, and all kinds of management. All of which have to keep coming up with money since they distribute 90% or more of their income each year.
As much safer fixed income is now providing equal returns for income-seeking investors and is likely to provide even higher returns as the Fed pursues its announced strategy of raising rates for the next year and possibly two, REITs look likely to join the long list of once popular and profitable investments that end up taking back all their investors’ gains and more.
Be the first to comment