

juliannafunk/iStock via Getty Images
We are only 6 months into the year, and it seems like the inflation boom is quickly going bust.
The last few months have been very interesting as we see traders (rotating) moving out of one investment or market and into another. But as losses mount and capital diminishes, traders are eventually forced to liquidate even their favorite holdings to meet margin calls and raise needed cash.
As followers of pricing, our opinions or forecasts are not of much value. What is important is price, as price directly determines our trading profits or losses.
When market conditions change or at times when our trading begins to rack up losses, the best thing we can do as a professional is to go to cash. Going to cash allows us to get our perspective back. It allows us the possibility to enter the markets once more and provides the potential to make a lot of money.
Markets go up, and markets go down. What makes the big difference is how we manage risk and how well we do in following the direction of price. Knowing and controlling one’s emotions dictates how long we can play the game or how successful we will be at it.
As we review a few interesting and relevant long-term weekly charts, we realize that for many of us, the best option is simply to go to cash, watch, and wait.
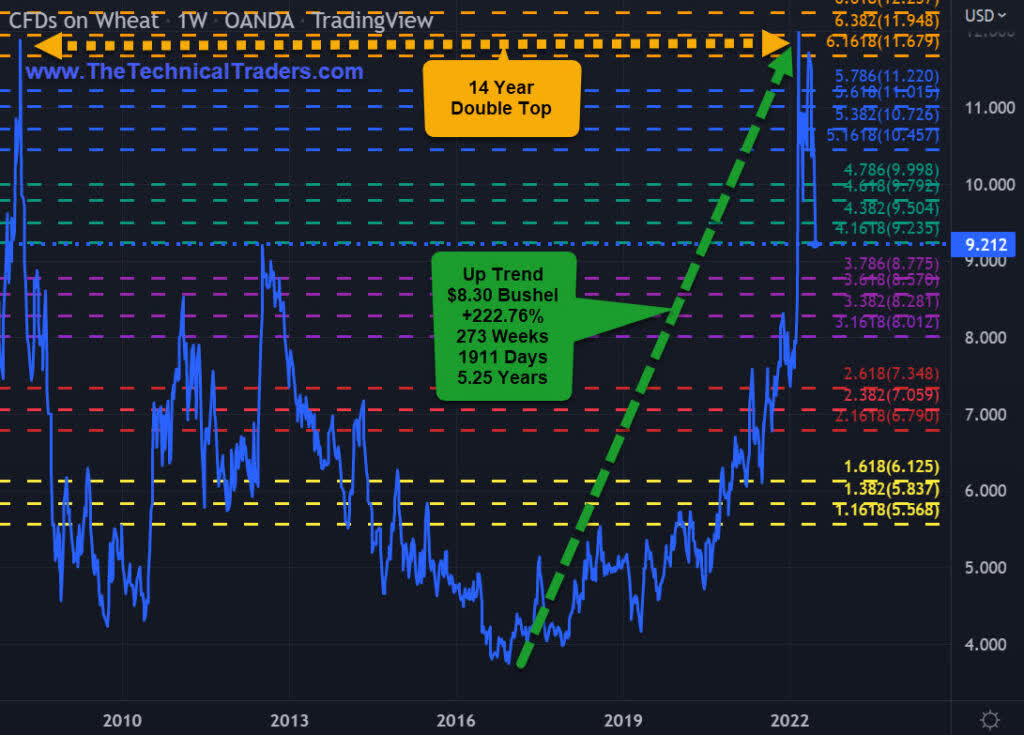
Food: Wheat -23.74%
- Wheat had a 5-year run gaining more than $8 a bushel.
- From December 2021 to March 2022, it gained more than $4 a bushel.
- In March 2022, it made a 14-year double top at $12.
- From its peak, it has now been trending lower for 31 weeks.
- Wheat is a good indicator of the level of consumer food inflation.
Wheat CFD • WHEATUSD • OANDA • Weekly
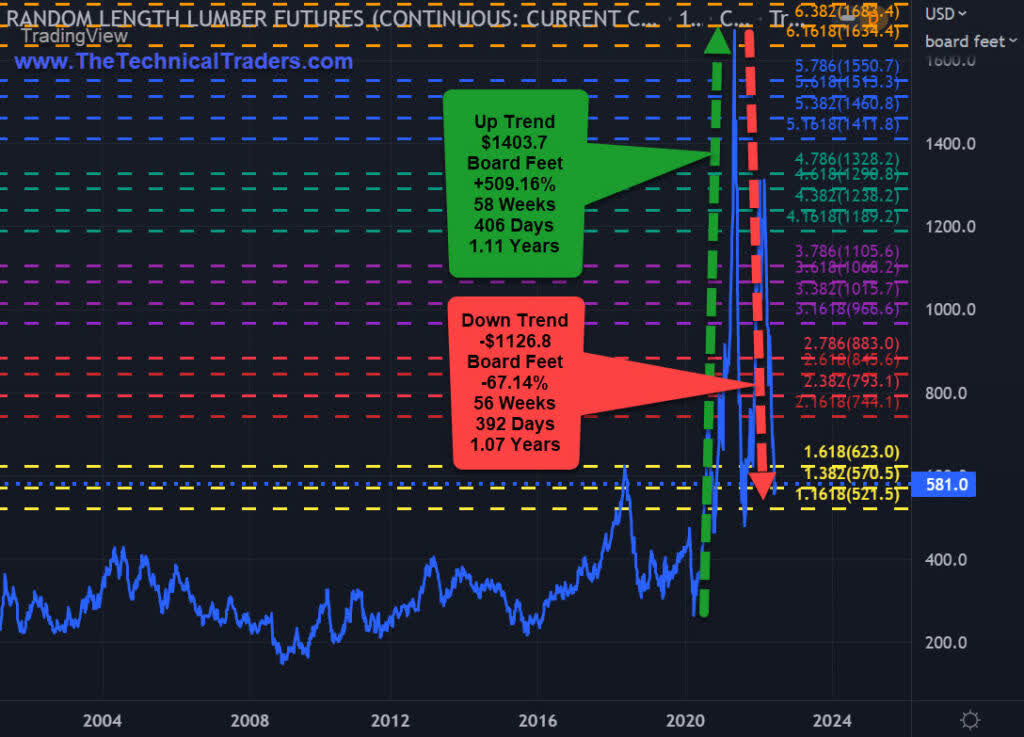
Housing: Lumber -67.14%
- Random length lumber futures experienced a 14-month exponential rally.
- From its March 2020 Covid low, it has rallied $1403 for a 500%+ gain.
- It is now down $1125 or -67.14% from its May 2022 peak.
- Lumber is a good indicator of the health of the new housing construction market.
Random Length Lumber Futures • Continuous • LBS1! • Weekly
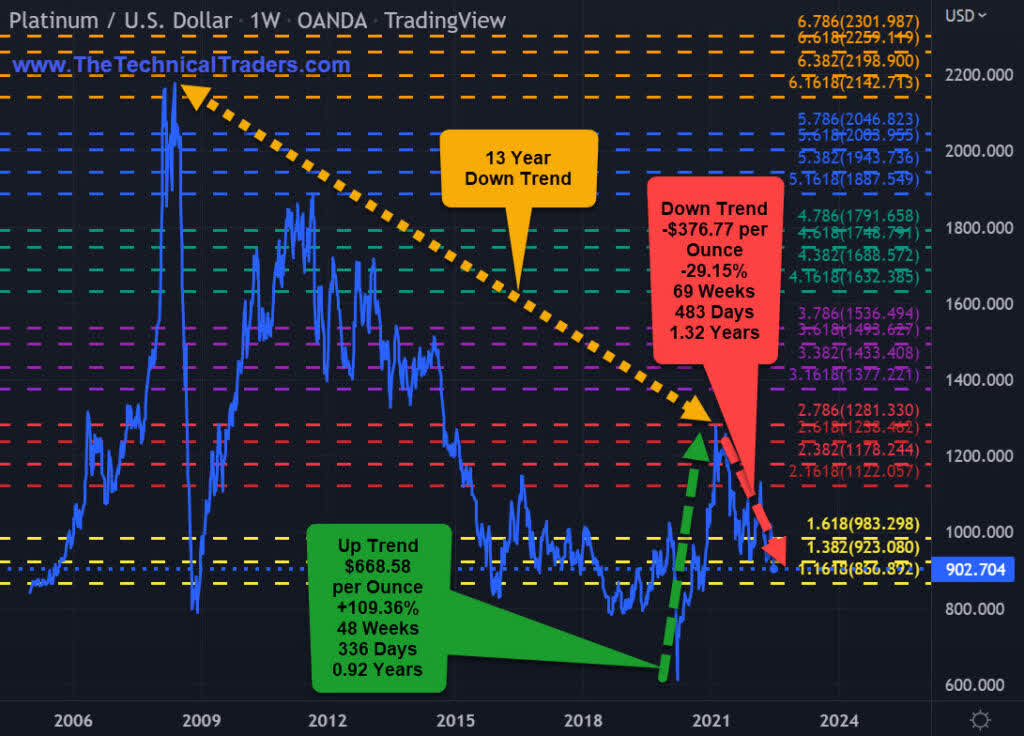
Autos: Platinum -29.15%
- Platinum experienced an 11-month rally that now has fizzled rather quickly.
- From its Covid 2020 low, its price had more than doubled.
- It is now down -$376 per ounce or -29.15% from its February 2021 peak.
- Platinum is a good indicator of the health of the new automotive sales market, where most auto manufacturer stocks have also lost more than -30% from their price peaks.
Platinum USD • XPTUSD • OANDA • Weekly
Over the next 12 to 24+ months, we expect very large price swings in the US stock market. The markets have begun to transition away from the continued central bank support rally phase and have started a revaluation phase as global traders attempt to identify the next big trends. Precious Metals will likely start to act as a proper hedge as caution and concern begin to drive traders/investors into Metals and other safe-havens.
Historically, bonds have served as one of these safe-havens. This is not proving to be the case this time around. So if bonds are off the table, what bond alternatives are there? How can they be deployed in a bond replacement strategy?
Editor’s Note: The summary bullets for this article were chosen by Seeking Alpha editors.
Be the first to comment