

PM Images
Company Snapshot
Qualcomm Incorporated (NASDAQ:QCOM) is a semiconductor-based stock that enjoys strong expertise in the wireless field. QCOM generates the bulk of its revenue from the sale of integrated circuit products and the licensing of its IP (Intellectual Property).
The company currently reports under three segments –
a) QCT (Qualcomm CDMA Technologies) which primarily provides 3G/4G and 5G based system software and integrated circuits
b) QTL (Qualcomm Technology Licensing) which is responsible for licensing or providing rights of their IP portfolio
c) QSI (Qualcomm Strategic Initiatives) which focuses on initiatives related to the strategic initiatives of the Qualcomm
What Should Investors Know About Qualcomm’s Dividend Profile?
To measure Qualcomm’s overall dividend quotient, I’ve benchmarked it against the top 10 US-listed semiconductor stocks that pay dividends. These stocks are measured on the basis of nine key metrics that can be bracketed under four broad headings, namely –
1) Consistency (Stocks that have been paying and growing their dividends over a longer period, receive higher scores)
2) Payout/Coverage (Stocks with larger covers and payouts receive higher scores)
3) Growth over time (Stocks that have grown their dividends by larger percentages over a 3,5, and 10-year basis receive higher scores)
4) Absolute and relative yield (Stocks with high absolute forward yields and superior differentials vs their historical averages receive higher scores)
Under each metric, these stocks are assigned scores of 1 to 10 and an aggregate dividend score is arrived at after totaling up the scores under all the nine metrics. What does this study tell us about Qualcomm’s dividends?
Qualcomm has been paying quarterly dividends for over 18 years now, and whilst that is a long enough tenure by semiconductor standards (most other major peers have been paying dividends for only nine years on average), it doesn’t match up to the longevity of Texas Instruments (TXN) who has been doing so for 32 years!
Where QCOM comes out on top (alongside Analog Devices) is the longevity with which it has been growing its dividends; in fact, it has been growing its dividends for all the years in which it has been paying dividends; conversely, something like a TXN has been doing this for only half the number of years it has been paying its dividends.
When it comes to the coverage and payout aspect of the dividends, there are a couple of nuances to highlight. On a trailing dividend cover basis. Qualcomm’s cover of a little over 4x is slightly below the peer set average of 5.6x, but dividend covers can often be skewed by one-off items or non-cash related adjustments. The more pertinent metric would be the cash dividend payout ratio, which tells you how much of free cash flow has been paid out as dividends. Qualcomm certainly scores very highly here, relative to its peers, with a “trailing twelve-month” payout ratio of 47% (only TXN and TSM have higher cash payouts).
2021 Investor Day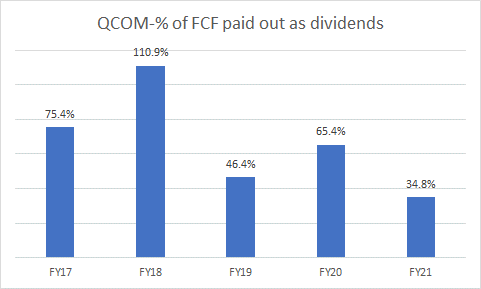
Having said that, it’s also worth noting that last year, on an “annual basis” QCOM’s FCF distributions via dividends were the lowest in five years. Considering that the balance sheet looks a little stretched (more on this in the concluding section of the article), could we see a declining trajectory of payouts?
When it comes to Qualcomm’s dividend growth history, I’m afraid the picture isn’t too impressive; whether it be over 3 years, 5 years, or 10 years, its dividend growth rates have all been below average, particularly in the more recent years where it has been quite parsimonious in growing its dividends.
Finally, we come to the yield aspect; even here, Qualcomm is not too well-placed. Its absolute yield of a little over 2% puts it in the middle of the pack but crucially do consider that amongst all the stocks, it offers the weakest differential vs its historical yield average (over 90bps poorer).
Seeking Alpha, YCharts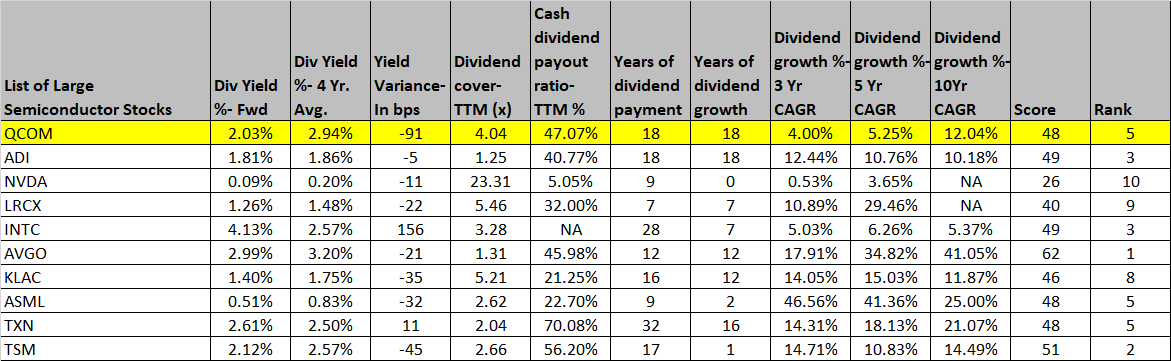
To conclude this section, whilst QCOM’s longevity and consistency as a dividend-payer is appreciated, it’s fair to say that the overall dividend package comes across as average.
Closing Thoughts – Is QCOM Stock A Buy, Sell, Or Hold?
With regards to some of the other factors, I’d like to believe that we’re staring at a rather mixed outlook for the stock.
QCOM’s intention to diversify away from the handset space to avenues including automotive, IoT, servers, etc., should add a degree of resilience to the operating model over time, but let’s be honest, for now, this is still very much a handset-driven story. Unfortunately, things aren’t looking overly rosy at the moment, with much of the strength so far coming from the premium and upper-tier space. Volumes in the mid and lower-tier space remain sub-par, and overall handset volume guidance for the year has been scaled down; previously the company was expecting flat volumes, but last month it had to scale this down to a mid-single-digit decline. The recent Arriver acquisition also means that operating expenses will likely spike up by 6-8% over the coming quarters.
It could also be argued that QCOM’s balance sheet isn’t as resilient as it once was, and this is not ideal when the business cycle appears to have turned for the worse. As of 9M-22M, their cash position has come down markedly as they’ve spent quite a bit on inorganic developments ($4.7bn), and a lot of cash has also been sucked out on account of strong inventory builds ahead of the seasonally strong period ($2.2bn) and an easing of the supply situation.
Nonetheless, when the industry appears to be on a downcycle, I’m not sure it makes a great deal of sense to boost inventories the way Qualcomm has; just for some perspective, the days in inventory are currently over 94 days, well above the 5-year average of 72 days. What’s particularly striking is that the level of inventory days is at its highest point since the first quarter of 1996!
YCharts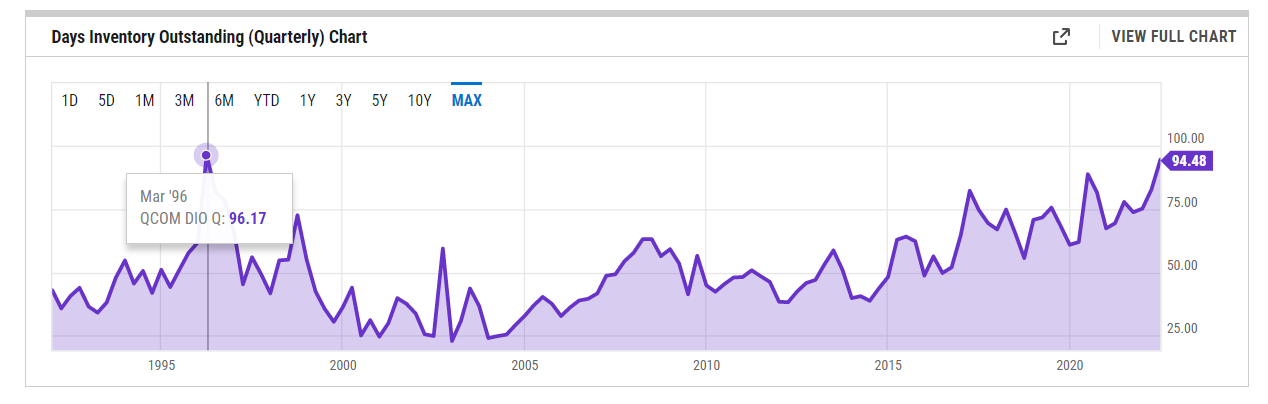
In effect, Qualcomm’s cash and marketable securities which accounted for over a third of total assets a year ago (almost $13bn), currently only account for 14% of assets (less than $7bn). Besides that, this is a company that has prided itself on a strong net cash position across most of its life; that has changed with the net debt position (debt over cash) at lifetime highs of $8.7bn.
YCharts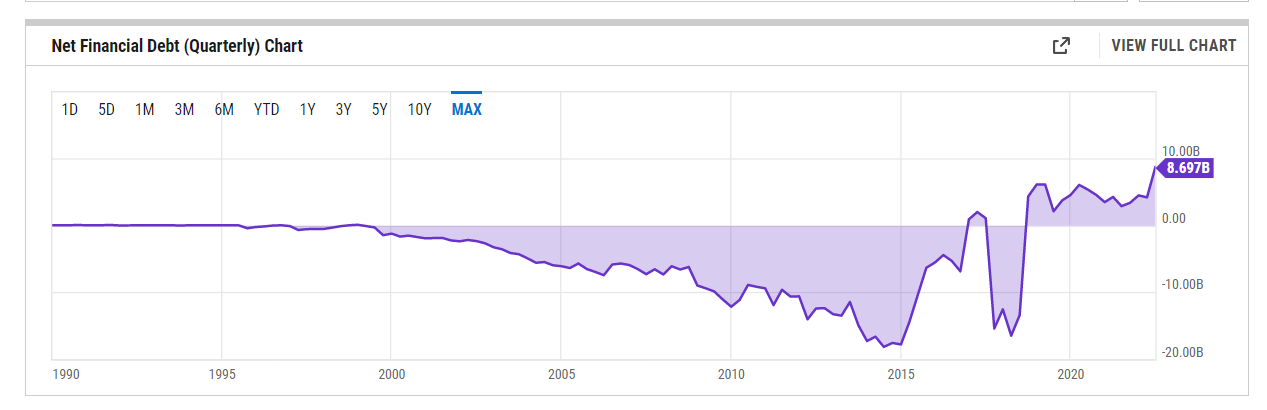
I would also urge investors to consider the changing texture of the consensus analyst estimates over a longer time frame. For the current year (Qualcomm follows a September year ending calendar), consensus expects EPS of $13.04 (implying annual growth of 47%) on revenue of over $44bn (implying 32% annual growth). QCOM’s ability to generate such strong earnings growth over solid revenue growth should be commended, but this is expected to fade away quite quickly over the next two years, with EPS growth lagging revenue growth and both metrics only coming within the single-digit threshold.
YCharts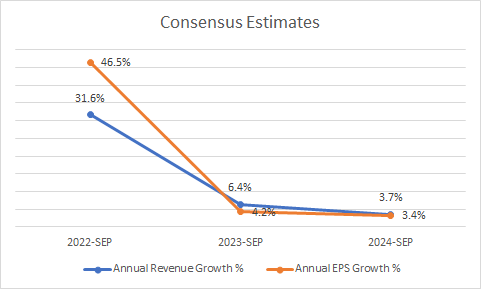
This means that even though QCOM’s stock can be availed at a slight 5% discount (based on the Sep 2023 EPS, the stock trades at 10.86x forward P/E) to its long-term forward P/E average of 11.43x, on a forward “Price/Earnings to Growth” ratio (PEG ratio), it comes across as quite pricey; with only 4.2% earnings growth next year, and a forward P/E of 10.86, you’re looking at an elevated PEG ratio of 2.6x. Just for some context, historically, this is a stock that has traded at a PEG ratio range of 0.5–1.1x. We should also consider that the average PEG ratio of other semi-peers currently works out to a lower figure of 1.93x.
Whilst the valuation picture is not ideal, what’s heartening to note is the company’s foray back into the ARM-oriented server market, something it had stepped away from in 2018. The future of ARM server chips looks rather resplendent, given the growing demand for superior energy efficiency from cloud enterprises and hyperscalers. QCOM has been leveraging the tech of Nuvia- a startup it acquired in March 2021, to deepen its expertise in this space, and recent reports suggest that Amazon Web Services has shown an interest in QCOM’s fledgling portfolio.
What also looks promising for QCOM is the favorable risk-reward on offer versus other peers from the semi space. As you can see from the image below the relative strength (RS) ratio measuring the performance of QCOM and the 25 largest peers in the semiconductor space looks fairly attractive; the current reading on the RS ratio is a good 50% away from the mid-point of the range, offering an enticing play for those looking for rotational opportunities within the semiconductor space.
StockCharts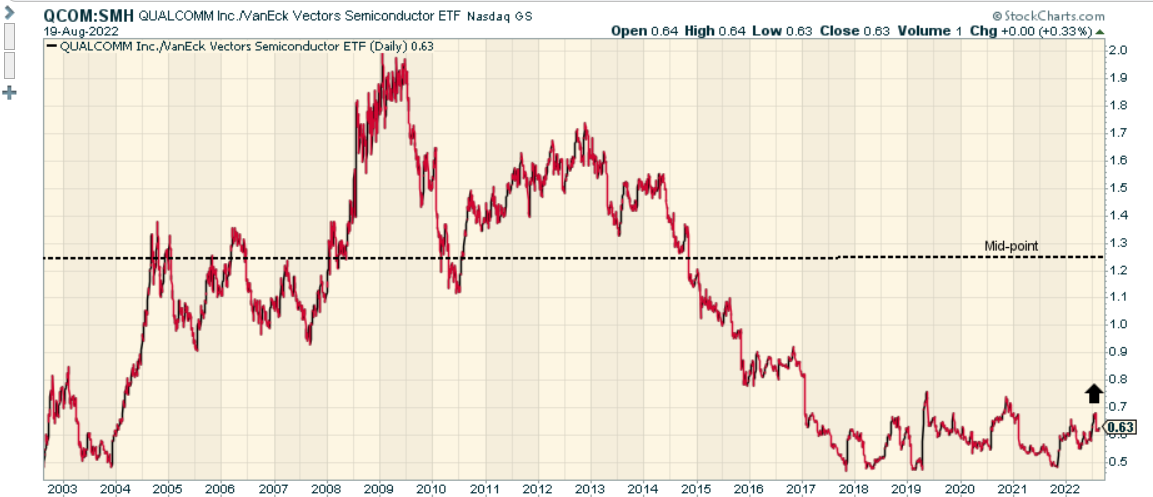
To conclude, given a broadly mixed picture, I rate QCOM’s stock as a HOLD.
Be the first to comment