

Scott Olson
Did JPMorgan Beat Earnings in Q2?
JPMorgan Chase & Co. (NYSE:JPM) reported their Q2 2022 results on Thursday (July 14). Shares fell 3.5% during the day, but have so far rebounded 3.6% on Friday (as of 12:15 EST).
JPMorgan did not beat earnings in Q2. In fact, compared to analyst estimates, JPM had misses on both revenues (by $1.10bn) and EPS (by $0.15):
|
JPM Q2 2022 Earning Misses 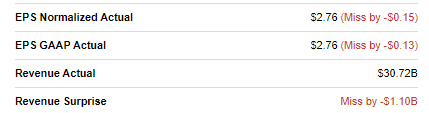 Source: Seeking Alpha |
However, Q2 2022 had a lot of moving parts including prior-year strong wholesale banking activity levels, post-COVID loan demand recovery and recent interest rate hikes and regulatory capital requirement changes, so we do not believe the miss against analyst estimates represented a real negative.
In fact, compared to our investment case, Q2 results were in line. Higher regulatory requirements have led management to suspend buybacks, but long-term return targets remain unchanged. JPM’s Return on Tangible Common Equity (“ROTCE”) for the quarter was 17%, in line with its average across-the-cycle target. Loan growth was strong, Net Interest Yield benefited from higher rates, and Investment Banking revenues normalized downwards as expected. JPM continued to benefit from a strong macroeconomic backdrop but is also well-prepared for any downturn.
Our forecasts indicate a 2025 year-end price of $191 (compared to the peak of $183 last October). With shares at $111.89, we expect a total return of 87% (20.9% annualized) by 2025 year-end. The Dividend Yield is 3.6%. Buy.
JPMorgan Buy Case Recap
We upgraded our rating on JPM from to Buy in April, having covered the stock on Seeking Alpha since 2019. JPM shares are currently down 10.5% (after dividends) since our upgrade, about 2% ahead of the S&P 500, and have fallen 35% since their peak last October:
|
Librarian Capital JPM Rating History vs. Share Price (Last 1 Year) 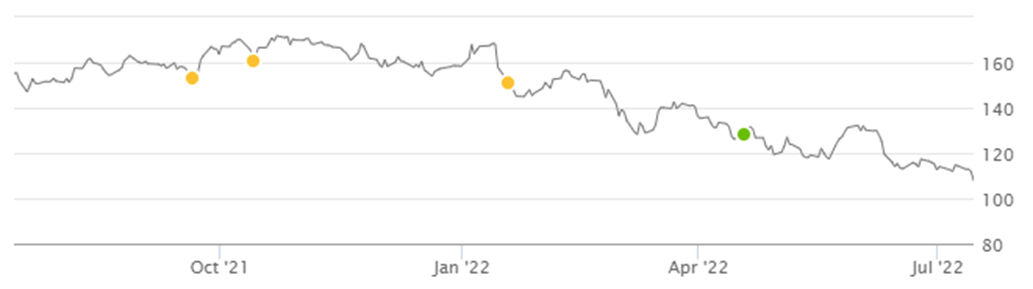 Source: Seeking Alpha (14-Jul-22). |
We believe large U.S. banks can grow their earnings at “GDP +”, thanks to their scale, diversified franchise and leading market positions:
- Large banks achieve Net Interest Income (“NII”) on favorable Net Yields, thanks to their cheap deposit funding; Net Yields had shrunk in recent years due to Quantitative Easing (“QE”), but this is now reversing
- They have large Non-Interest Revenues such as investment banking fees, which tend to become elevated during periods of QE as cheap money stimulates corporate and market activity, offsetting NII weakness
- Their cost ratios tend to be stable or improving, as economies of scale and use of technology help them become more efficient
- They are now far less impacted by economic downturns than in the past, thanks to QE policies and much larger capital buffers after the 2008 crisis
We believe JPM has the best franchise among large U.S. banks, though Bank of America (BAC) has similar advantages and is also Buy-rated.
With JPM, we had assumed a long-term, across-the-cycle average Return on Tangible Common Equity (“ROTCE”) of 16%, supported by JPM’s track record (adjusted for differences in capital ratios before 2008 and the tax rate before 2018), though 1% lower than management’s own average across-the-cycle target:
|
JPM ROTCE vs. Medium-Term Outlook (Since 2004) 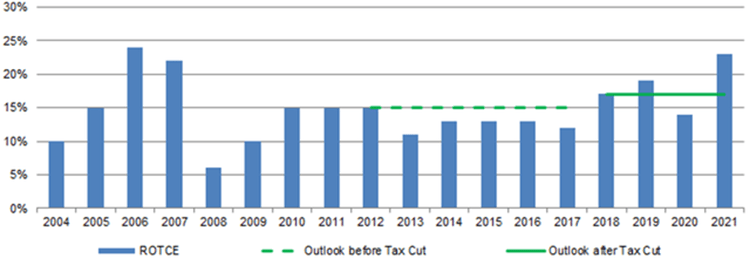 Source: JPM results supplements. |
We had believed JPM shares should trade at a 15x P/E, which on a 40% Payout Ratio would mean a Dividend Yield of 2.7%. With a ROTCE of 16%, this implies JPM shares should trade at a P/TBV of 2.4x (compared to 1.6x at present).
Q2 2022 results support our investment case, though we have cut our forecasts slightly, as we will explain below.
CET1 Ratio, Buybacks And Long-Term Targets
One key negative headline from Q2 results is the suspension of buybacks.
This was a voluntary decision taken by management after regulatory capital requirements rose more than expected, and should be temporary in nature. JPM had already planned an increase in its Common Equity Tier-1 (“CET1”) ratio target to 12.5-13.0% by Q1 2024 (compared to 11-12% previously), but the Federal Reserve ordered an increase of JPM’s Stress Capital Buffer (“SCB”) from 3.2% to 4.0% as part of its annual stress tests in June (to be implemented by October 2022). This meant JPM’s minimum CET1 ratio rose correspondingly from 11.2% to 12.0% (though JPM’s CET1 ratio already exceeds this, standing at 12.2% at the end of Q2 2022). The suspension of buybacks is to enable a faster organic capital build towards existing targets.
Management talked of pausing buybacks “for the near term” and showed an “illustrative” chart showing CET1 entering the 12.5-13.0% target range by the end of Q4 2022 and exceeding it the following quarter:
|
JPM Illustrative CET1 Ratio Trajectory 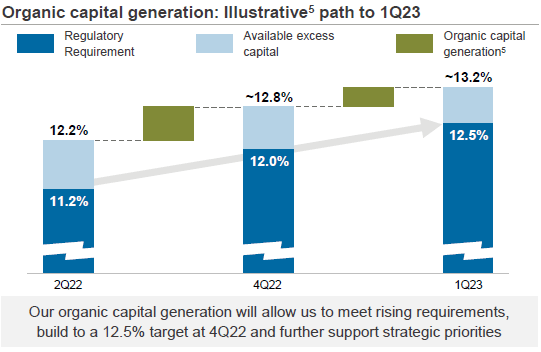 Source: JPM results presentation (Q2 2022). |
We expect buybacks to resume by June 2023 at the latest.
Importantly, management expects to be able to reduce the SCB by optimizing its asset base, and does not expect to change its targets for CET1 ratio and ROTCE:
We intend to drive that SCB down by reducing the things that created it … We are earning 17% of Tangible Equity. We can continue doing that … We have a tremendous ability to manage it (Risk Weighted Assets output). I can think we do without affecting our ROTCE targets.”
Jamie Dimon, JPM CEO (Q2 2022 earnings call)
Except the suspension of buybacks, Q2 headlines were mostly positive.
Is JPM Stock A Good Long-Term Pick?
Q2 2022 results pointed to several key positive trends that show how JPMorgan & Chase stock is a good long-term pick:
JPM ROTCE at 17% for Q2 2022
ROTCE for the quarter was 17%, in line with its average across-the-cycle target:
|
JPM Results Headlines (Managed Basis) (Q2 2022 vs. Prior Periods) 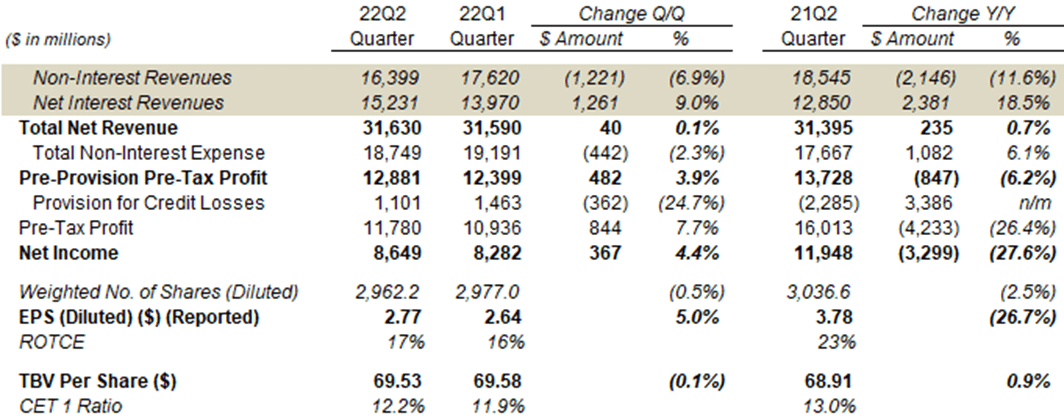 Source: JPM results supplement (Q2 2022). |
Underlying trends were positive in line with our expectations.
Overall revenues grew 0.7% year-on-year, with NII growing 18.5% year-on-year thanks to loan growth and higher yields, and Non-Interest Revenues declining 11.6% due to wholesale banking activity levels normalizing from record levels in 2021. Expenses grew 6.1% year-on-year, slightly less than the 8.5% implied by existing guidance. Pre-Provision Pre-Tax Profit (“PPPTP”) fell 6.2% year-on-year as expenses grew faster revenues, but were 3.9% higher than in Q1.
PPPTP excludes volatile one-off credit reserves and builds, so represents a good measure of underlying profitability. PPPTP has been trending down since peaking in Q1 2021, as the boost to wholesale activity from COVID and low rates fades, but may have stabilized this quarter at a level comparable to that in pre-COVID Q2 2019:
|
JPM Earnings, Provisions & Pre-Tax Profit by Quarter (Since Q2 2019) 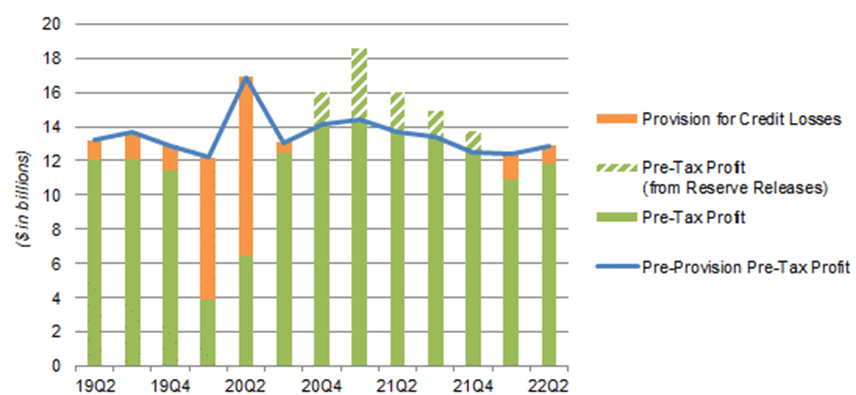 Source: JPM results supplements. NB. Figures on managed basis. |
Provision for Credit Losses was a positive $1.10bn (i.e. an expense) in Q2 2022, compared to a negative $4.23bn (i.e. a benefit) in the prior-year quarter, and was the main reason that Net Income was 27.6% lower year-on-year. Compared to Q1 2022, Provision for Credit Losses was 24.7% ($362m) lower, and Net Income was 4.4% higher.
Buybacks have reduced the share count by 2.5% over the past year, mitigating the drop in Net Income on EPS.
We will review the positive trends in NII, Non-Interest Revenues and credit losses in more detail below.
Net Interest Income Accelerated (Again)
JPM’s NII grew 9.0% (on managed basis) sequentially in Q2 2022, accelerating from the 7.5% growth in Q1:
|
JPM Interest Revenue, Loans & Rates (Q2 2022 vs. Prior Periods) 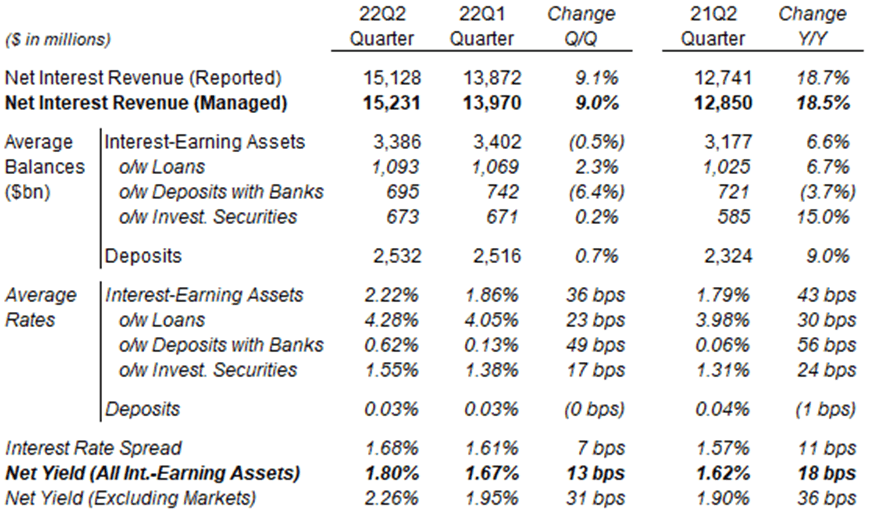 Source: JPM results supplement (Q2 2022). |
NII growth benefited from both loan growth and higher rates. Total Interest-Earning Assets grew 6.6% sequentially, including Loans growing 6.7% sequentially. The average rate on Interesting-Earning Assets grew 43 bps, including that on Loans growing 30 bps sequentially, while the average rate on deposits was basically flat, widening JPM’s Net Yields.
Loans have been growing consistently since troughing in Q3 2020, as the economy continues to reopen and loan demand continues to recover:
|
JPM Total Loans Balance (Since Q12020)  Source: JPM results supplements. |
The Net Yield on JPM’s interest-earning assets has similarly been expanding since hitting a floor in 2021:
|
JPM Rates & Yields By Quarter (Since Q12020) 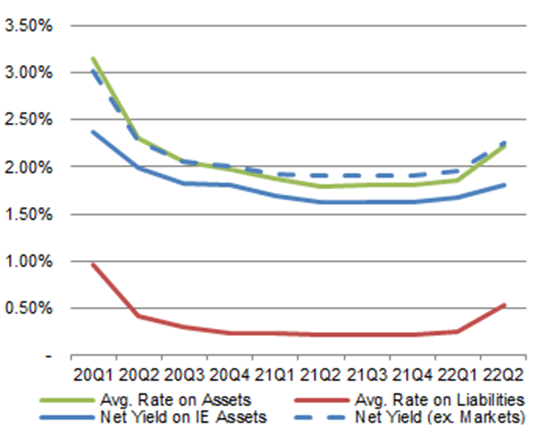 Source: JPM results supplements. |
Management has raised their outlook for 2022 full-year NII again, to $58bn+, from $56bn+ at the investor day in May and $53bn+ at Q1 2022 results in April. We expect both positive trends to continue, driving strong NII growth for JPM.
JPM Non-Interest Revenues Normalizing
The year-on-year decline in JPM’s Non-Interest Revenues was mostly driven by a 54% decline in Investment Banking Fees, the result of wholesale banking activity levels normalizing after the boost from COVID and low rates in 2021:
|
JPM Non-Interest Revenues By Type (Last 5 Quarters) 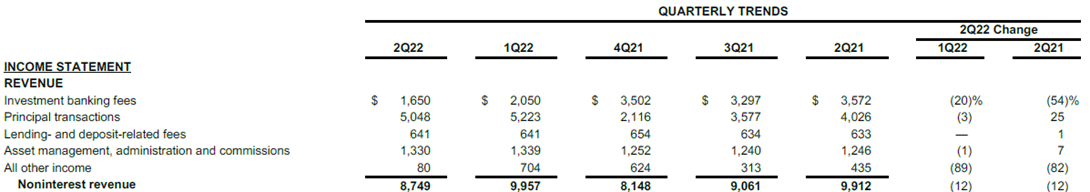 Source: JPM results supplement (Q2 2022). |
Principal Transactions revenues actually rose 25% year-on-year in Q2 2022, helped by strong trading results in Markets, which benefited from market volatility during the quarter. Asset Management, Administration & Commissions rose 7%, with investment valuation losses more than offset by inflows and higher fee margins, including the removal of most fee waivers on money market funds.
Year-to-date, total Non-Interest Revenues were 5% higher than in 2019.
The chart below focuses on JPM’s Corporate & Investment Banking (“CIB”). CIB revenues have fallen substantially from the Q2 2021, driven by declines in Non-Interest Revenues, but remained much higher than in Q2 2019:
|
JPM CIB Revenues by Type (Q2 2022 vs. Prior Periods) 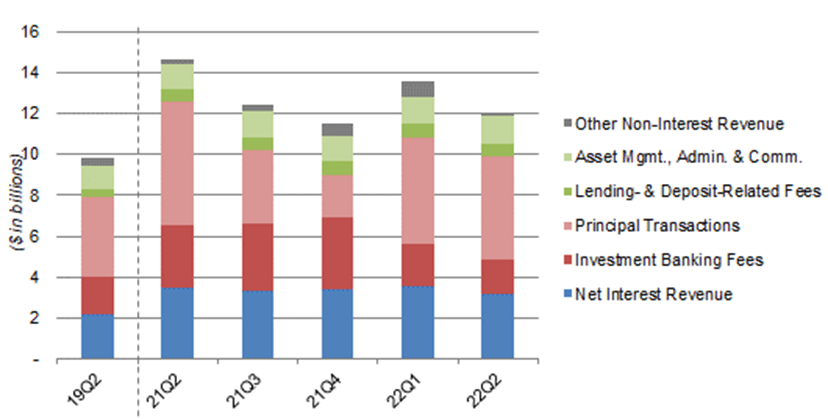 Source: JPM results supplements. |
Management stated that JPM has retained its #1 rank in global Investment Banking fees year-to-date, with a wallet share of 8.1% (slightly lower than its wallet share of 9% for full-year 2019).
We remain hopeful that Non-Interest Revenues will stabilize at a level significantly higher than in pre-COVID 2019.
JPM Credit Losses Remained Limited
Credit losses remained limited at JPM in Q2 2022. Net Charge-Off was slightly lower year-on-year ($657m vs. $734m), and remained near historic lows (having averaged $1.4bn per quarter in 2019). Reserve build of $0.4bn was smaller than Q1, and was “reflecting loan growth as well as a modest deterioration in the economic outlook”:
|
JPM Provision for Credit Losses (Q2 2022 vs. Prior Periods) 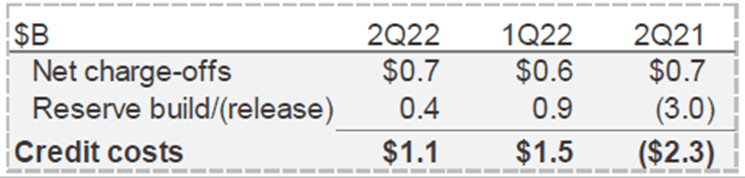 Source: JPM results presentation (Q2 2022). |
Customer balance sheets and their appetite to spend remain healthy, as JPM CEO Jamie Dimon observed on the call:
“There are very good current numbers taking place. Consumers are in good shape. They’re spending money. They have more income. Jobs are plentiful. They’re spending 10% more than last year, almost 30% plus more than pre-COVID. Businesses, you talk to them, they’re in good shape. They’re doing fine. We’ve never seen business credit be better ever like in our lifetimes. And that’s the current environment.”
The future environment is more uncertain, because of macro factors like inflation and rate hikes. Here Dimon predicted “a range of potential outcomes from a soft landing to a hard landing”.
JPM Well-Prepared For Any Downturn
JPM is well-prepared for any downturn, as demonstrated by the experience during COVID-19.
CECL (Current Estimated Credit Losses) accounting standards mean banks reserve for expected credit losses in full upfront as soon as they expect them, but not before. This means there would still be further credit reserve builds if the macroeconomic environment were to deteriorate.
However, as Dimon pointed out on the call, JPM stayed profitable every quarter through COVID-19, when U.S. unemployment went to 15% in 3 months, and consumer balance sheets are now in a much better shape than before the pandemic. Therefore, should a downturn materialize, it would likely involve slower and smaller credit reserve builds than for COVID-19, and JPM would likely stay profitable as well. (JPM generated a ROTCE of 14% in 2020.)
JPM 2022 Outlook
Management increased JPM’s 2022 outlook for NII from $56bn+ to $58bn+, but maintained its outlook for expenses:
|
JPM 2022 Outlook 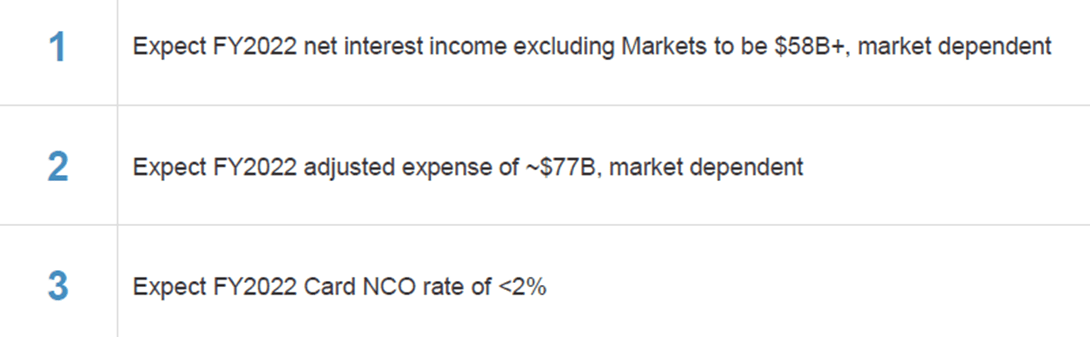 Source: JPM results presentation (Q2 2022). |
We make the following additional assumptions for the full year:
- NII and expenses to be in line with guidance
- Non-interest revenues to be 5% above 2019 levels
- Provision of Credit Losses to at 2019 level, so 18% higher in H2 than in H1
- Average CET1 capital to be 5% higher year-on-year
These imply a 14% ROTCE for 2022:
|
Illustrative JPM 2022 Forecasts 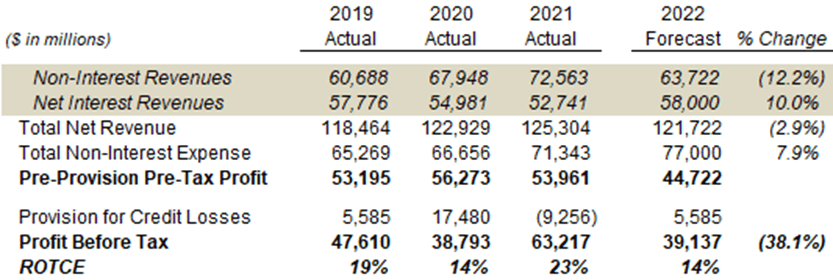 Source: Librarian Capital estimates. |
We believe this represents a temporarily gap from our long-term ROTCE assumption of approximately 16% because investments in expenses take time to generate additional revenues.
JPM Stock Key Metrics
With shares at $118.89, JPM shares are trading at 1.6x P/TBV (TBV is $69.53 per share). The P/E multiple is 9.5x if we apply management’s targeted ROTCE of 17%, or 10.4x if we apply an expected ROTCE of 15.5%.
(Relative to history, JPM shares are on 9.5x, 12.0x and 7.1x P/E relative to 2019, 2020 and 2021 earnings respectively, though 2020-21 earnings are distorted by credit reserve builds/releases and not representative.)
JPM stock pays a dividend of $1.00 per quarter ($4.00 annualized), representing a Dividend Yield of 3.6%.
What To Expect After JPMorgan Chase’s Earnings
Our forecasts below show our expectations of JPM earnings for 2022 and beyond, and are based on the following assumptions:
- Tangible Book Value to rise to $225.2bn in 2022 then stay flat (was flat from 2021)
- Share count to be 2,933m at 2022 year-end (was 2,812m)
- ROTCE to be 14% in 2022 (was 15%), and 15.5% from 2023 (was 16.0%)
- Dividend to be on a 40% Payout Ratio from 2022
- Net Income after dividends to be spent on buybacks from 2023 (was from 2022)
- Buybacks to be done at 1.8x P/TBV (was 2.0x)
- P/E multiple to be 14.5x at 2025 year-end (was 15.0x)
The 0.5% lower ROTCE reflects the potential cost of optimizing the balance sheet to reduce JPM’s SCB requirement. We have reduced our exit P/E by 0.5x so that the implied Dividend Yield would be 2.8% on our new ROTCE assumption (it was 2.7% on the previous ROTCE assumption of 16%).
Our new 2025 EPS forecast is $13.23, virtually unchanged (was $13.22). Our forecasted TBV/Share figures imply a 2021-25 CAGR of 6%, mostly driven by buybacks reducing the share count by an average of 4% annually:
|
Illustrative JPM Return Forecasts 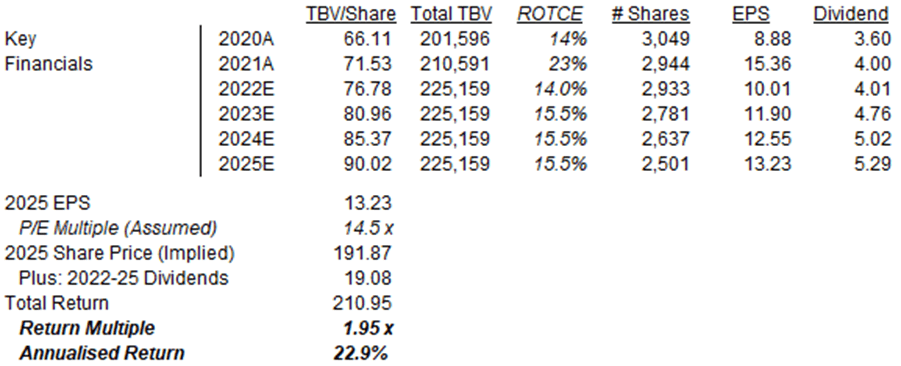 Source: Librarian Capital estimates. |
With shares at $111.89, we expect an exit price of $192 and a total return of 87% (20.9% annualized) by 2025 year-end.
For the near term, JPM shares may remain volatile as bank stocks have traditionally been sensitive to investor sentiment and macroeconomic outlook. Positive catalysts can include strong employment or purchasing data, further Federal Reserve rate increases and a return of bullish market views; negative events can include an reacceleration in commodity prices, worsening consumer credit reports, geopolitical tensions (with Russia and China especially).
Is JPM Stock a Buy, Sell Or Hold?
We reiterate our Buy rating on JPMorgan Chase stock.
Be the first to comment