


mihailomilovanovic/E+ via Getty Images
Elevator Pitch
I assign a Buy investment rating to CTO Realty Growth, Inc.’s (NYSE:CTO) shares. CTO is a Buy before upcoming earnings, because there is a mismatch between its current valuations and its future growth potential. CTO Realty Growth’s valuations are right in the middle of the pack among its peers based on the consensus forward price-to-FFO (Funds From Operations) per share valuation metric. In contrast, CTO’s expected FFO per share growth rates for this year and the next year are the strongest in the peer group.
CTO Stock Key Metrics
CTO Realty Growth is a real estate investment trust or REIT that is “focused on retail-based multi-tenanted assets that have a grocery, lifestyle or community oriented retail component and a complimentary mixed-use component, located in higher growth MSAs (Metropolitan Statistical Areas)” as per its June 2022 investor presentation slides.
Prior to previewing CTO Realty Growth’s upcoming earnings, there are certain metrics relating to CTO’s recent stock split and future dividends that are noteworthy.
On April 27, 2022, CTO disclosed that “a three-for-one stock split of the Company’s common stock” will “be effected in the form of a stock dividend” with its shares “trading at the post-split price on July 1, 2022.”
As I will highlight in this article, CTO Realty Growth’s dividend yields and valuations are reasonably attractive as compared to its peers. A key factor to note is that CTO’s trading liquidity is rather low which warrants a valuation discount. Based on my calculations, CTO’s average daily trading value for the past three months prior to the stock split was a rather modest $2 million.
Looking ahead, the expected improvement in trading liquidity for CTO’s shares driven by the recently completed stock split should be a catalyst driving a positive re-rating of CTO’s valuations in the future.
I will touch on CTO’s dividends in this section of the article, and discuss about the stock’s valuations in a subsequent section.
A Comparison Of CTO’s Consensus Forward Dividend Yields With Its Peers
| Stock | Consensus Forward FY 2022 Dividend Yield | Consensus Forward FY 2023 Dividend Yield | Consensus Forward FY 2024 Dividend Yield |
| CTO Realty Growth | 7.2% | 7.2% | 7.8% |
| RPT Realty (RPT) | 5.3% | 5.5% | 5.9% |
| Brixmor Property Group (BRX) | 4.7% | 4.8% | 5.0% |
| Kite Realty Group Trust (KRG) | 4.5% | 4.7% | 5.2% |
| Acadia Realty Trust (AKR) | 4.5% | 4.8% | 5.1% |
| American Assets Trust (AAT) | 4.5% | 4.6% | 5.4% |
| Saul Centers, Inc. (BFS) | 4.4% | 4.5% | 4.6% |
| Federal Realty Investment Trust (FRT) | 4.4% | 4.5% | 4.6% |
| Regency Centers Corporation (REG) | 4.2% | 4.3% | 4.4% |
| Urban Edge Properties (UE) | 4.2% | 4.3% | 4.4% |
| Kimco Realty Corporation (KIM) | 3.9% | 4.1% | 4.2% |
| SITE Centers Corp. (SITC) | 3.9% | 4.1% | 4.3% |
| Retail Opportunity Investments Corp. (ROIC) | 3.3% | 3.6% | 4.2% |
| Phillips Edison & Company, Inc. (PECO) | 3.2% | 3.3% | 3.4% |
Source: S&P Capital IQ
As per the table presented above, CTO boasts the most attractive forward dividend yields among its peers.
In the next few sections of the article, I focus my attention on the financial outlook for CTO Realty Growth.
When Does CTO Realty Growth Report Earnings?
CTO Realty Growth announced on June 29, 2022 that it will be releasing its Q2 2022 financial results a month later on July 28, 2022, after trading hours.
What To Expect From Earnings
Investors should expect strong FFO (Funds From Operations) growth and a lack of negative surprises from CTO Realty Growth for the upcoming Q2 2022 and the subsequent quarters as well, as a result of two key drivers.
Firstly, CTO highlighted in its June 2022 investor presentation that there is “over 250 bps (basis points) of future occupancy pickup based on current spread between (Economic) Occupancy and Leased Occupancy.” This is aligned with disclosures in CTO’s Q1 2022 results press release, with its Leased Occupancy and Economic Occupancy at 93.3% and 90.7% (difference of around 260 basis points), respectively as of March 31, 2022. In other words, there are new leases signed which will be reflected in CTO’s financial numbers over time.
Secondly, CTO Realty Growth has accelerated the pace of its investment activity (investments, dispositions, non-core asset monetization) in 2021. CTO’s total investment activity increased by +34% from $365 million in FY 2020 to $489 million in FY 2021 as per the chart below, which should be fully reflected in its 2022 performance. In 2022 year-to-date, CTO has already disclosed investments and dispositions amounting to $177 million and $24 million, respectively. This is more than half of the mid-point of its investment activity guidance of $303 million for this year.
CTO Realty Growth’s Investment Activity
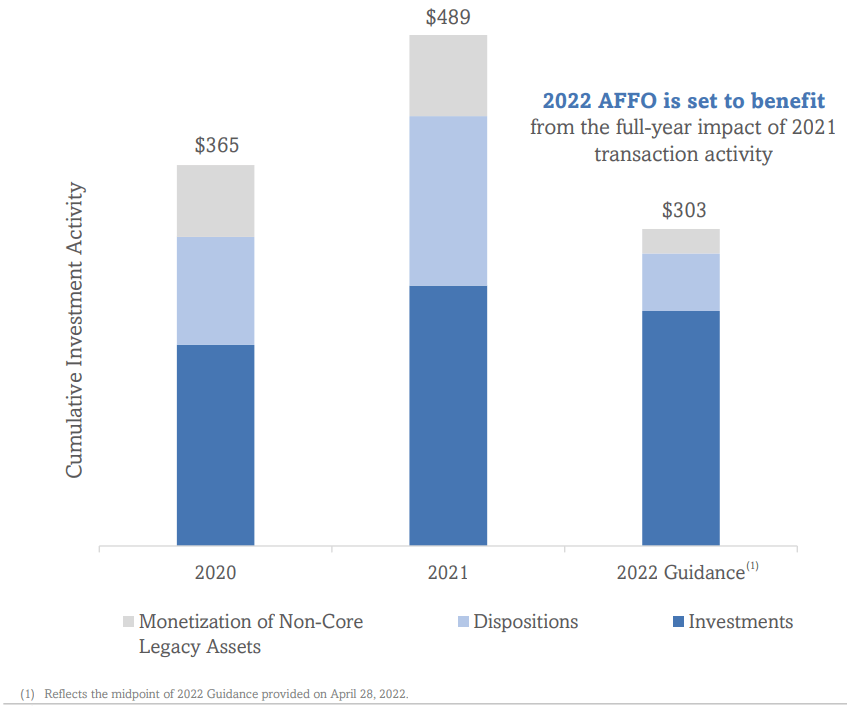
CTO’s June 2022 Investor Presentation
These two key drivers mentioned above should support CTO’s FFO growth in Q2 2022, FY 2022 and FY 2023. In the subsequent section, I describe CTO’s growth in quantitative terms.
What Is CTO Realty Growth’s Stock Forecast?
CTO Realty Growth’s FFO per share is forecasted to grow by +33% YoY to $0.37 in the second quarter of fiscal 2022, based on consensus financial projections sourced from S&P Capital IQ. The sell-side analysts also expect CTO’s FFO to rise by +21% and +8% to $1.59 per share and $1.72 per share for FY 2022 and FY 2023, respectively.
Wall Street’s consensus numbers for 2022 are in line with CTO Realty Growth’s management guidance. CTO had earlier guided for fiscal 2022 FFO per share of between $1.52 and $1.60 (adjusted for recent stock split) when it reported Q1 2022 results in end-April 2022.
I am of the view that the FY 2022 and FY 2023 FFO per share forecasts for CTO are achievable and realistic. As I noted in the preceding section of this article, CTO’s future growth for this year and next year has been largely secured by new leases signed and investments.
Is CTO Stock Undervalued Now?
CTO stock is undervalued now based on a peer comparison.
Peer Valuation Comparison For CTO
| Stock | Consensus Forward Next Twelve Months’ Price to FFO Per Share | Consensus Forward FY 2022 FFO Per Share Growth | Consensus Forward FY 2023 FFO Per Share Growth |
| CTO Realty Growth | 13.4 | +21% | +8% |
| Federal Realty Investment Trust | 16.1 | +8% | +6% |
| Regency Centers Corporation | 15.6 | -3% | +3% |
| Phillips Edison & Company, Inc. | 15.3 | +0.2% | +6% |
| Saul Centers, Inc. | 15.2 | +5% | +2% |
| Retail Opportunity Investments Corp. | 15.0 | +7% | +5% |
| American Assets Trust | 13.7 | +10% | +5% |
| Acadia Realty Trust | 13.1 | +1% | +3% |
| Kimco Realty Corporation | 13.0 | +11% | +5% |
| Urban Edge Properties | 12.8 | +8% | +8% |
| SITC Centers Corp. | 11.9 | -3% | +5% |
| Brixmor Property Group | 10.5 | +11% | +6% |
| Kite Realty Group Trust | 9.9 | +18% | +4% |
| RPT Realty | 9.5 | +9% | +6% |
Source: S&P Capital IQ
CTO Realty Growth has the highest expected FFO per share growth rates for FY 2022 and FY 2023 in the peer group highlighted above. Nevertheless, the market values CTO at a discount to six of its peers based on the consensus forward next twelve months’ price-to-FFO per share valuation metric.
As such, I am of the view that CTO’s shares are trading below fair value, and there is room for further capital appreciation.
Is CTO Stock A Buy, Sell, or Hold?
CTO stock is a Buy. CTO Realty Growth’s high single-digit dividend yield makes it an attractive investment candidate. Furthermore, CTO should narrow the valuation gap (according to the price-to-FFO per share valuation metric) between itself and its peers, which boast lower forward FFO per share growth rates, in time to come. The expected increase in trading liquidity for CTO Realty Growth after its recent stock split should also help the stock to command a higher price-to-FFO per share multiple.
Be the first to comment