


YinYang/iStock via Getty Images
Overview
At a high level, Costco (NASDAQ:COST) and Walmart (NYSE:WMT) seem quite similar — both are highly successful general goods retailers with operations around the world and both have market capitalizations over $100 billion range (figure 1, blue and orange lines).
Figure 1: Market cap for general goods retailers
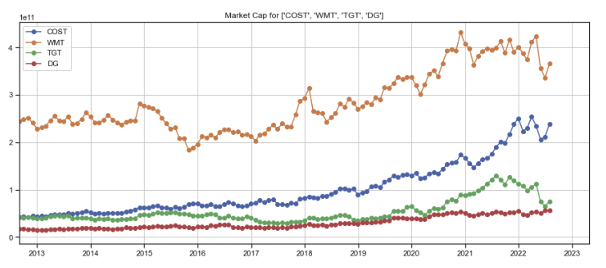
Created by author using publicly available financials and stock price data
However, with an earnings yield (i.e., the reciprocal of the price earnings ratio) of 2.3%, Costco’s valuation is higher than Walmart’s 3.4%, and has been consistently higher for an extended period of time (figure 2, blue and orange lines).
Figure 2: Earnings yield of Costco, Walmart, and comparables
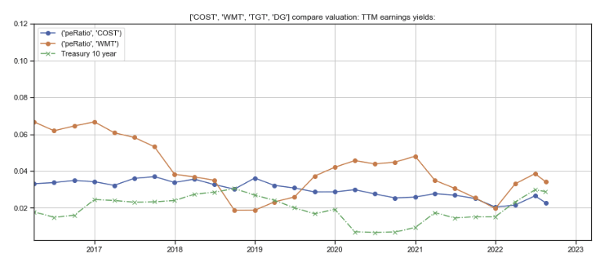
Created by author using publicly available financials and stock price data
In this article, I compare the growth, margins, and underlying drivers of these two companies to explore the question of whether Costco’s valuation premium over Walmart is justified. I then delve into how inflation has affected the companies’ inventory and customer purchases.
Customer demographics
According to a January 2022 study by analytics firm Numerator, the average Costco shopper is female, 39 years old, earns $125,000 a year, shops there 23 trips a year, and spends about $114 per visit. She is younger and earns 50% more than the average Walmart shopper, who is also female, 59 years old, earns $80,000 a year, shops at Walmart 63 trips a year, and spends about $54 per trip.
An older study in the summer of 2015 by researchers at Perfect Price, who went through “billions” of credit card transactions, concurs. The researchers found that shoppers spent an average amount per trip of $136 at Costco, $81 at Walmart’s Sam’s Club (which has a format very similar to Costco’s), and $55 at Walmart (figure 3). In comparison, shoppers spent $62 at Target, $59 at HEB, $56 at Shop & Shop, $54 at Whole Foods, and $50 at Whole Foods and Kroger.
Figure 3: Amount spent per trip at Costco, Walmart, and others
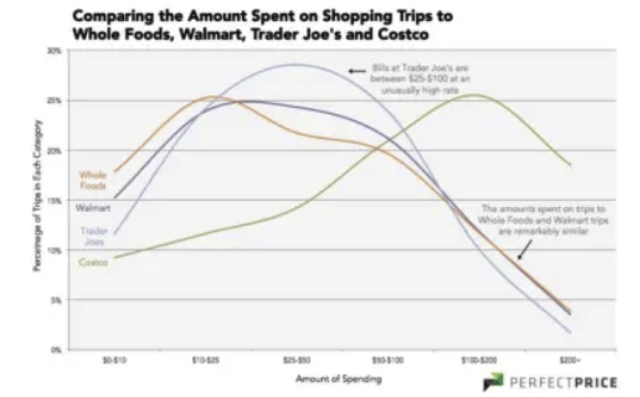
Perfect Price research
I believe that the higher annual income of Costco’s shoppers is a factor but not the only reason they spend more at each visit compared to other retailers. Costco attracts customers by selling high-quality products at extremely low mark-ups (after all, who doesn’t like a good deal?), but makes up for the razor-thin margins by selling products larger quantities (e.g., coffee in 4-pound bags, pencils by the two-dozen, and flour in 25-pound sacks). In doing so, it attracts customers that have sufficient “working capital” for the additional “inventory” while they work their way through their purchases and reduces the number of visits a customer makes.
Walmart’s Sam’s Club has emulated Costco’s business model and approach.
The warehouse club membership model
Costco and Sam’s Club both require customers purchase annual memberships (figures 4 and 5), which helps drive customer return visits.
Figure 4: Costco membership levels
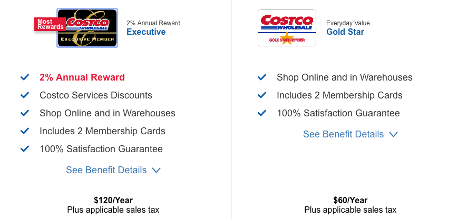
Costco website
Figure 5: Sam’s club membership levels
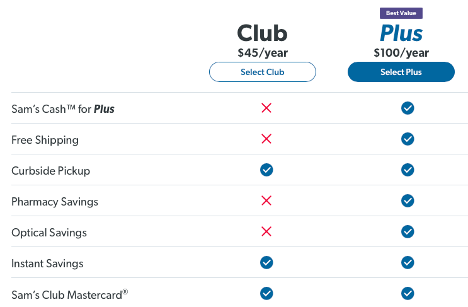
Sam’s Club website
By scanning members’ cards at every checkout, warehouse clubs like Costco and Sam’s Club track and analyze each customer’s purchase history, enabling them to offer a narrower range of merchandise and brands that matter to their customers and hold less inventory than other general retailers. Interestingly, a study by Sheena Iyengar, a Columbia University School of Business professor, demonstrated that shoppers are far more likely to make a purchase when presented with a relatively narrow range of options than if they were inundated with too many options. Her somewhat counter-intuitive finding explains why this strategy has worked so well.
Costco customers tend to be very loyal–92% of customers in the US and Canada and 90% worldwide renew annually, and many choose to upgrade to a higher tier that offers better rebates and additional services.
Revenue
Consolidated revenue
Walmart’s trailing twelve-month (TTM) consolidated revenue is approaching $600 billion — almost three times that of Costco’s (figure 6, red and blue lines). Over the last five years, Costco has grown its revenues by 80%, more than four times the rate of Walmart (figure 7, grey and purple dashed lines). However, Walmart’s per-share revenue growth has lagged Costco’s less (red and blue solid lines) because of its aggressive share buyback practice (figure 8, red line).
Figure 6: Trailing twelve-month revenue comparison
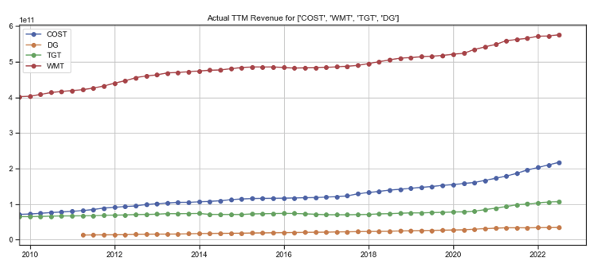
Created by author using publicly available financial data
Figure 7: Revenue and per-share revenue growth, indexed
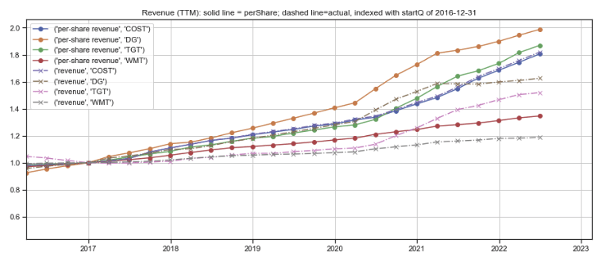
Created by author using publicly available financial data
Figure 8: Fully diluted shares outstanding
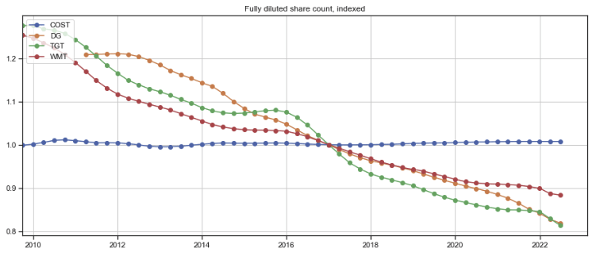
Created by author using publicly available financial data
Same store sales growth
Over the last five years, Costco’s comp store sales growth (figure 9, solid lines) has regularly out-performed Walmart’s (dashed lines).
Figure 9: Comp store sales growth
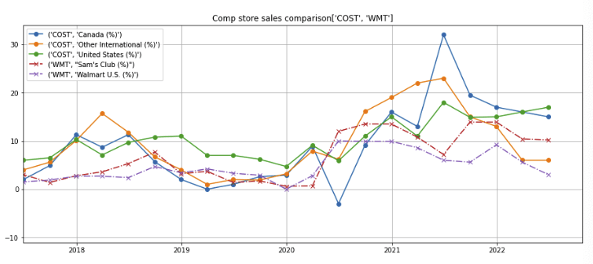
Created by author using publicly available financial data
Store count
Walmart has 10,585 stores (including 600 Sam’s Club warehouse stores), almost thirteen times Costco’s 830 warehouse stores (figure 10).
Figure 10: Store count
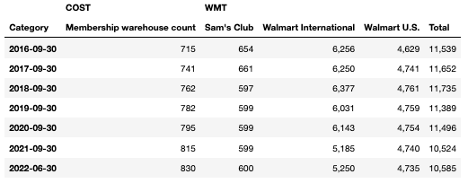
Created by author using publicly available financial data
International expansion
Since 2016, the number of Walmart stores has declined by about 8% (figure 11, purple dotted line). Even though Walmart’s US store count has been stable (red dashed line), the company has trimmed back the number Sam’s Club stores by about 8% (orange dashed line) and reduced international stores by over 15% (green dashed line).
In comparison, Costco has grown its store count by over 15% over the last six years (blue line) and been successful in countries where other retailers have struggled. Its first store opening in Shanghai drew such large crowds that the store ran out of inventory and had to close early.
Figure 11: Store count comparison
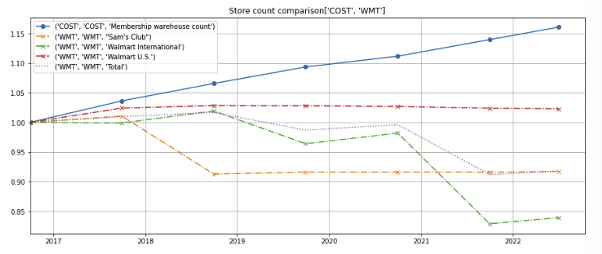
Created by author using publicly available financial data
Walmart sold its Japanese stores to Seiyu and UK stores to the Issa Brothers/TDR Capital (figure 12, olive and light blue lines). It also exited Argentina, Brazil, Canada, and reduced it store count in Central America outside of Mexico.
Figure 12: Walmart International store count
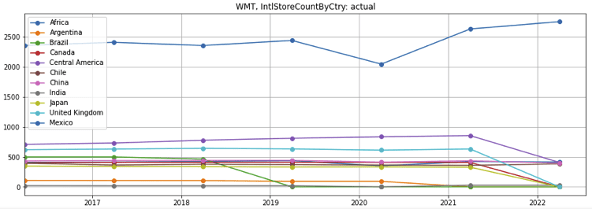
Created by author using publicly available financial data
In contrast, the growth rate of Costco’s Canadian and international stores has kept up with its US stores (figure 13, left axis, red, blue, and green lines). More significantly, Costco’s Canadian and international stores have higher margins (right axis, red and blue dotted line) than its US stores (green dotted line).
Figure 13: Costco international expansion
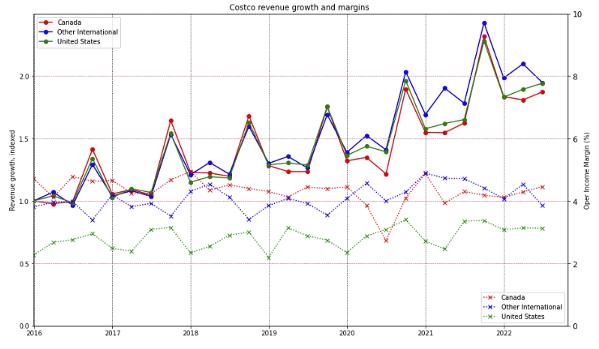
Created by author using publicly available financial data
Revenue per store
Costco’s stores are highly productive–the average warehouse generates annual sales of over $250 million (figure 14, blue line), almost twice that of the average of $125 million at Sam’s Club and $55 million at the average Walmart store (orange and green lines) (although please note that these Walmart per-store numbers may be low as about $70 billion or 12% of Walmart’s revenues are e-commerce or digital orders).
Figure 14: Per-store sales comparison
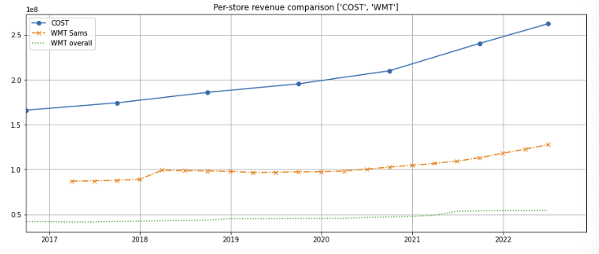
Created by author using publicly available financial data
Furthermore, Costco’s average per-warehouse sale (figure 15, blue line) has also grown faster than Walmart and Sam’s Club stores (green dotted and orange dashed lines).
Figure 15: Per-store sales growth, indexed
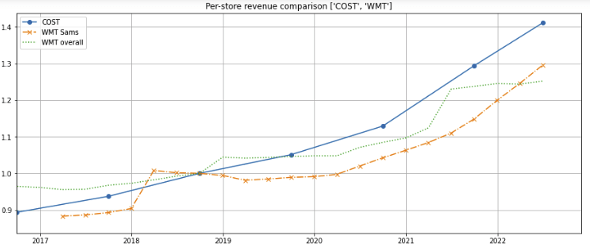
Created by author using publicly available financial data
E-commerce
Costco offers its customers e-commerce purchase options, which account for about 7% of total net sales in 2021 and grew 44% year-over-year. However, I believe the company’s main competency is as a warehouse store retailer, an area where it has a distinct advantage over other general goods retailers.
Walmart has been building out its e-commerce capabilities and derives about $70 billion, or about 12% of its annual revenues from e-commerce, which consists of Walmart.com, which offers both ship-to-home and store pickup, as well as the Flipkart e-commerce platform in India.
Walmart has 126 dedicated e-commerce fulfillment centers, of which 43 are in the US (12 of which are part of Sam’s Club). In comparison, Amazon (AMZN) has 185 e-commerce fulfillment centers, of which 110 are in the US. Even though Walmart leverages its superstores to ship or deliver orders, its stores are far less efficient than the dedicated and highly automated e-commerce fulfillment centers. I believe Walmart still lags Amazon and needs to build out complete logistics and end-to-end delivery capabilities before it can compete on equal footing with Amazon. (please see my previous article on Amazon on the challenges retailers like Walmart, Target, and Walgreens face in the e-commerce arena).
Margins
Gross margins
Costco maintains razor thin gross margins of 12-13% (figure 16, blue line)—half that of Walmart’s ~25% (red line), and far lower Target’s (TGT) 28-30% and Dollar General’s (DG) 31-33% (green and orange lines).
To compensate for its low gross margins, Costco sells its products in larger quantities, in effect offering customers a volume discount to buy in bulk.
Figure 16: Gross margin comparison
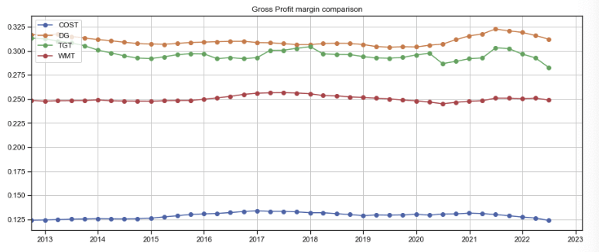
Created by author using publicly available financial data
EBITDA margins
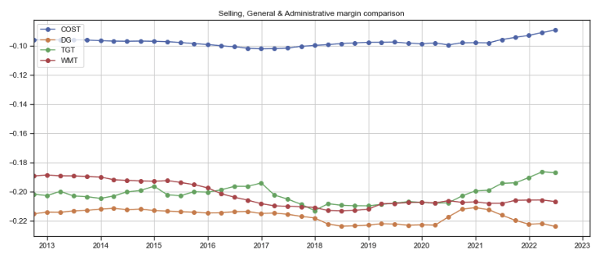
Costco has maintained and improved its profitability because its warehouse format enables it to keep overhead much lower than other retailers—products are often shipped directly to its stores and stacked high on the shopping floor, which reduces labor as it requires minimal re-arrangement. While most retailers have an SG&A (selling, general, and administration) margin of over 18% (figure 17, red, orange, and green lines), Costco has been able to keep its SG&A to around or below 10% of revenues for the last decade (blue line).
Figure 17: SGA margin comparison
Created by author using publicly available financial data
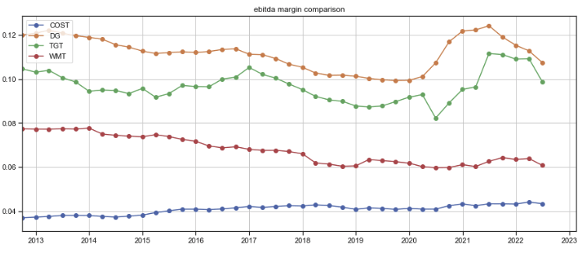
As a result, Costco has been able to benefit from operating leverage as it scales up. Over the last decade, Costco has steadily pushed EBITDA margins upwards to over 4% (figure 18, blue line). In contrast, Walmart’s EBITDA margin has compressed by almost 200 basis points over the same period (red line).
Figure 18: EBITDA margin comparison
Created by author using publicly available financial data
Net income margin
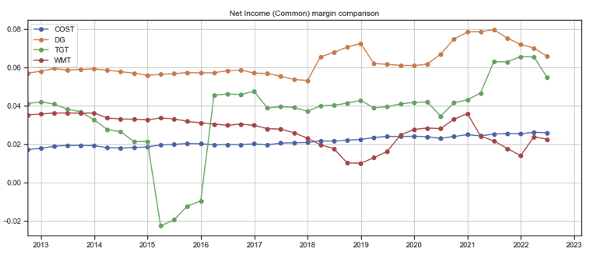
Similarly, Costco’s net income margin has steadily expanded since 2013 (figure 19, blue line), while Walmart’s has decline over the same period (red line)
Figure 19: Net income margin comparison
Created by author using publicly available financial data
Inventory
Inventory turns
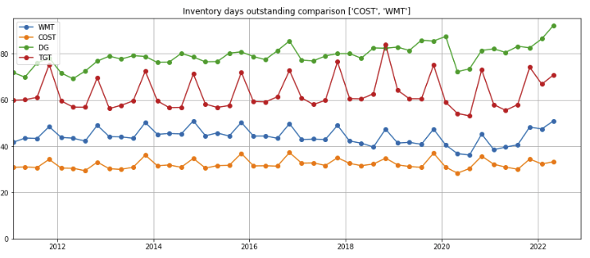
Costco turns its inventory (figure 20, orange line) much faster than Walmart (blue line) and other retailers (red and green lines) due to its strategy to maintain a relatively narrow selection of merchandise and high customer throughput. (Inventory days is defined as inventory / annual cost of goods sold x 360 days).
As discussed above, a study by Columbia University professor Sheena Iyengar provided empirical evidence that this somewhat counter-intuitive strategy of limiting customer choices actually improves sales conversion.
Figure 20: Inventory days outstanding comparison
Created by author using publicly available financial data
Reports of the inventory glut and inflation
Recent headlines have brought attention to the inventory glut retailers face. For example, an August 12, 2022, article in the Wall Street Journal observed:
Many retailers that had too little to offer during the early stages of the pandemic now have too much of everything—from bikes and furniture to clothing and barbecue grills. They amassed the extra inventory because they expected sustained demand and supply-chain problems. What they didn’t expect is that customers would shift their spending to concerts, restaurants and travel, or that rising inflation would eat away at household budgets.
The resulting pileup of unsold goods forced many big national chains such as Walmart and Target to mark down merchandise this year, warning that profits would suffer.
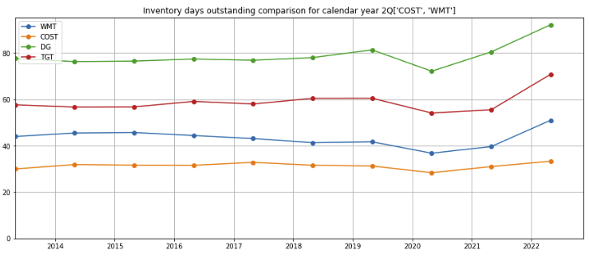
To make matters worse, the recent surge in inflation has driven up the cost of inventory needed to replenish sold goods. The number of days of inventory held at Target, Dollar General, and Walmart (figure 21, red, green, and blue lines) have spiked up noticeably over the last year. Excess inventory coupled with a drop in price levels often results in markdowns and write-downs, particularly for companies that use the “last in, first out” method of inventory accounting (described in page 45 of Walmart’s 2021 form 10-K filing)
In comparison, the number of days of inventory held at Costco has stayed within the historical 30-35 day range (orange line), which reduces the risk of markdowns and write-downs.
Figure 21: Second quarter Inventory days outstanding comparison
Created by author using publicly available financial data
Inflation-adjusted days of inventory held
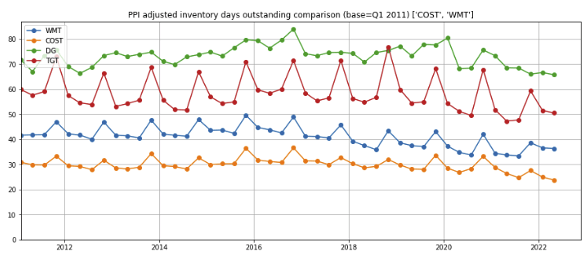
To understand the impact of inflation on inventory levels, I estimated the real value of the inventory held at each company by dividing the inventory days outstanding (from data in figure 20 above) by the Producer Price Index (PPI) of Total Consumer Goods in the U.S. available from the St. Louis Federal Reserve’s FRED database (PITGCG01USM661N).
According to this calculation, the real, PPI-adjusted inventory value of Costco and Walmart have declined–which I did not expect for Walmart (figure 22, orange and blue lines). (For the accounting geeks: Walmart’s inventories are valued at the lower of cost or market using the last-in, first-out (LIFO) method, with a LIFO provision for the estimated annual effect of inflation which are adjusted to actual results at year-end. Costco has a similar lower of cost or market valuation using a LIFO method. As the inventory levels of 35 and 50 days at Costco and Walmart are relatively low, I believe there is less room for the under- or over-estimation of the LIFO provision)
Figure 22: PPI-adjusted inventory days outstanding comparison
Created by author using publicly available financial data
Impact of inflation on member spending
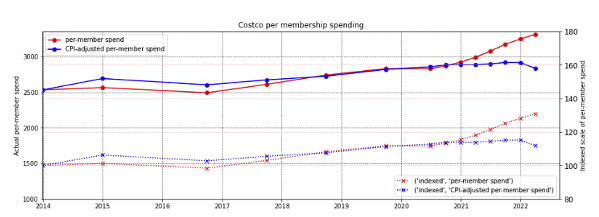
Since 2014, Costco’s per-paid membership annual spending has increased by 30% to about $3,300 (figure 23, red solid line). On a CPI-adjusted basis, the number has increased by less than 20% (blue solid line).
Figure 23: CPI-adjusted revenues per member
Created by author using publicly available financial data
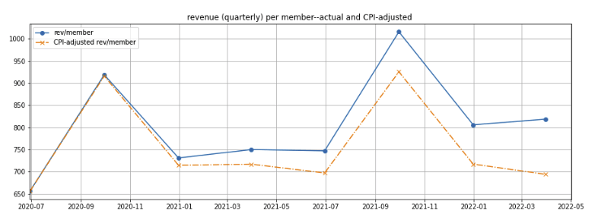
As inflationary pressures intensified in 2022, per-paid membership revenue for each quarter rose compared to the year-ago quarter (figure 24, blue line). However, the real CPI-adjusted per-membership spending (derived by dividing the inventory days outstanding for the quarter by the Consumer Price Index for All Urban Consumers: Nondurables in U.S. City Average available from the St. Louis Federal Reserve’s FRED database (CUSR0000SAN)) shows that members’ real, CPI-adjusted spending has not increased over the last year (orange dashed line). This is an indicator that the rising revenues over the last year is driven by inflation and even Costco’s relatively affluent customers are controlling their spending.
Figure 24: CPI-adjusted quarterly revenues per member
Created by author using publicly available financial data
Stock price and beta
Since 2015, Costco stock has appreciated by 4.5x (figure 25, blue line) and delivered a return twice that of the S&P 500 index (green line). In comparison, Walmart has barely doubled (purple line) and underperformed the S&P 500.
Figure 25: Stock price comparison
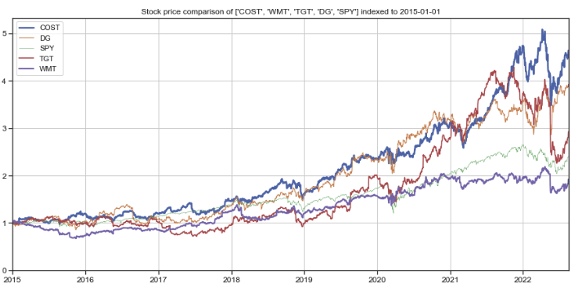
Created by author using publicly available stock price data
Conversely, Walmart stock has displayed a lower beta, or level of volatility, (figure 26, orange line) compared to Costco (blue line) and may be attractive for investors who have less stomach for a rough roller coaster ride.
Figure 26: Stock beta (volatility) comparison
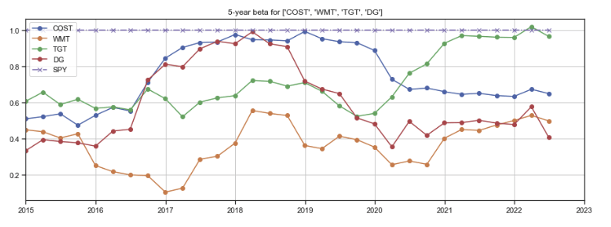
Created by author using publicly available financial and stock price data
In summary
- Costco and Walmart are both leading general goods retailers that look reasonably similar at a high level.
- Walmart has a larger footprint, more stores, and its average shopper makes three times as many visits as the Costco shopper. However, each Costco warehouse generates far more revenues than a Walmart or Sam’s store.
- Costco has a more affluent customer base, a differentiated business retail model, and executed well domestically and in international markets. It has delivered strong KPIs, revenue growth, and operating leverage.
- Costco’s lower inventory and higher turns gives it a distinct advantage, both in today’s inflationary environment and beyond.
- I believe Costco deserves a premium valuation and would choose Costco over Walmart at today’s valuations. However, I would be cautious as neither stock is cheap.
Be the first to comment