

niphon
This article will look at the life sciences technology company IQVIA Holdings Inc. (NYSE:IQV) from a technical perspective to see if its recent price action suggests a long position should be established. Relative strength and potential stop loss prices will be analyzed.
When I look to buy a stock, I use a combination of price action, moving averages, and relative strength to determine if I should establish a position. Price action can identify entry levels and stop loss levels. Moving averages help me identify intermediate and long-term trends. Relative strength helps me identify exchange-traded funds (“ETFs”) or stocks that are outperforming the S&P 500 index which is an investment objective of mine. Let’s look at the price action, moving averages, and relative strength of IQV to determine if I should go long the stock.
Chart 1 – IQV monthly with 6- and 10-month moving averages
www.stockcharts.com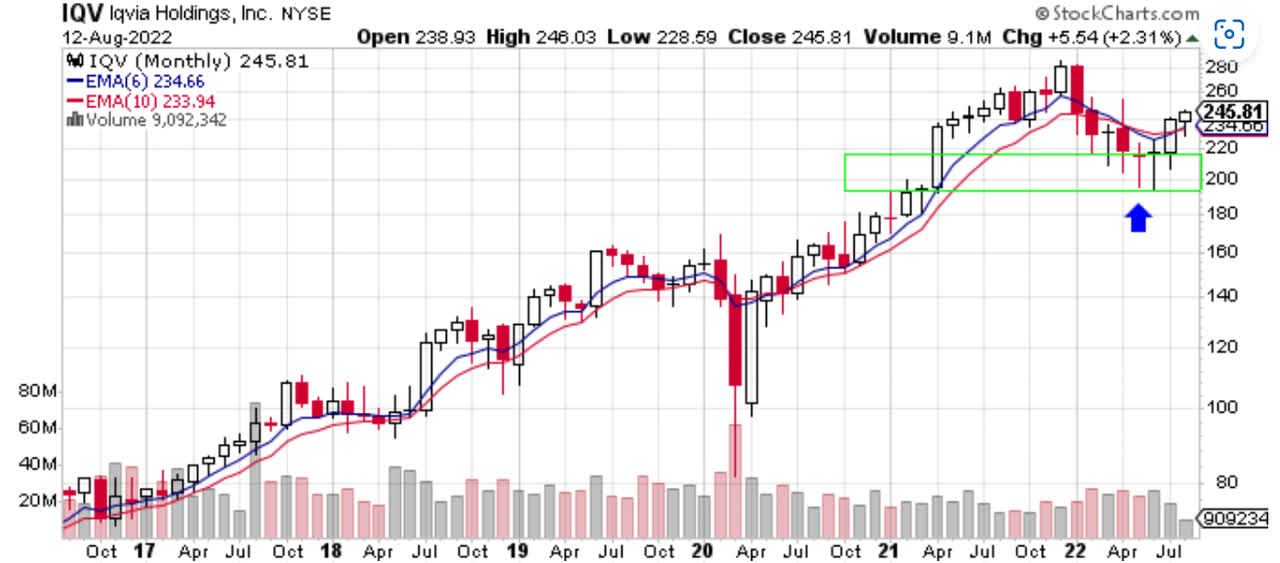
Chart 1 shows IQV on a monthly chart. The two moving averages shown are the blue six-month moving average and the red ten-month moving average. The six-month moving average is an intermediate time frame for me. The ten-month is a long-term moving average for me. A bullish indication is when price is above both moving averages and both moving averages are trending higher.
Whenever a stock goes from the lower left-hand portion of the price chart to the upper righthand portion of the price chart that is a stock you wished you owned. That is an upward trending stock. IQV has been above the blue six and the red ten-month moving averages since 2017 with few exceptions. The COVID-19 selloff and the recent bear market are notable times when IQV failed to be above those two moving averages. By looking at Chart 1 you can see that IQV made an all-time high back in December 2021 around $285. IQV then fell with the bear market. IQV declined around 32% over the next six months before making a stand around $200. Now IQV has worked its way higher. You can see that the green box was an area of support for IQV. IQV is now above both moving averages and both moving averages are trending higher. I consider that to be bullish. A caveat to my analysis of Chart 1 is that Chart 1 is based on the price at the end of the month. With half the month of August to go, IQV could easily close the month below both moving averages and below the green box. However, now, I like what I see on the monthly chart.
Chart 2 – IQV weekly with 30-week moving average & relative strength
www.stockcharts.com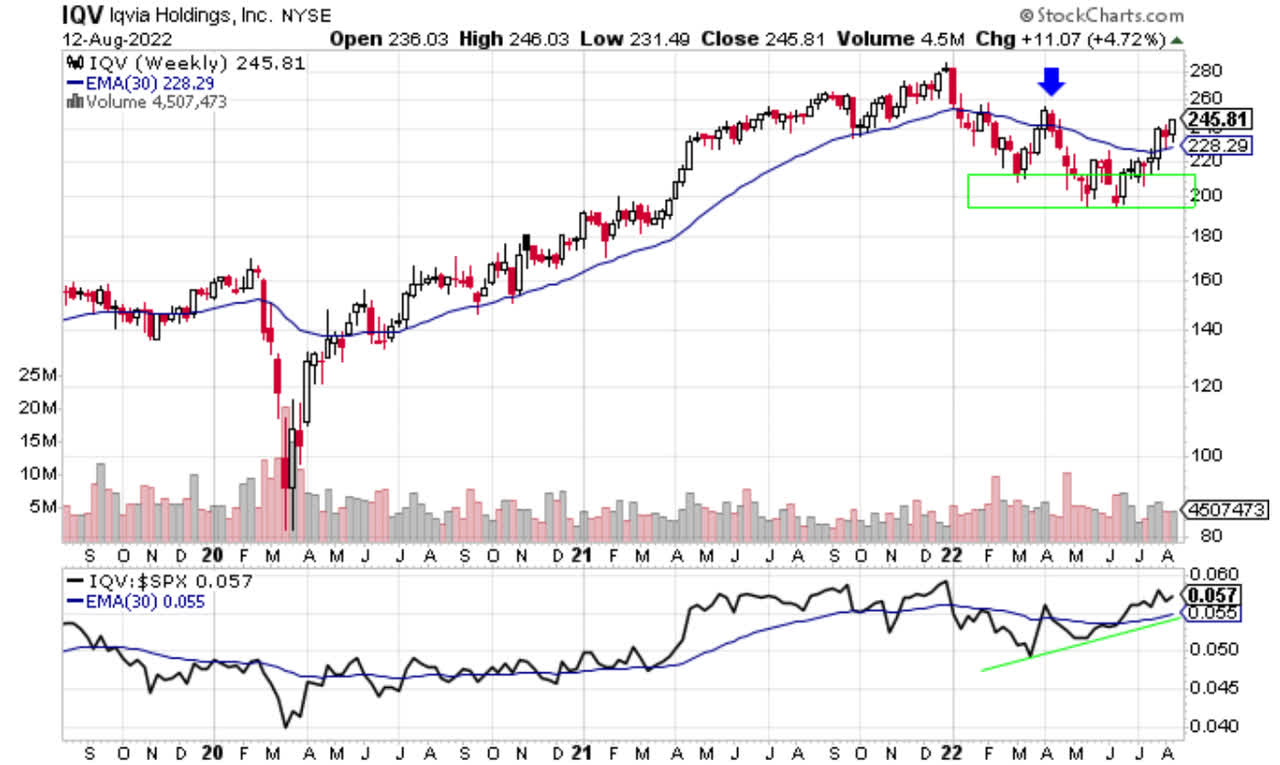
A couple of things catch my eye on Chart 2. The 30-week moving average is an intermediate term moving average for me. It is like the six-month moving average in Chart 1. I like to use closes above the 30-week moving average, when the moving average is trending higher, as good entry points for stocks. When the bear market began late in 2021 or early 2022 you can see that IQV closed below the 30-week moving average. You can also see the 30-week moving average start to roll over or trend downwards. That is bearish. IQV did rally in March and managed to close above the 30-week moving average which seemed bullish. However, you can notice that the moving average itself was still sloping downwards at that time. That was not bullish. In other words, there was no confirmation between price and the 30-week moving average. It is best not to buy until you have both a close above the moving average and the moving average itself moving higher. IQV closed below the 30-week moving average the following week and headed lower. Then IQV started putting in a base. During April, May, and June IQV moved sideways forming a consolidation or basing pattern. That makes sense since IQV declined over 30% from its high in December 2021. Stocks often fall, base, and then rally. The “V” shape recovery is not normal. Now, IQV has reclaimed its 30-week moving average and has held above it for 3 consecutive weeks. That is bullish. Also note that the 30-week moving average is starting to trend higher. That is bullish and different from when IQV closed above that moving average back in March. Now we have bullish confirmation of price and moving average.
The lower pane of Chart 2 shows the ratio of IQV to the S&P 500 index. It is a relative strength price chart. When the black line is moving higher that shows that IQV is outperforming the S&P 500 index. When the black line is moving lower that shows that IQV is underperforming the S&P 500 index. The blue line is the 30-week moving average of the ratio. I want to own stocks or ETFs that are outperforming the S&P 500 index. IQV fits that requirement. The black line is moving higher and is above its rising 30-week moving average. That is bullish behavior.
Chart 3 – IQV daily with 20- 50- and 200-day moving averages
www.stockcharts.com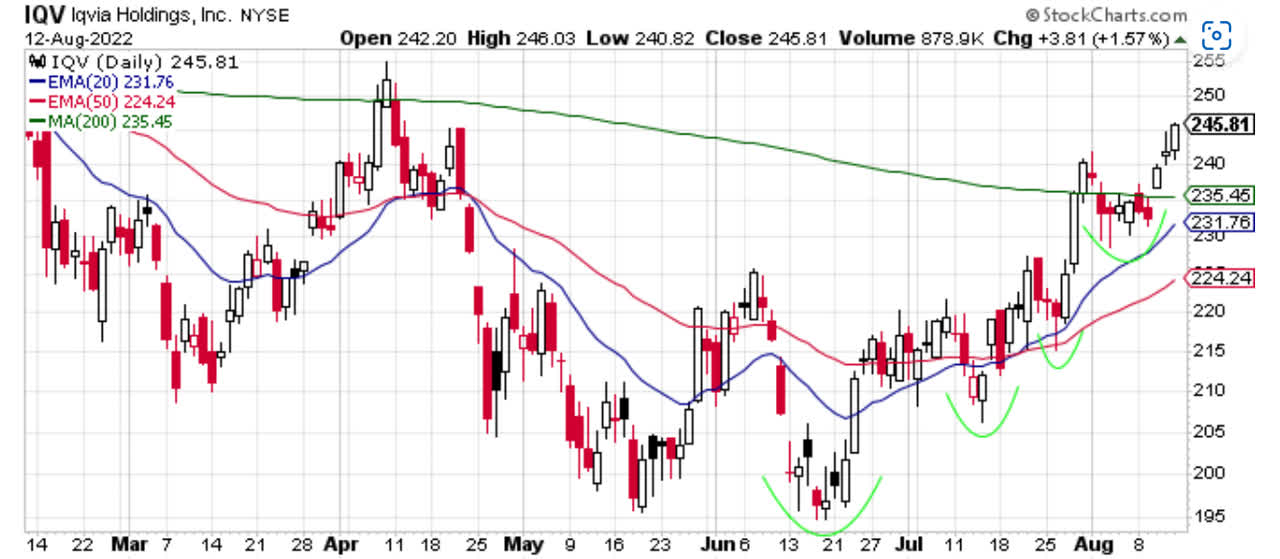
Chart 3 shows the price action of IQV on a daily chart. There is a lot to like on this chart. IQV made a double bottom formation in May and June with June being the low of the decline. Since then, IQV has made a series of higher highs and higher lows. See the green parabolas on the chart. That is the textbook definition of an uptrend. IQV is above all three moving averages. The 20-day moving average is above the 50-day moving average which is bullish. Both moving averages are trending higher which is bullish. Most likely soon, the 20 and 50-day moving averages will cross above the 200-day moving average which is bullish.
I see enough bullish signals to tell me I want to be long IQV. Now where is a good place for a stop loss? I like to use stop losses to protect my downside. My analysis could be wrong and if so, I want to preserve my capital by taking a small loss. Then I can go find another place for my money. The obvious place for a stop loss is just below the June lows. That would be about $194. That is a long way from current price. I don’t feel comfortable with that as my stop loss. The other options I see on Chart 3 are the swing lows of $205, $215, and $227. If you buy at the current price of $245 and target IQV’s all-time high of $285 as an initial price target you get a gain of $40 or 16%. I want to ensure that I have at least a 1:2 risk to reward ratio. So that means I am willing to risk $20 to make $40. For me my initial stop loss would be the $227 price area. Keep in mind that $227 could be used as an initial stop loss. You could sell a portion of your position at $227 and the rest of your position at $215. This allows you to scale out of a position just like many investors like to scale into a position.
Another way to identify a stop loss is any close below the 30-week moving average. Since the 30-week moving average has a confluence of bullish signals any close below that moving average could indicate the analysis is flawed.
I typically combine the two approaches. I use the daily chart to identify my initial stop loss. Once price continues to rally above the 30-week moving I continue to bump up my stop loss until it is above the 30-week moving average. Then I can use a close below that average as my stop loss. Again, there are numerous ways to select a stop loss and I always have one on my trades.
In summary, IQV is a stock I want to own. It has bullish price action, it is above key moving averages that are trending higher, and it is outperforming the S&P 500 index. I look to go long IQV at current price and have an initial stop loss around $227. My initial price target is $285, and I would look to hold IQV as long as it stays above a rising 30-week moving average.
Be the first to comment