

Zeynep Ozdelice/iStock via Getty Images
Overview
Wayfair (NYSE:W) is an online retailer focused on furniture and home goods items. Founded in 2002, the company conducted an initial public offering at $29 per share back in Q4 2014.
While appreciating significantly throughout, and particularly so during the pandemic era, Wayfair has since lost most of its value and is now trading close to its IPO price as of this article.
SeekingAlpha.com W 11.21.22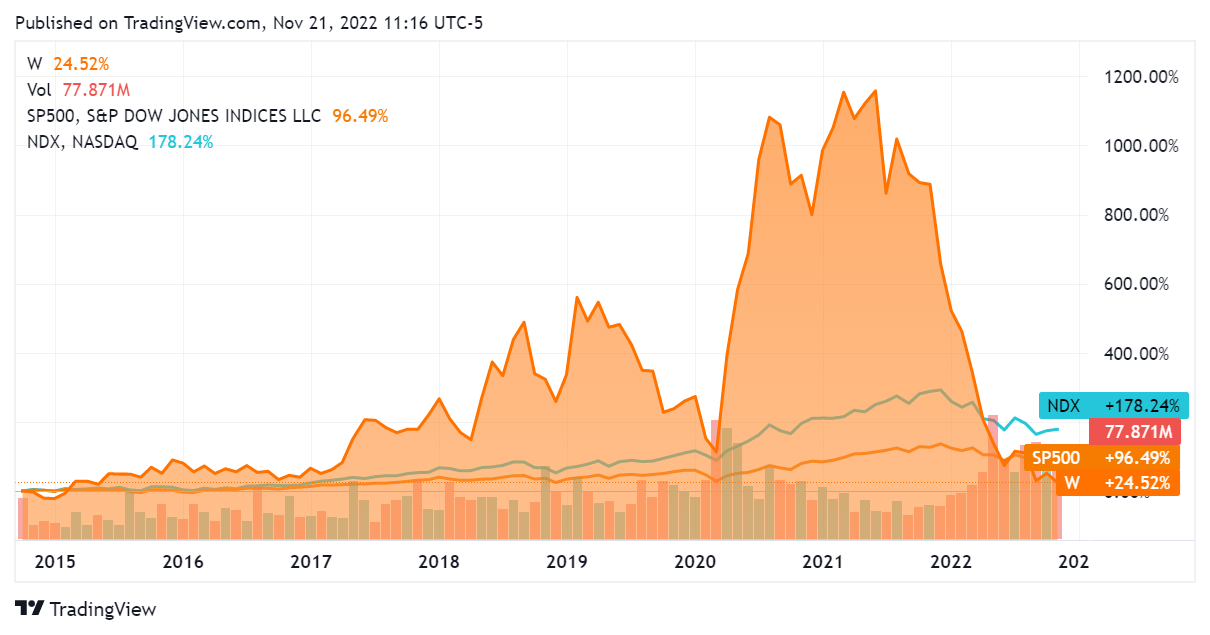
The company posted better-than-expected results for its Q3 2022 earnings report, with an EPS of -$2.11 ($0.05 better than consensus) and revenues of $2.84B ($30.31M better than consensus).
Nonetheless, these are still negative earnings per share. Also of concern is the fact that this earnings report saw revenues decline 9.01% YoY. While this can perhaps be attributed to its strong performance during the pandemic, it is of course a negative indicator for any company – and all the more so for any technology entity.
Wayfair.com 11.21.22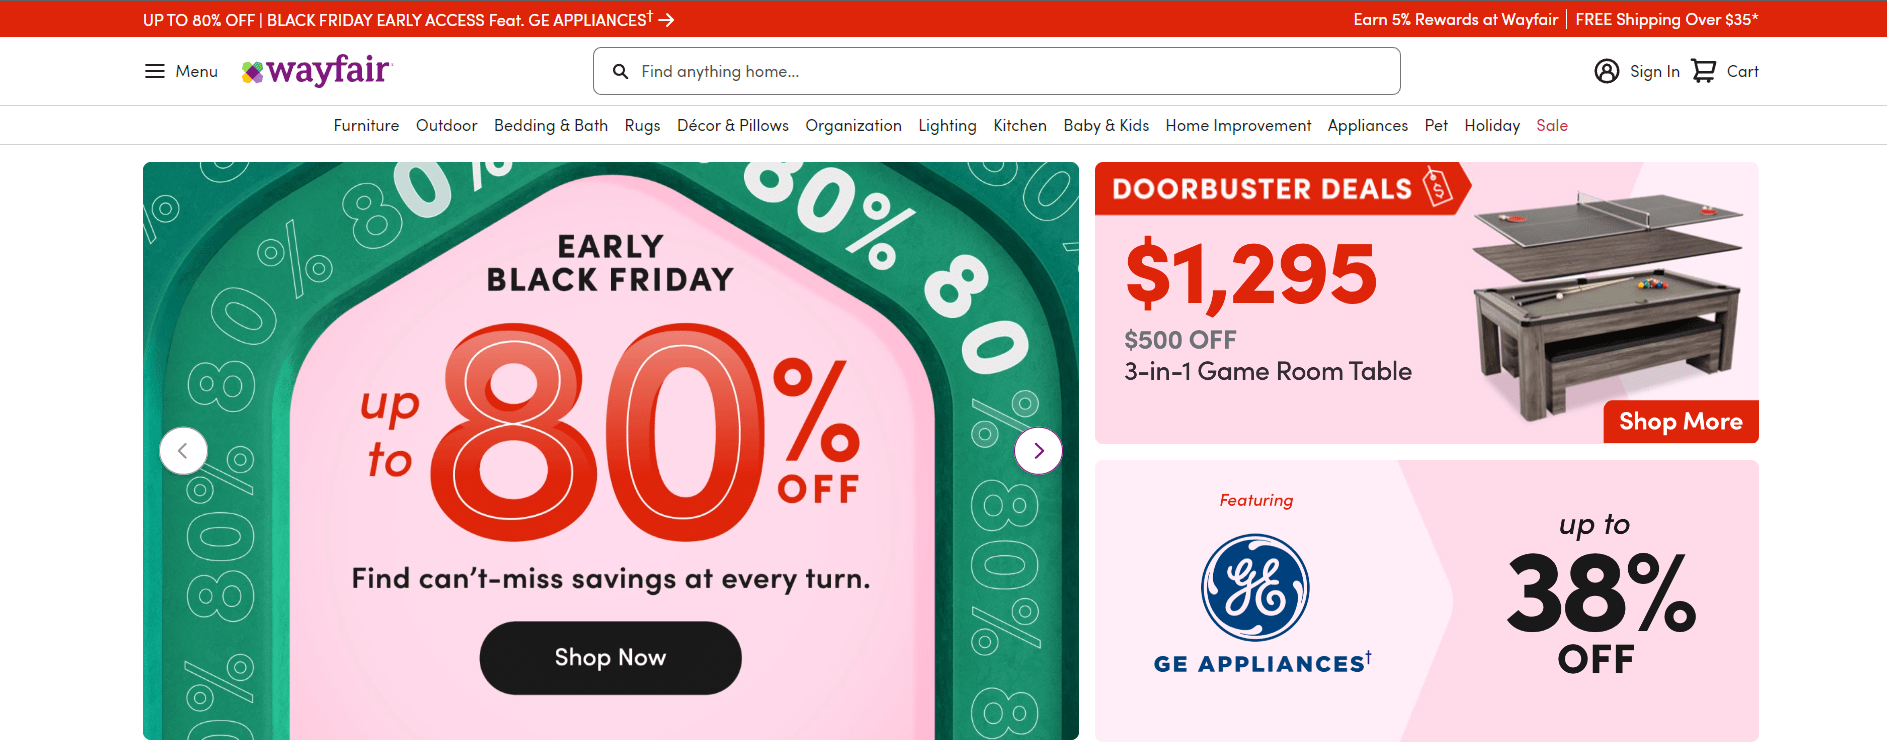
Additionally the company must compete with Amazon, which tends to be disadvantageous in my experience. This article will look through Wayfair’s business on a fundamental level and determine the direction it is headed.
Financials
Wayfair’s revenues have growth significantly over the years, and the trendline here is a good one overall. Revenues grew at around 50% seemingly every year – until this stopped abruptly in fiscal year 2021. Instead of continuing momentum on revenue growth, Wayfair posted a revenue decline of 3.1% between fiscal years 2020 and 2021. The trailing twelve months figure shows that this revenue decline has continued, with TTM revenues 9.8% lower than fiscal year 2021 and 12.6% lower than fiscal year 2020.
SeekingAlpha.com W 11.21.22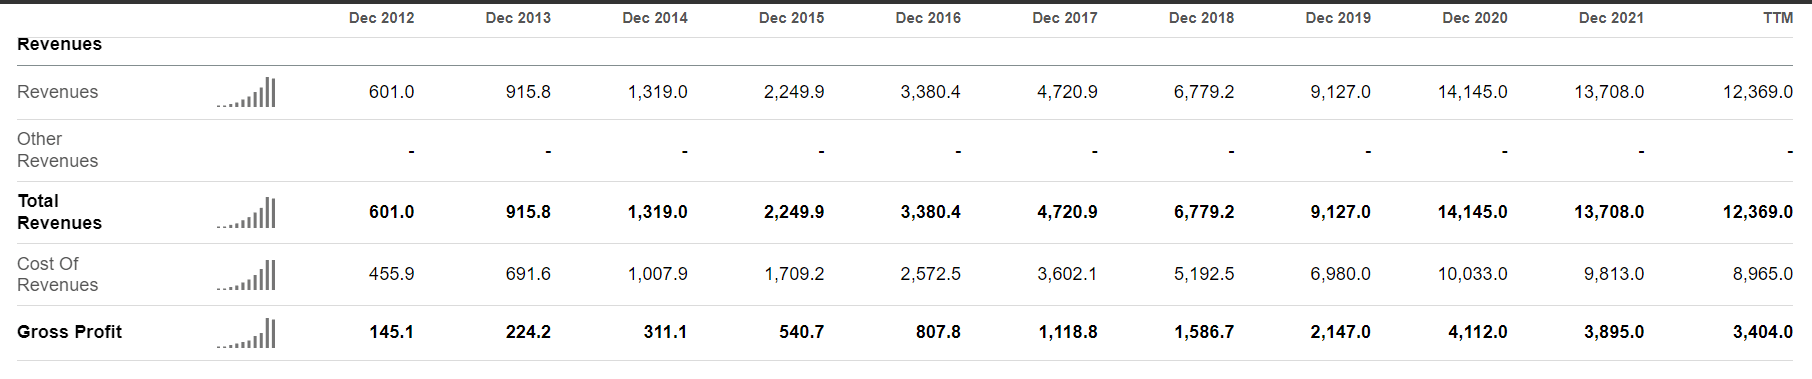
In line with its revenue figures Wayfair posted record gross profits in 2020, while also seeing this decline since then. Since the company does not own its own inventory, however, we won’t read too far into this figure. The company does report some inventories on its balance sheet, but this figure is quite small ($103M TTM) and is not material in the context of its revenues.
In this asset-light (inventory-free) business model we would expect capital efficiency and profitable operations. Unfortunately this has not been the case for Wayfair: it only generated an operating income for 1 year out of the last 9. The company swung back to an operating loss in 2021 and has actually begun to lose significant amounts of money in its operating cycle since. TTM, for every dollar in revenue that it has generated, Wayfair actually lost $0.95 – not a healthy indicator.
SeekingAlpha.com W 11.21.22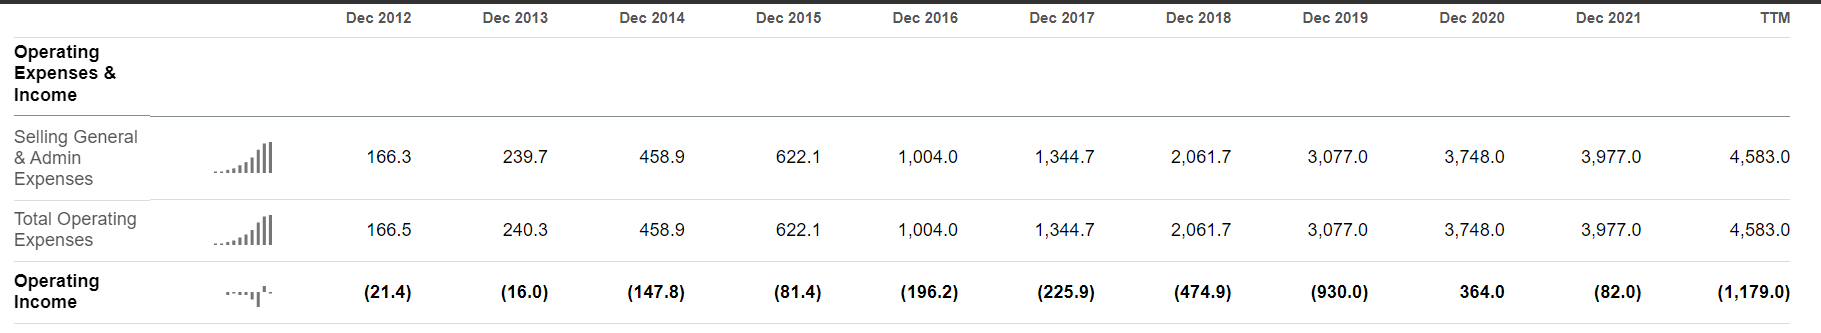
Since the company’s operating cycle is losing money in of itself, there wouldn’t be too much to glean from looking at the net income. Nonetheless this figure may include some kind of non-operating income that the company is generating and it warrants a quick peek. Unfortunately it reiterates that the company is indeed a money loser across the last decade, although the relatively small disparity between its operating loss and net income at least tell us that it doesn’t contend with an overly burdensome fixed cost structure. This disparity has actually shrunk somewhat TTM, indicating that the company has been cutting costs in response to business pressures.
SeekingAlpha.com W 11.21.22
Looking at cash flow, we see that Wayfair has actually generated positive cash from operations for most of the last decade. This may be difficult to interpret since it loses money from operations on an accrual basis, but it makes sense when you consider that customers pay Wayfair and then await the arrival of goods. As such, it is able to capture cash and then pay out its liabilities on a rolling basis. This is actually an advantage when operating a business and is referred to as a ‘negative operating cycle’. It helps the company manage cash flows for its business because it has cash coming in up front; other notable examples of this would of course be Amazon as well as Uber.
The concern here is that the equation has shifted against Wayfair on a TTM basis. While it has generally been able to have positive cash from operations and thus feed that back into its business, this doesn’t appear to be holding up any longer. In fact, its TTM cash loss from operations is 347% that of its biggest operational cash loss (fiscal year 2019) over the last decade. This is a significant red flag and indicates that the company will have to shift its posture as to managing cash, perhaps drawing down on a revolving credit facility – and paying the associated costs of doing so.
SeekingAlpha.com W 11.21.22
This has indeed been the case, although management seemed to foresee this eventuality. Wayfair has been losing cash to interest payments since 2018. While that figure took a small dip in 2019, it doubled in 2020 and then doubled again for fiscal year 2021. Concerningly the TTM figure shows an ongoing increase in the company’s interest obligations. This, along with the breakdown of its cash/operating cycle equation, is another immediate pressure on the firms cash situation.
SeekingAlpha.com W 11.21.22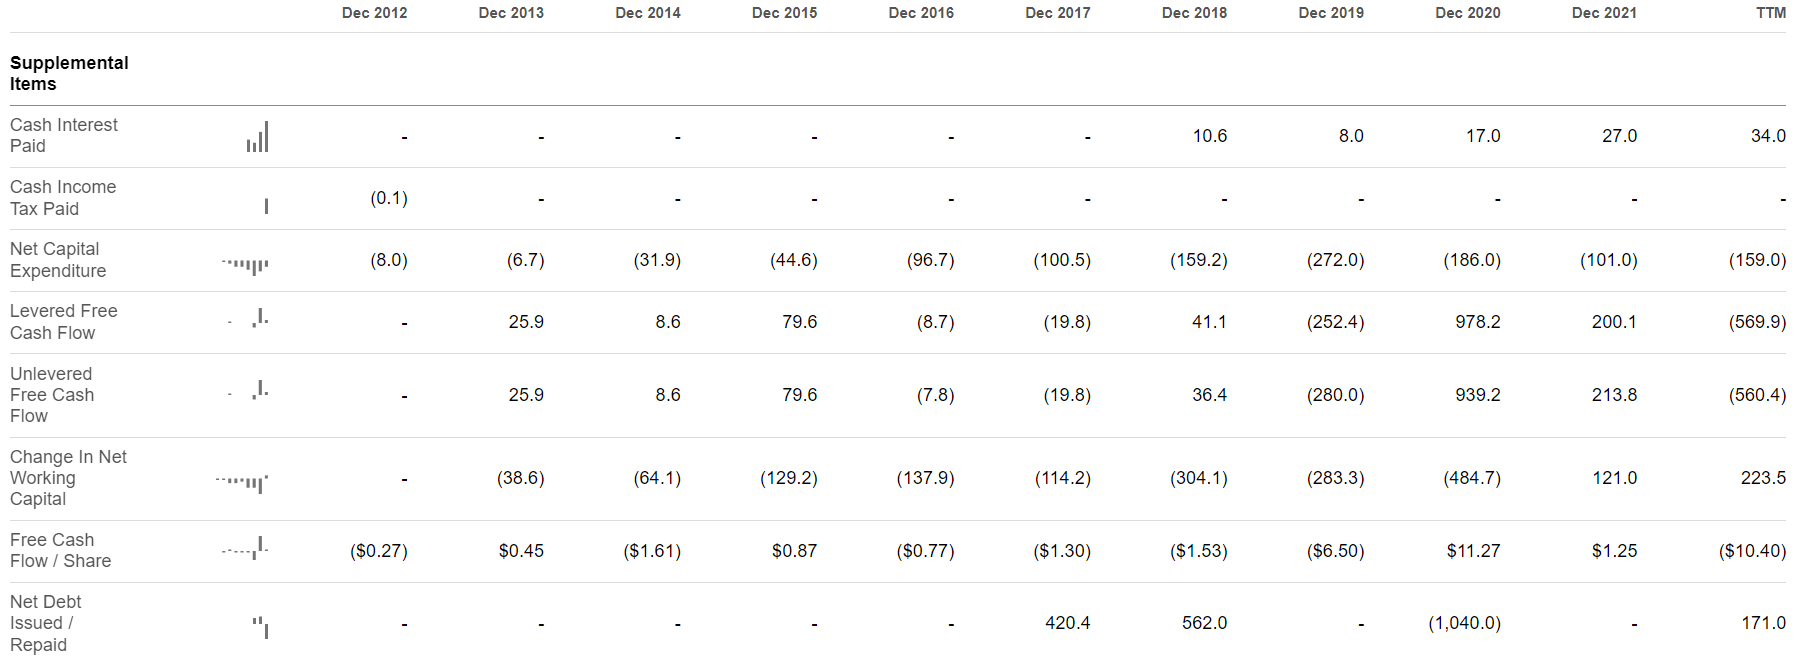
The free cash flow picture is perhaps not as bad as I was coming to expect, but reflects the trends that we have been seeing thus far. While generally posting free cash flows that were somewhat positive or barely negative, the variance here nets out to something close to 0 overall. Without the 2020 banner year this would be numerically much worse. Furthermore, the company has been bleeding cash TTM, with a free cash flow loss worse than anything that it has posted during a full fiscal year reporting period. This will likely get worse when it does post Q4 2022 and 10-K numbers. This situation is driven home by the largest cash flow per share loss that we have yet seen.
Overall things are not looking rosy for Wayfair from a fundamental perspective. While the business displayed remarkable performance during the pandemic, it is clear that this was not to last. Additionally the cash pressures it is facing are significant, and the operating picture and concomitant revenue decline indicate that they should continue. Ultimately, it is not fixed costs that are driving these cash losses for Wayfair.
This increasingly-negative picture is reinforced by two facts: Wayfair is losing active users and overall orders for its website. These numbers are quite stark YoY, with active customers down 22.6% and Wayfair delivering 20.9% fewer orders YoY.
Wayfair sells primarily furniture and other home goods. These items are considered durable goods, which are tracked by the government. The sales figures for these are generally less volatile than they would be for consumer discretionary goods, and the market has actually grown over the past year:
US Census Bureau 11.21.22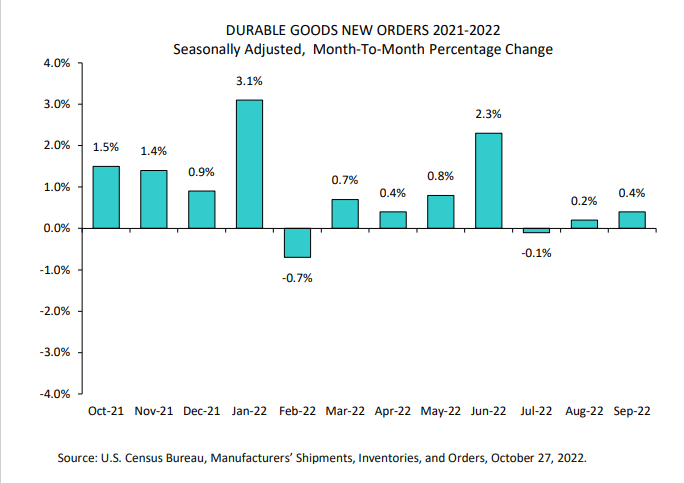
This market situation is significantly better than Wayfair’s performance on a percentage basis. Since it is tracking so much worse than the market for durable goods, the implication is a simple one: it is losing market share to the competition.
Conclusion
Wayfair appears to be in the early stages of decline. Decreasing revenues, cash pressures, and overall lose in market share form a definitively negative picture overall. It is difficult to think of exactly how this company will escape its current situation off-hand, and it is fair to expect a continuance of these trends. The counterpoint to this may be a better-than-expected holiday shopping season, but that will not bring this company back from where it is clearly headed. I agree with recent Wall Street sentiment calling this stock a sell.
Be the first to comment