

pidjoe
Investment Quiz with a Perfectly Clear Crystal Ball
It’s been my experience that most investors believe that the major purpose of investment research on individual stocks is to determine which companies will be the ones providing superior financial results. With that in mind, here’s a quiz for you.
It’s June 30, 1963, and you are given a perfectly clear crystal ball that can reveal the return on assets (ROA) and return on equity (ROE) of two investments, A and B, over the following 60 years (through June 30, 2022). Asset A’s ROE will average 9.7 percent per year. The ROE of B will average 25.7 percent per year, more than 2.6 times as great as that of A’s. Asset A’s ROA will average 4 percent per year. The ROA of asset B will average 11 percent per year, almost three times that of A’s. With the 100 percent certainty of that information, you must choose which asset you will purchase-A or B, with its far superior financial performance. Before reading on, make your choice.
Did You Choose A or B?
If you chose B, it is likely because you have confidence that since these are going to be great-performing companies, they will make great investments. In fact, it’s easy to identify these great companies in advance without doing any research-the market, in its collective wisdom, has done it for you. You can simply buy an index of growth stocks, those with high prices to such metrics as earnings, book value or cash flow.
On the other hand, if you chose A, it’s likely because you understand that if the market believes a group of companies will produce superior financial results, the market must also believe they are relatively safe investments. With this knowledge, investors (the market, in its collective wisdom) will already have bid up the price of those stocks to reflect those great expectations and the low level of perceived risk. While these companies are likely to produce great financial results, their stocks are likely to produce relatively lower returns. In other words, you understand the most basic tenet of finance, which is that risk and expected return should be related. Thus, you chose B because you believe it is likely the market will reward you for taking the incremental risk of owning the companies with weaker financial performance. We can identify those companies by their low prices to those same metrics of earnings, book value and cash flow. That allows you to buy an index of value stocks.
The following two charts provide the historical data on the ROE and ROA of U.S. growth and value stocks:
Historical ROE and ROA of growth and value companies (Dimensional Fund Advisors)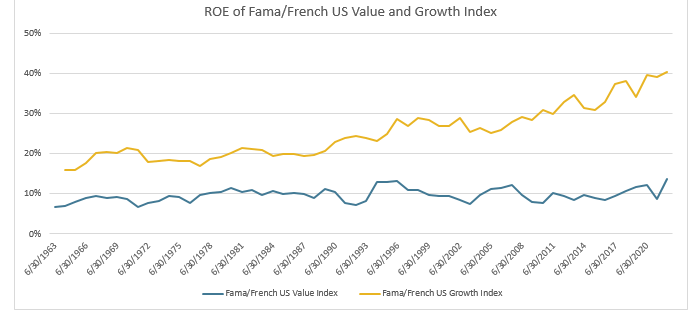
Indices are not available for direct investment. Their performance does not reflect the expenses associated with the management of an actual portfolio nor do indices represent results of actual trading. Information from sources deemed reliable, but its accuracy cannot be guaranteed. Performance is historical and does not guarantee future results. Total return includes reinvestment of dividends and capital gains.
Now let’s look at the returns to investors owning assets A and B. Over the 60-year period ending June 30, 2022, the Fama-French U.S. Growth Index returned 10.1 percent, underperforming the return 13.2 percent return of the Fama-French U.S. Value Index by 3.1 percentage points per annum. And this occurred despite the fact that the gaps between the ROE and ROA of growth stocks relative to those of value stocks widened somewhat over the period.
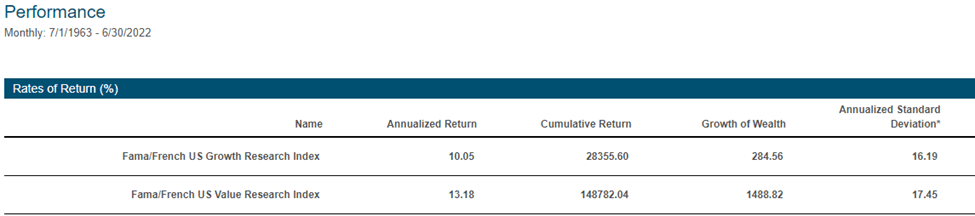
Performance of US Value vs Growth Stocks (Ken French Library)
Why Great Earnings Don’t Necessarily Translate into Great Investment Returns
The simple explanation for this seeming anomaly (that companies with superior financial performance provided lower returns) is that investors discounted the future expected earnings of the riskier value stocks at a higher rate than they discounted the future expected earnings of the safer growth stocks-markets price for risk, and the price you pay for superior expected financial performance matters. The higher discount rate applied to the expected earnings of value stocks more than offset the superior financial performance of the growth stocks-the high discount rate applied to value stocks resulted in their lower valuations and thus their higher expected future returns relative to growth stocks.
Relative Valuations
We can examine the relative valuations of growth and value stocks by comparing the P/E ratios of Vanguard’s value and growth index funds. Using Morningstar’s portfolio information, as of July 30, 2022, the P/E of Vanguard’s Growth Index Fund (VIGAX) was 25.5, 1.88 times that of the 13.6 P/E of Vanguard’s Value Index Fund (VVIAX). Looking at small stocks, the P/E of Vanguard’s Small-Cap Growth Index Fund (VSGIX) was 21.4, more than twice that of the 10.5 P/E of Vanguard’s Small-Cap Value Index Fund (VSIAX).
In case you are wondering how the spreads between the valuations of growth and value stocks compare to the historical average spread, thanks to AQR Capital Management, we see that in August 2022, the spread was at the 98th percentile globally. Since the spread has been positively correlated with the future value premium, value investors should expect a higher than historical value premium going forward.
Historical Value Spread (AQR Capital Management)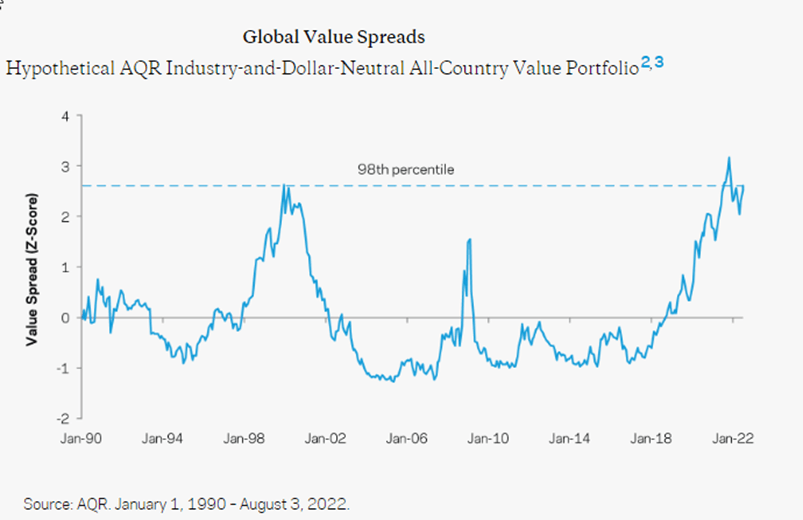
Investor Takeaway
There is a simple principle to remember that can help you avoid making poor investment decisions. Risk and expected return should be positively related. Value stocks have provided a premium return over growth stocks for a logical reason-they are the stocks of riskier companies. That is why their stock prices are relatively distressed. Investors refuse to buy them unless the prices are driven low enough so that they can expect to earn a rate of return that is high enough to compensate them for investing in riskier companies. Note that this is the traditional finance view. The field of behavioral finance offers alternative theories, though with the same end result-value stocks outperform.
Behavioralists believe that investors naively extrapolate past growth when evaluating a company and thus overreact to that information, resulting in a situation where growth companies are persistently overpriced and value companies are persistently underpriced. Behavioralists also find that investors confuse familiarity with safety. Because they tend to be more familiar with popular growth stocks, those stocks tend to be overvalued. They also believe that investors have a preference for stocks with lottery-like distributions (poor average returns but a small chance of spectacular returns), and these tend to be growth stocks, though with high investment and poor profitability. That preference leads them to overpay for growth companies.
The bottom line is that if prices are high, they either reflect low perceived risk or a preference for “lottery tickets.” Either way, you should expect lower future returns and vice versa.
Larry Swedroe is chief research officer of Buckingham Wealth Partners
For informational and educational purposes only and should not be construed as specific investment, accounting, legal, or tax advice. Certain information is based upon third party data which may become outdated or otherwise superseded without notice. Third party information is deemed to be reliable, but its accuracy and completeness cannot be guaranteed. The securities mentioned are to show the difference in P/E ratios and should not be construed as a specific recommendation of the security. By clicking on any of the links above, you acknowledge that they are solely for your convenience, and do not necessarily imply any affiliations, sponsorships, endorsements or representations whatsoever by us regarding third-party websites. We are not responsible for the content, availability or privacy policies of these sites, and shall not be responsible or liable for any information, opinions, advice, products or services available on or through them. The opinions expressed by featured authors are their own and may not accurately reflect those of Buckingham Strategic Wealth® or Buckingham Strategic Partners®, collectively Buckingham Wealth Partners. Neither the Securities and Exchange Commission (SEC) nor any other federal or state agency have approved, determined the accuracy, or confirmed the adequacy of this article. LSR-22-383
Be the first to comment