

andresr
Helping recommend the best blue-chips for retirees isn’t that hard.
After all, maximizing safe yield is the primary thing retirees want and need, since they are primarily focused on living off safe and dependable income.
But what about younger investors, including Millennials, investors between the ages of 26 and 41? They have decades to go until retirement.
And as this bear market shows, momentum investing is hardly a guarantee of success, just consider the cautionary tale of the ARK Innovation ETF (ARKK).
YCharts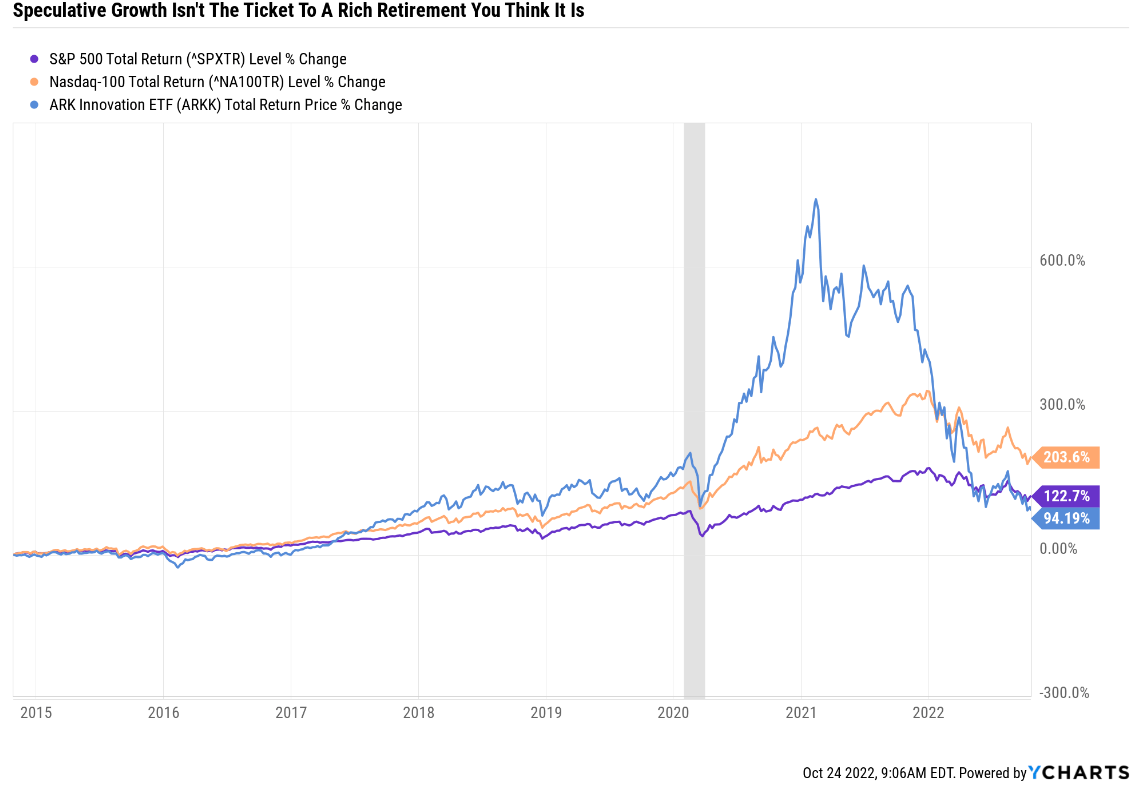
ARKK at its peak, thanks to its love of speculative growth and a crazy Pandemic bubble, was outperforming the S&P by 700% since inception.
But bubbles don’t last forever and after an 80% crash, ARKK is now underperforming the S&P by almost 30% and the Nasdaq by 105%.
Ben Carlson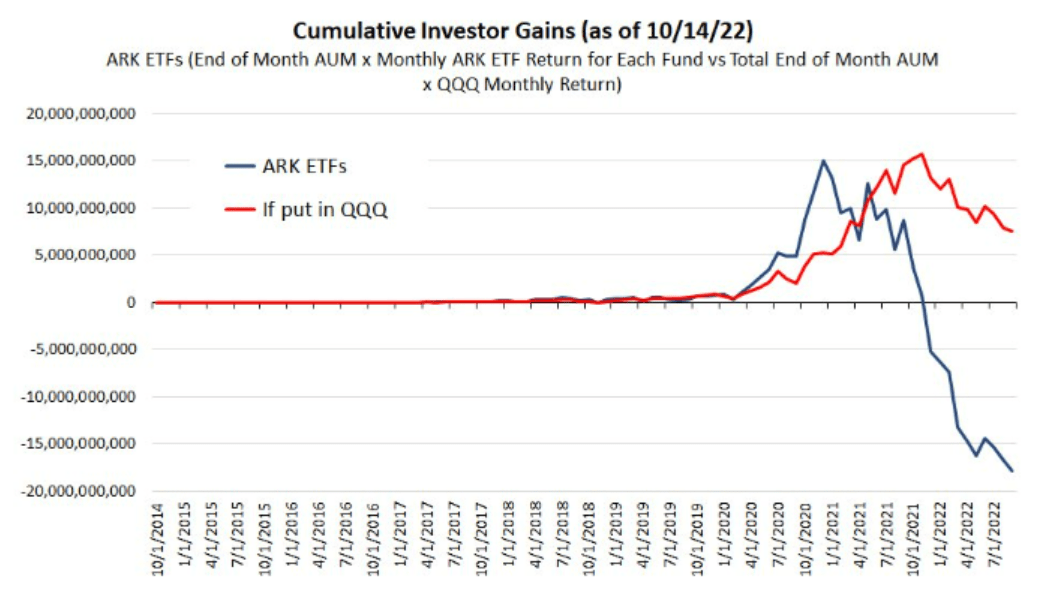
In fact, since most investors bought ARKK near its peak, the cumulative investor losses on ARKK are approaching $20 billion.
- potentially the worst cumulative investor return in the history of mutual or index funds
So avoid speculative manias then? Sure, that’s prudent advice. Don’t pay crazy prices for non-profitable growth stocks trading at insane valuations that might end up going to zero (like Peloton).
But here’s something that all young investors need to know. It’s something that’s shocking, but could help you retire rich, on an ocean of dividends.
Why Young Investors Should Own High-Yield Blue-Chips
It’s easy to recommend hyper-growth blue-chips like Amazon (AMZN), and many younger investors think that’s the only thing they should own.
It’s easy to recommend ultra-yield blue-chips like Altria (MO), and many retirees think that’s the only thing they should own.
But do you know the secret to maximizing safe long-term retirement income?
Combining hyper-growth with ultra-yield.
Altria + Amazon Since 2008: The Power Of Yield + Growth
(Source: Portfolio Visualizer Premium)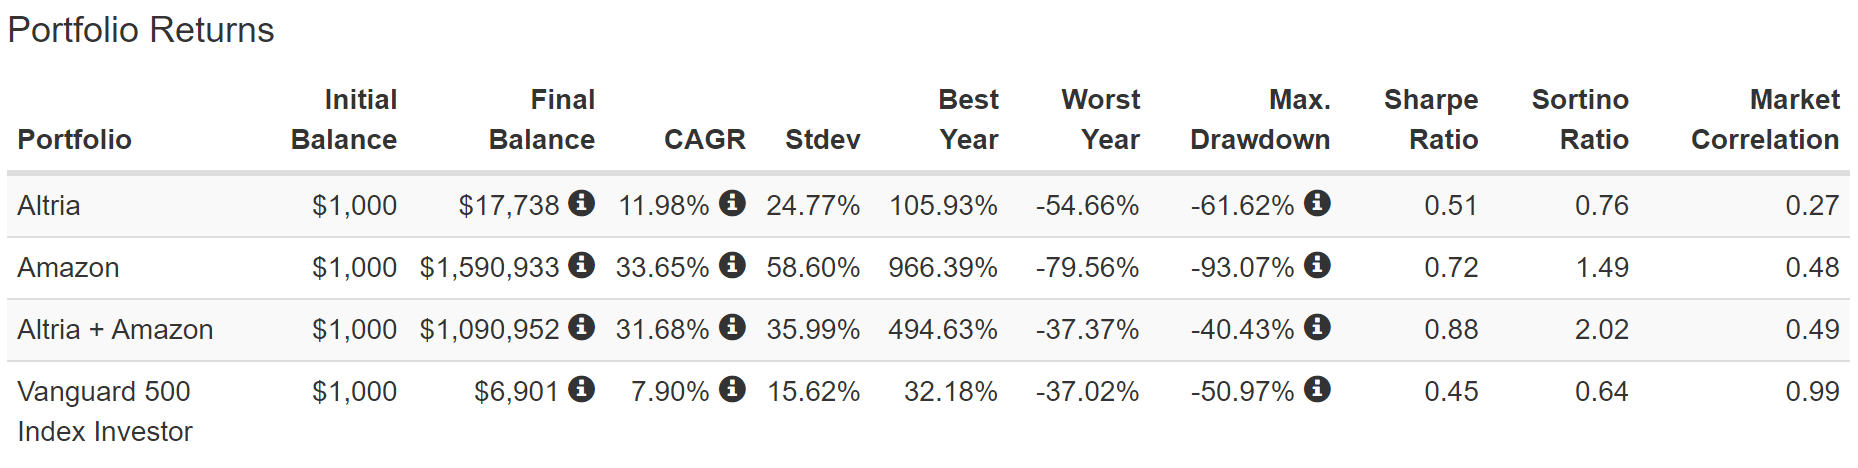
MO is one of the best dividend stocks in history and Amazon one of the greatest investments of all time. It should come as no shock that combining both in equal amounts with annual rebalancing would have made you rich.
(Source: Portfolio Visualizer Premium)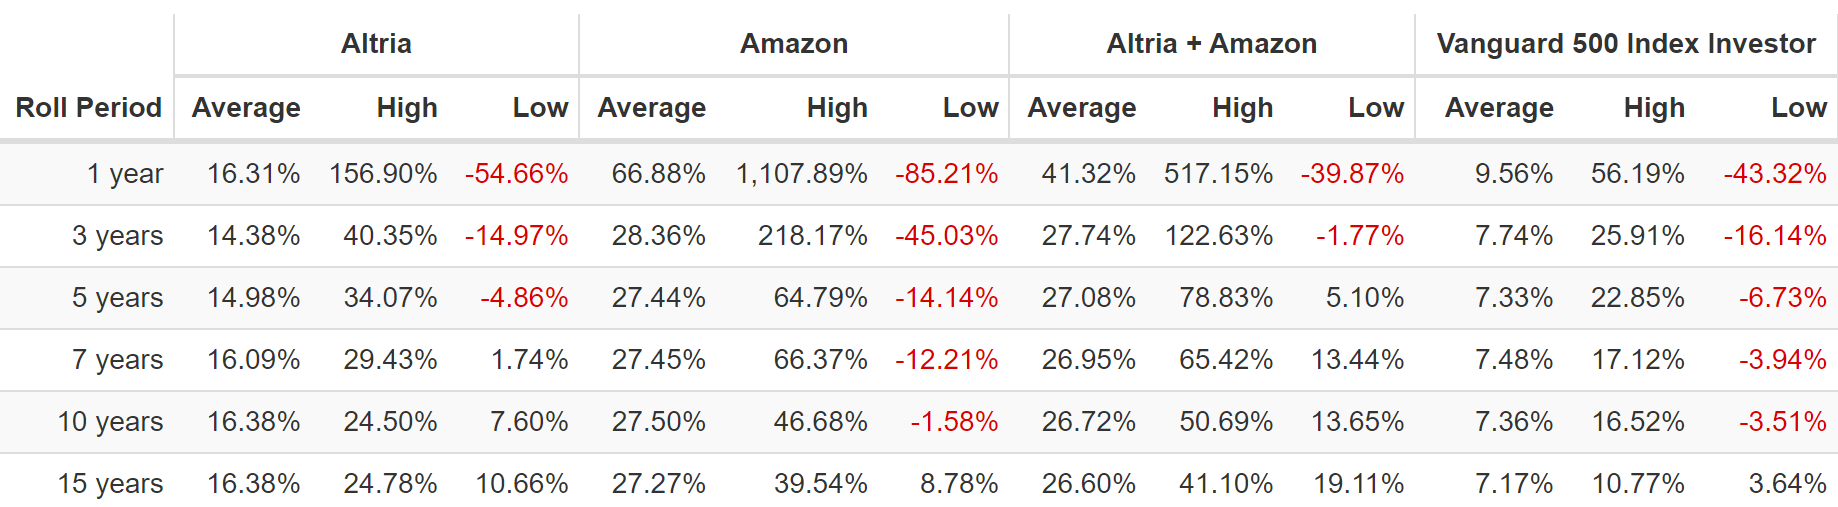
It might be a bit surprising, given MO’s recent bear market, to learn that AMZN + MO together delivered average 15-year annualized returns of 26.6%, nearly identical to Amazon alone.
But here is what is truly mind-blowing, and the key to retiring in safety and splendor.
(Source: Portfolio Visualizer Premium)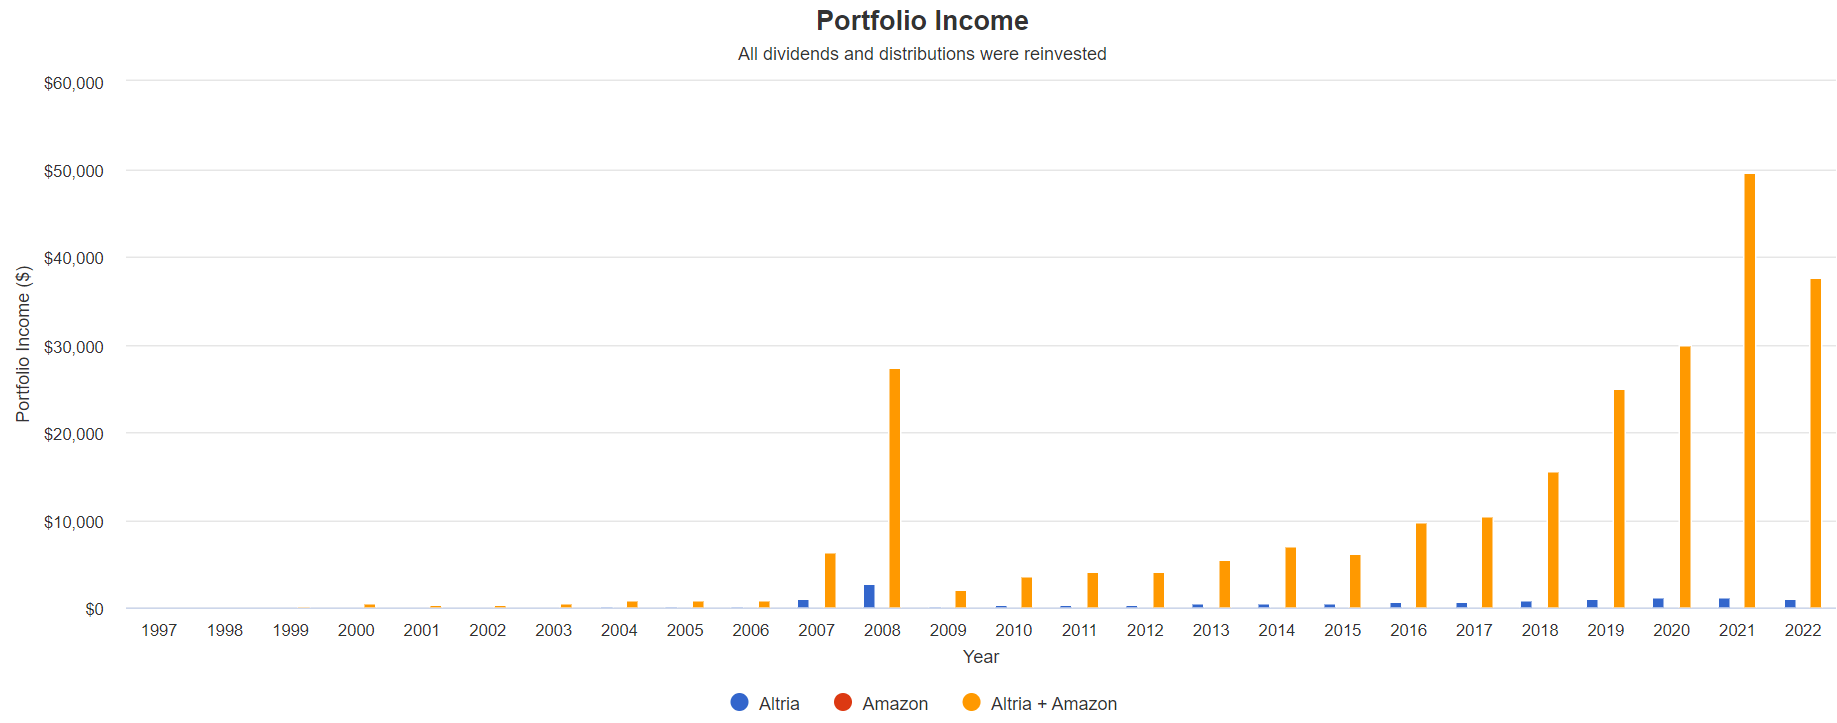
Altria is one of the greatest income growers in history and yet compared to MO + AMZN you can barely see it on the chart.
Cumulative Dividends Since 1998 Per $1,000
| Metric | Altria |
Altria + Amazon |
| Total Dividends | $14,193 | $261,479 |
| Total Inflation-Adjusted Dividends | $7,755.74 | $142,884.70 |
| Annualized Income Growth Rate | 16.0% | 34.3% |
| Total Income/Initial Investment % | 14.19 | 261.48 |
| Inflation-Adjusted Income/Initial Investment % | 7.76 | 142.88 |
| More Inflation-Adjusted Income Than Altria | NA | 18.42 |
| Starting Yield | 4.0% | 4.2% |
| Today’s Annual Dividend Return On Your Starting Investment (Yield On Cost) | 139.9% | 5005.7% |
| 2022 Inflation-Adjusted Annual Dividend Return On Your Starting Investment (Inflation-Adjusted Yield On Cost) | 76.4% | 2735.4% |
(Source: Portfolio Visualizer Premium)
MO + AMZN together generated 18.4X more inflation-adjusted dividends than MO alone, including sensational 34% annual income growth over the last 24 years.
- 143X your initial investment in inflation-adjusted dividends
That’s faster income growth then Amazon’s annual returns! How is that possible? Annual rebalancing during MO’s many severe bear markets created three levels of income compounding.
- MO has been growing its dividend exponentially over time
- those dividends get reinvested into exponentially more shares over time (works fastest in bear markets)
- AMZN hyper-growth gets converted into exponentially more MO shares
Owning just high-yield blue-chips gets you two levels of compounding, combining ultra-yield and hyper-growth gets you a third level of compounding and that’s how you can achieve life-changing income and an inflation-adjusted yield on cost of 2,735% after a quarter century.
- every $1 invested in MO and AMZN in mid 1997 is now paying $27.35 in inflation-adjusted dividends and growing exponentially
Now obviously AMZN and MO are the most extreme example of how yield + growth is superior for maximizing long-term safe retirement income than either strategy alone.
But it’s why I recommend a bar-bell approach to most investors, of the best ultra-yielders and hyper-growth blue-chip bargains.
So now let me show you how younger investors can find the best blue-chip bargains to help them meet their retirement goals today.
How To Find The 10 Best Blue-Chips For Millennials… In 3 Minutes
Let me show you how to screen the Dividend Kings Zen Research Terminal, which runs of the DK 500 Master List, to easily find the best high-yield Ultra SWANs (sleep well at night) blue-chips for retirees.
The Dividend Kings 500 Master List includes some of the world’s best companies, including:
- every dividend champion (25+ year dividend growth streaks, including foreign aristocrats)
- every dividend aristocrat
- every dividend king (50+ year dividend growth streaks)
- every Ultra SWAN (as close to perfect quality companies as exist)
- the 20% highest quality REITs according to iREIT
- 40 of the world’s best growth blue-chips
The Best Hyper-Growth Blue-Chips Millennials Should Buy
| Step | Screening Criteria | Companies Remaining | % Of Master List |
| 1 | Reasonable Buy, Good Buy, Strong Buy, Very Strong Buy, Ultra Value Buy (Never Overpay For Stocks) | 394 | 78.17% |
| 2 | Quality Score 10+ (Blue-Chip Or Better) | 347 | 68.85% |
| 3 | Investment Grade Credit Rating (To Minimize Speculative Companies) | 260 | 51.59% |
| 4 | Long-Term Return Potential 15+% | 63 | 12.50% |
| 5 |
Add Long-Term Return Potential Column |
0.00% | |
| 6 |
Sort By Long-Term Return Potential |
||
| 7 | Choose The Top 5 Hyper-Growth Blue-Chips Whose Return Potentials You Consider Believable | 5 | 0.99% |
| 8 |
Use Watchlist Creation Tool To Select Those Top 5 Hyper-Growth Blue-Chips |
||
| Total Time | 2 minutes |
Now here’s the screen for the ultra-yielding blue-chips Millennials should buy.
The Best Ultra-Yield Very Safe Blue-Chips Millennials Should Buy
| Step | Screening Criteria | Companies Remaining | % Of Master List |
| 1 | Reasonable Buy, Good Buy, Strong Buy, Very Strong Buy, Ultra Value Buy (Never Overpay For Stocks) | 394 | 78.17% |
| 2 | Quality Score 10+ (Blue-Chip Or Better) | 347 | 68.85% |
| 3 | Investment Grade Credit Rating (To Minimize Speculative Companies) | 260 | 51.59% |
| 4 | 6+% Ultra-yield | 25 | 4.96% |
| 5 | 81+% Safety Score (Very Safe, 2% or less severe recession cut risk) | 16 | 3.17% |
| 6 | 10+% long-term return potential | 14 | 2.78% |
| 7 | Sort By Yield | ||
| 8 | Using The Watchlist Builder Select The Top 5 Yielding Blue-Chips And Combine Them With The Top 5 Hyper-Growth Blue-Chips | 5 | 0.99% |
| Total Time | 4 minutes |
In just four minutes we found 10 amazing world-beater blue-chips that combine the best very safe ultra-yield with the best investment-grade hyper-growth.
- Sorry Cathie Wood, no speculative growth for us
And here they are.
10 Incredible Blue-Chips All Millennials Should Buy
I’ve linked to articles highlighting each company’s investment thesis, growth outlook, and risk profile.
(Source: Dividend Kings Zen Research Terminal)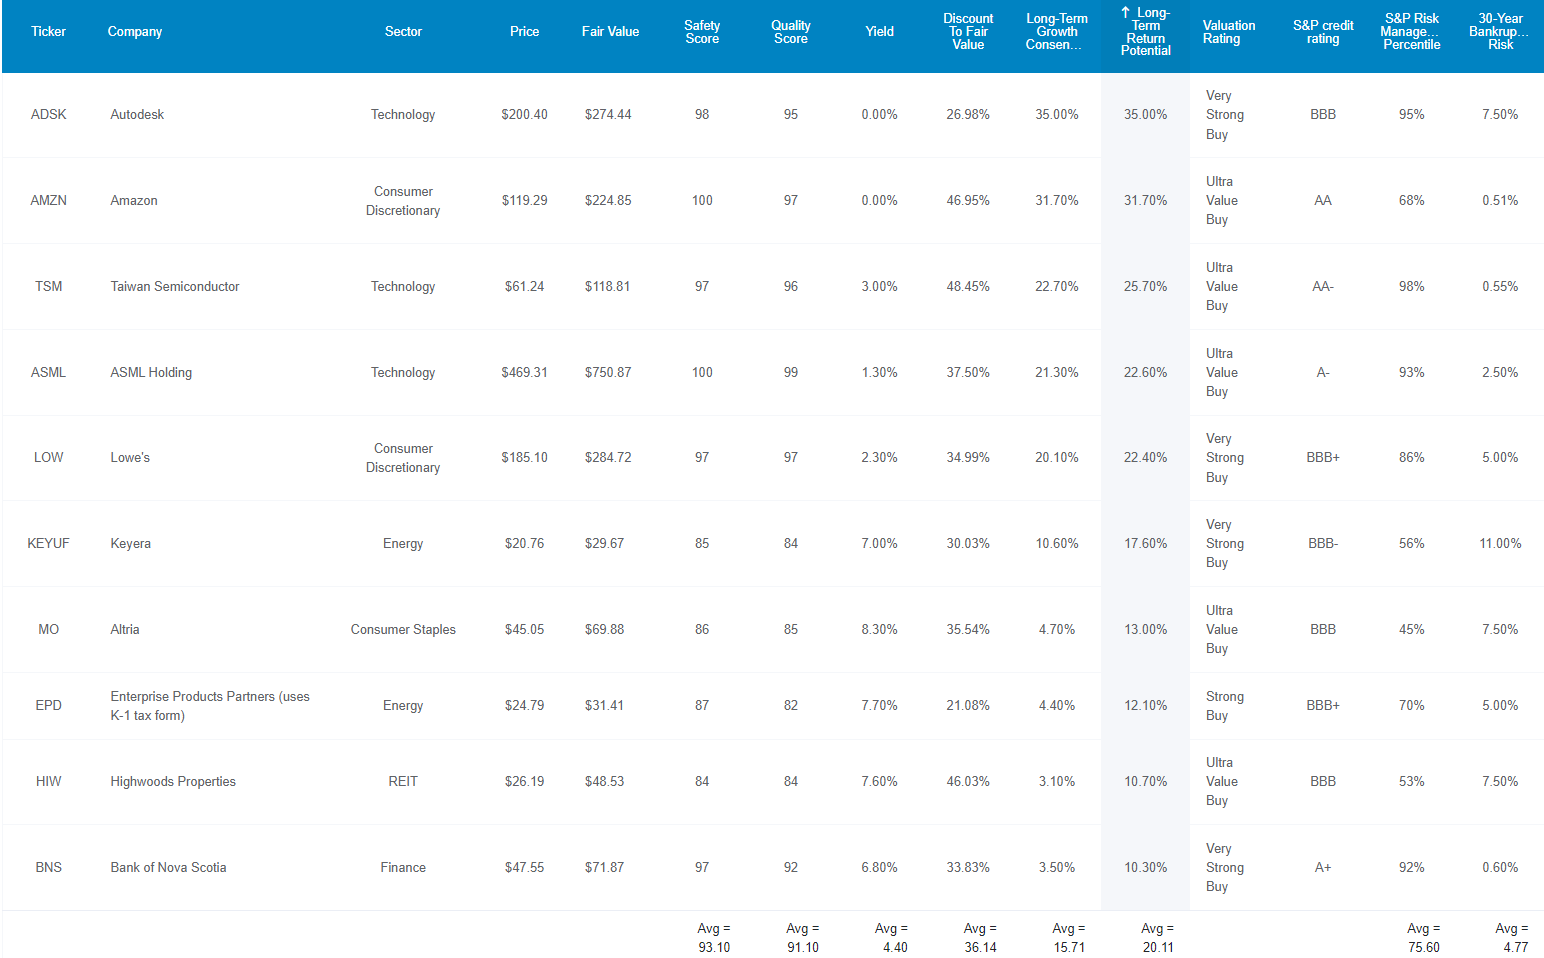
Here they are in order of highest to lowest long-term return potential according to the FactSet consensus.
Tax Implications
- KEYUF and BNS are Canadian companies
- 15% dividend tax withholding in TAXABLE ACCOUNTS ONLY
- no withholding in retirement accounts
- tax credit available in taxable accounts to recoup the withholding
- own in retirement accounts to avoid dividend withholding and minimize paperwork
- TSM is a Taiwanese company
- 20% withholding
- own in taxable account to qualify for the tax credit and recoup the withholding
- ASML is a Dutch Company
- 15% dividend withholding
- own in taxable account to qualify for the tax credit and recoup the withholding
FAST Graphs Up Front
Autodesk 2024 Consensus Return Potential
(Source: FAST Graphs, FactSet)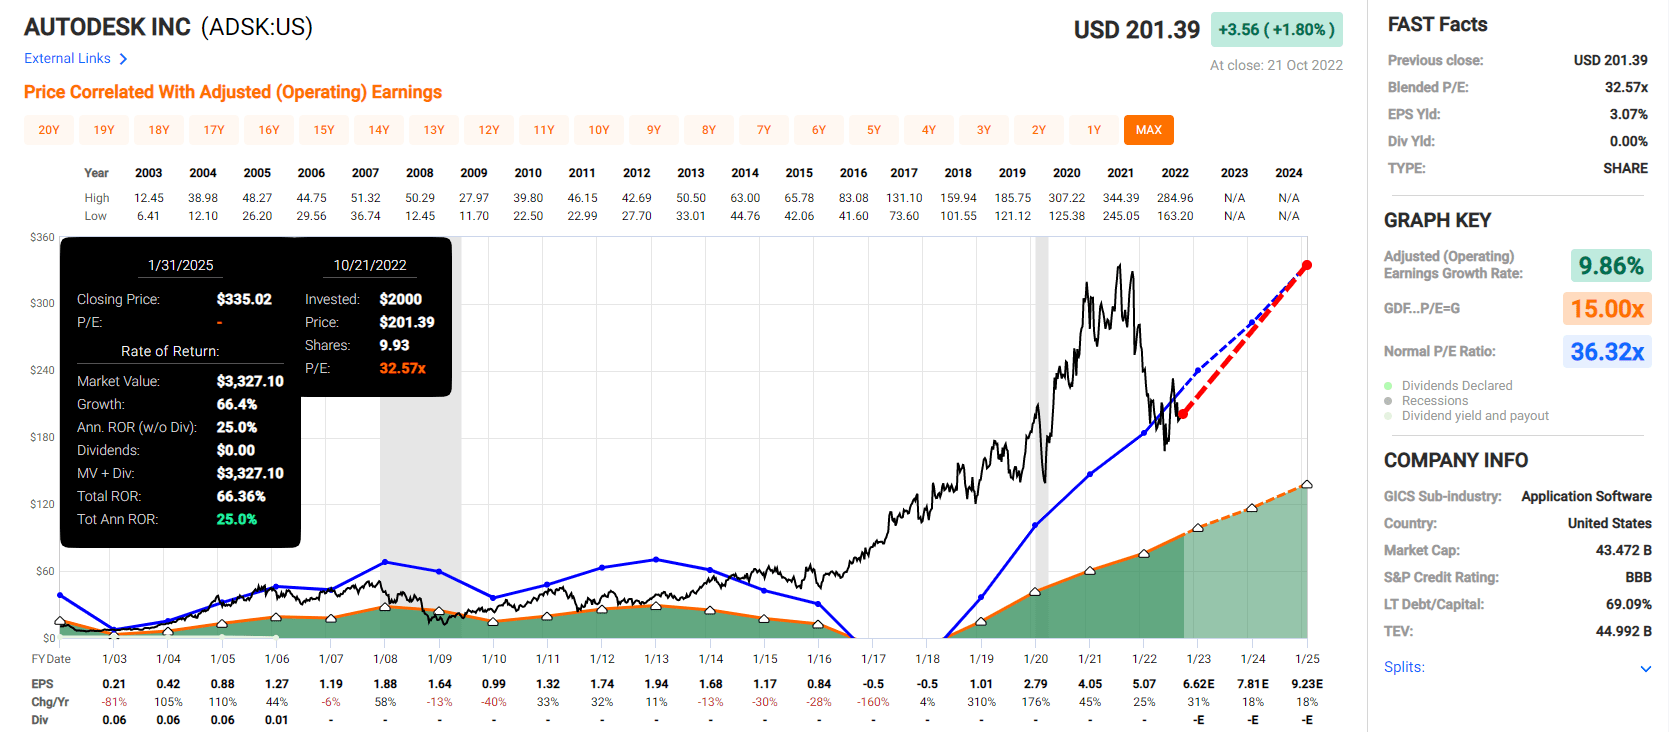
Amazon 2024 Consensus Return Potential
(Source: FAST Graphs, FactSet)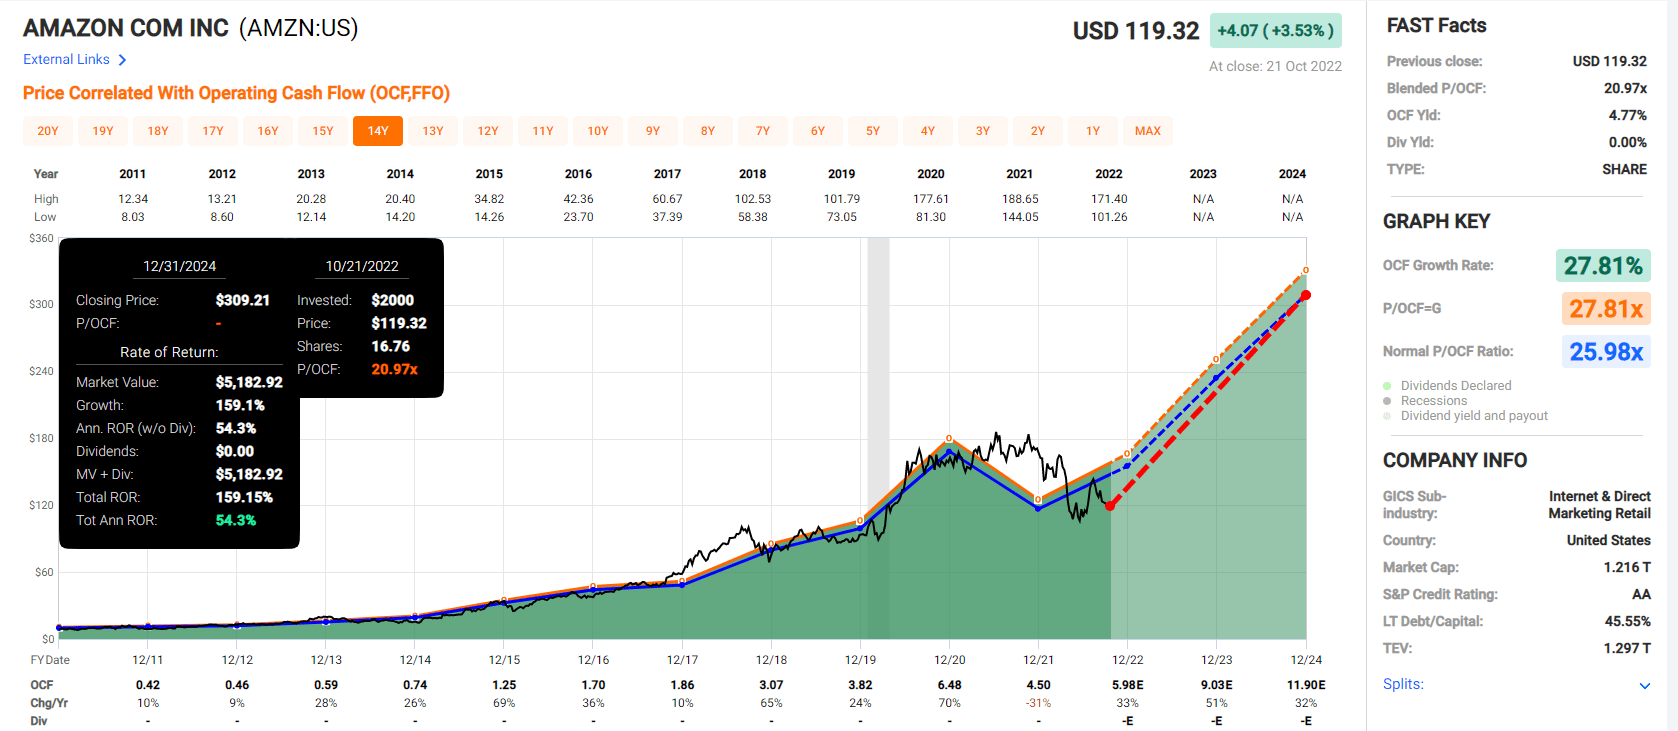
Taiwan Semiconductor 2024 Consensus Return Potential
(Source: FAST Graphs, FactSet)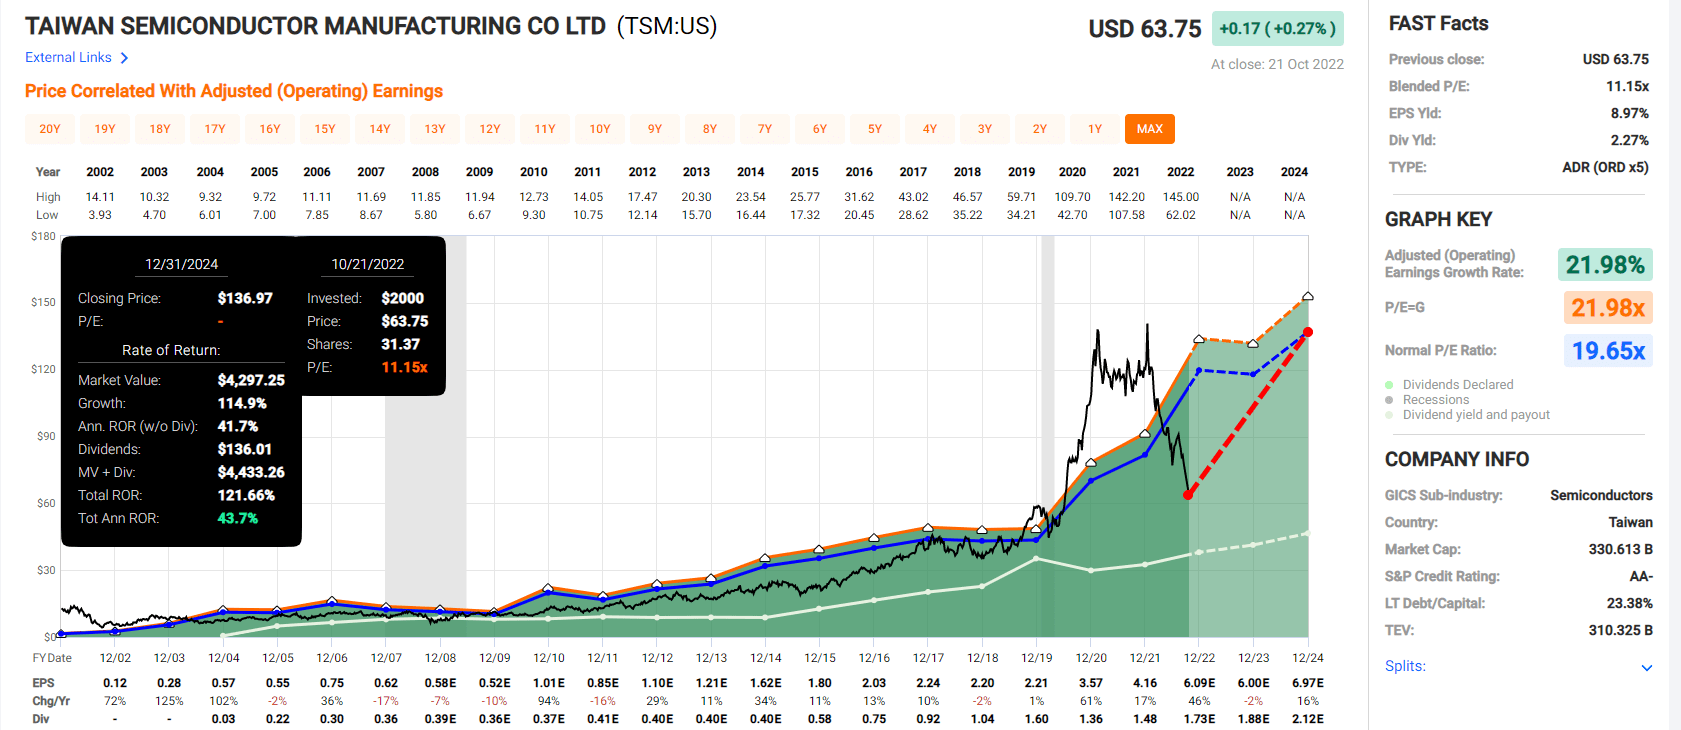
ASML 2024 Consensus Return Potential
(Source: FAST Graphs, FactSet)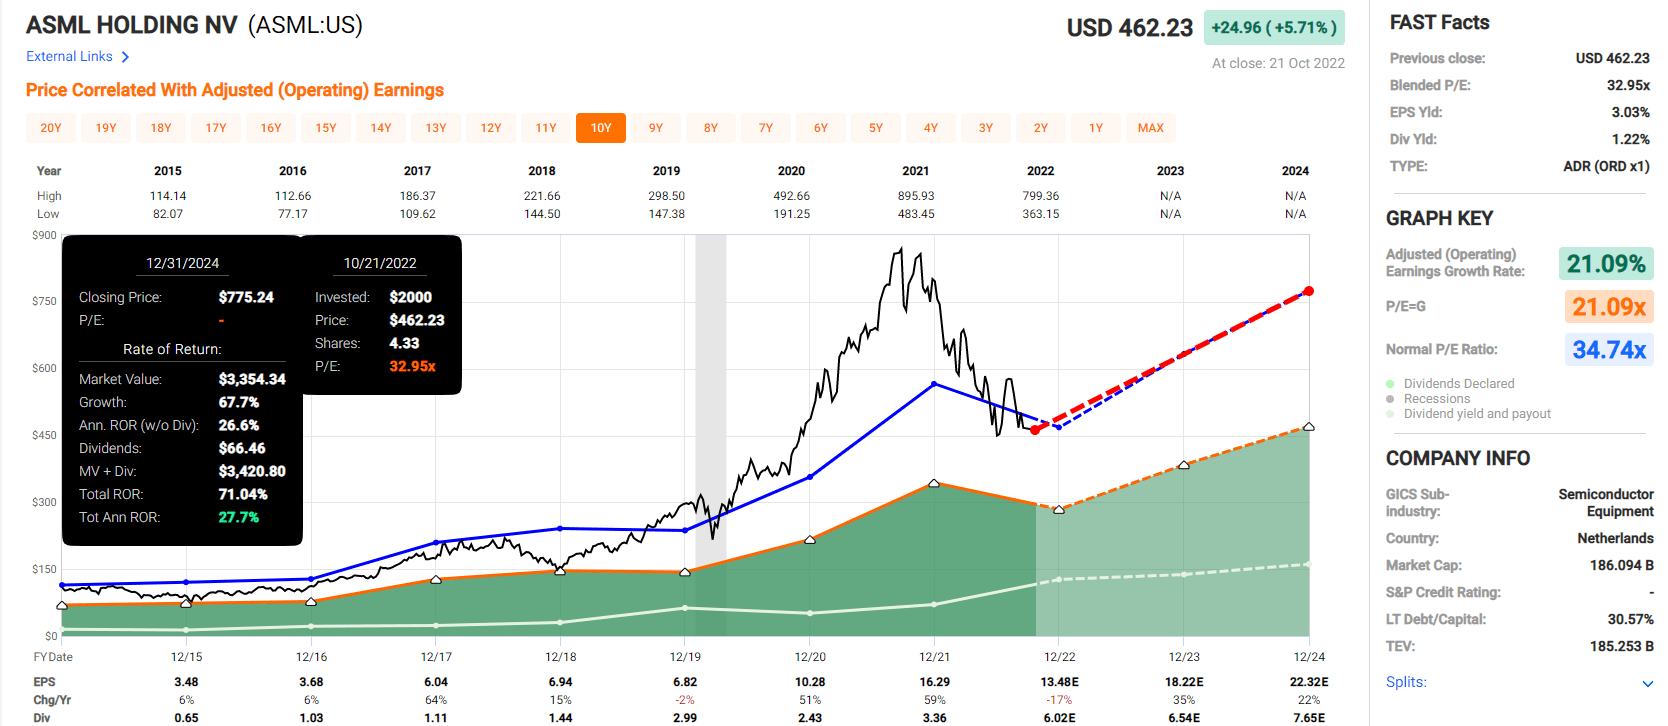
Lowe’s 2024 Consensus Return Potential
(Source: FAST Graphs, FactSet)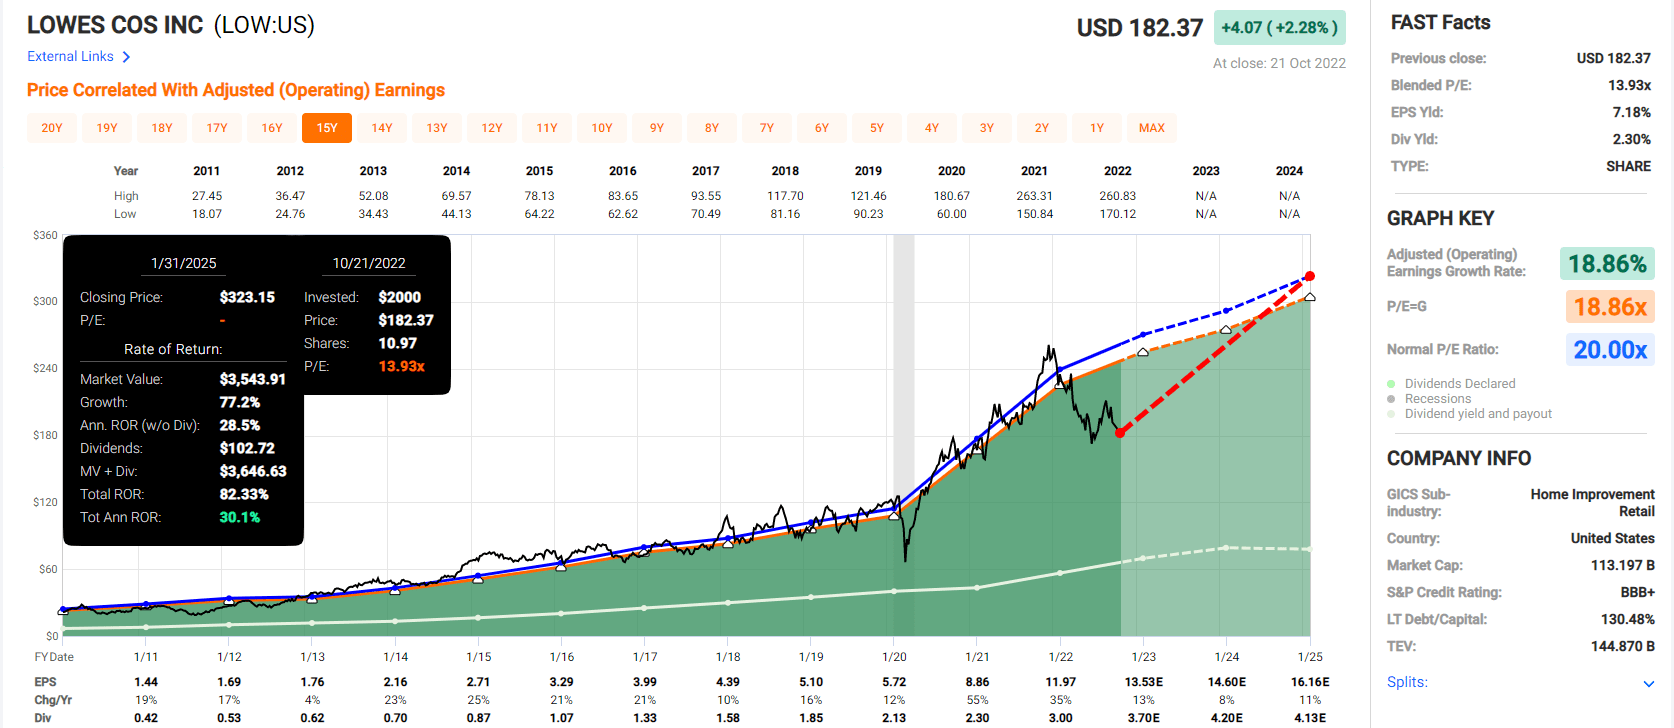
Altria 2024 Consensus Return Potential
(Source: FAST Graphs, FactSet)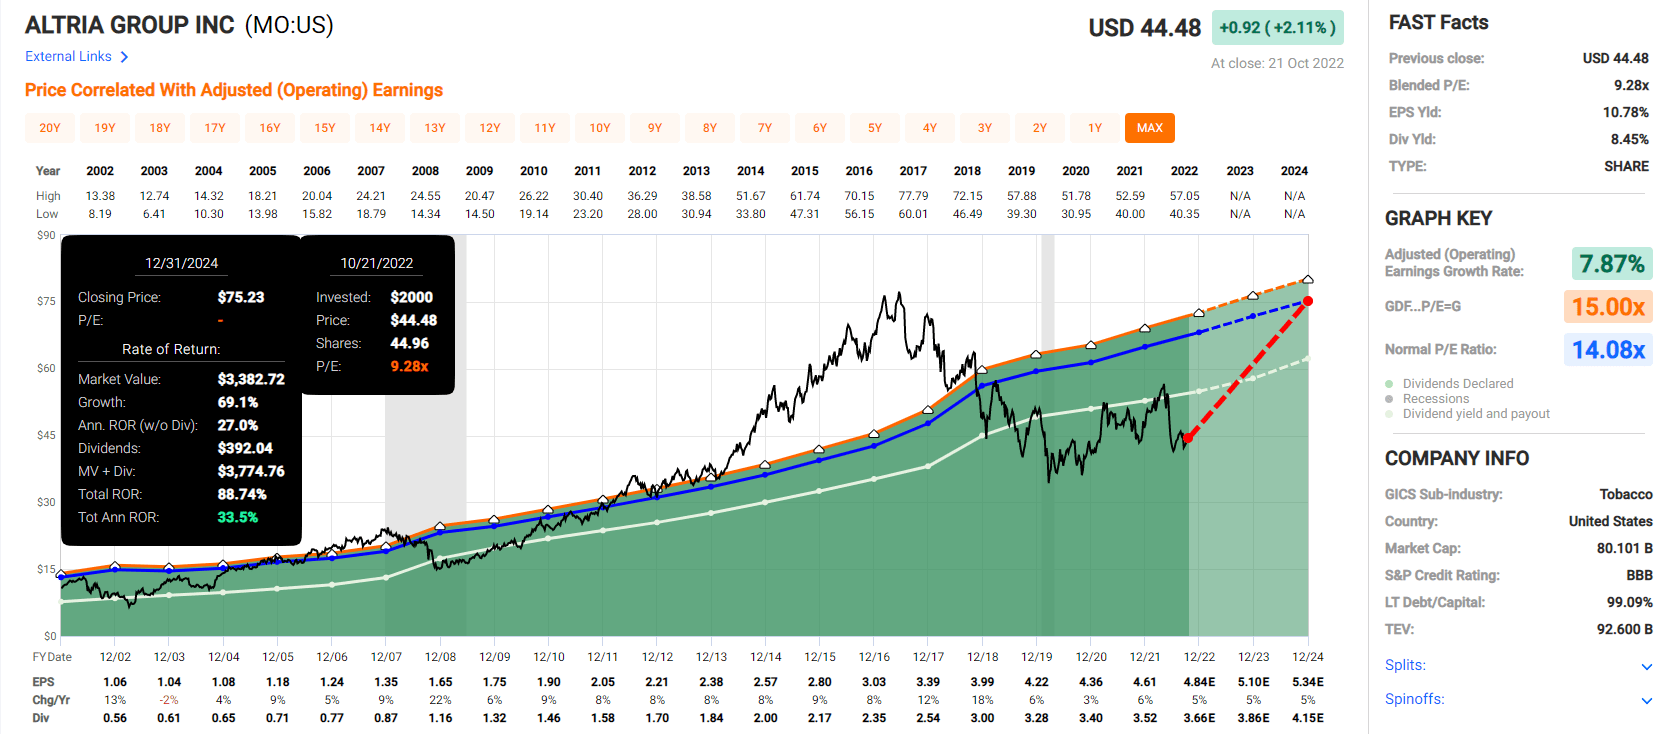
Enterprise 2024 Consensus Return Potential
(Source: FAST Graphs, FactSet)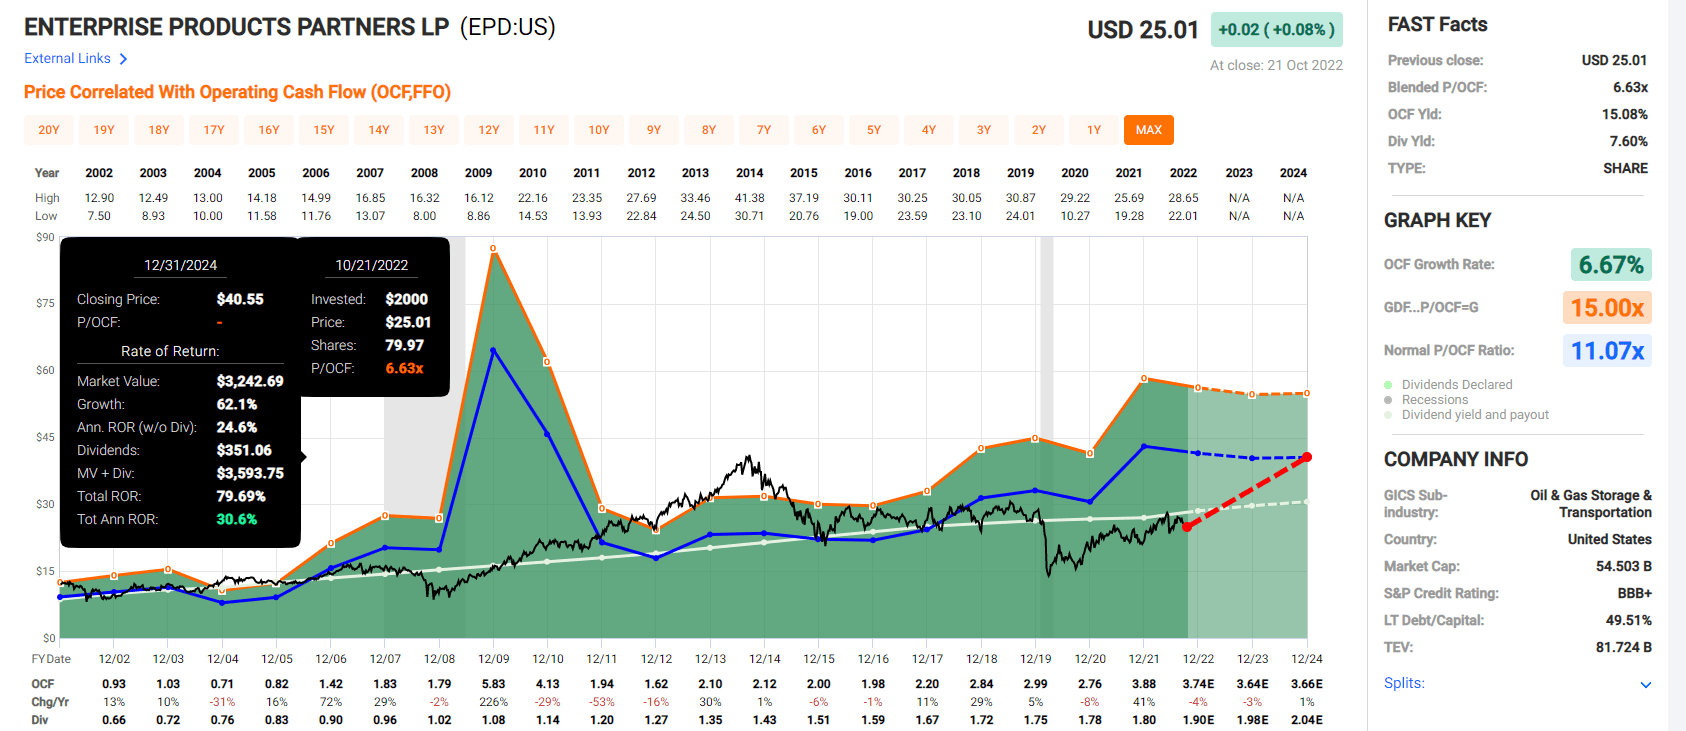
Highwoods 2024 Consensus Return Potential
(Source: FAST Graphs, FactSet)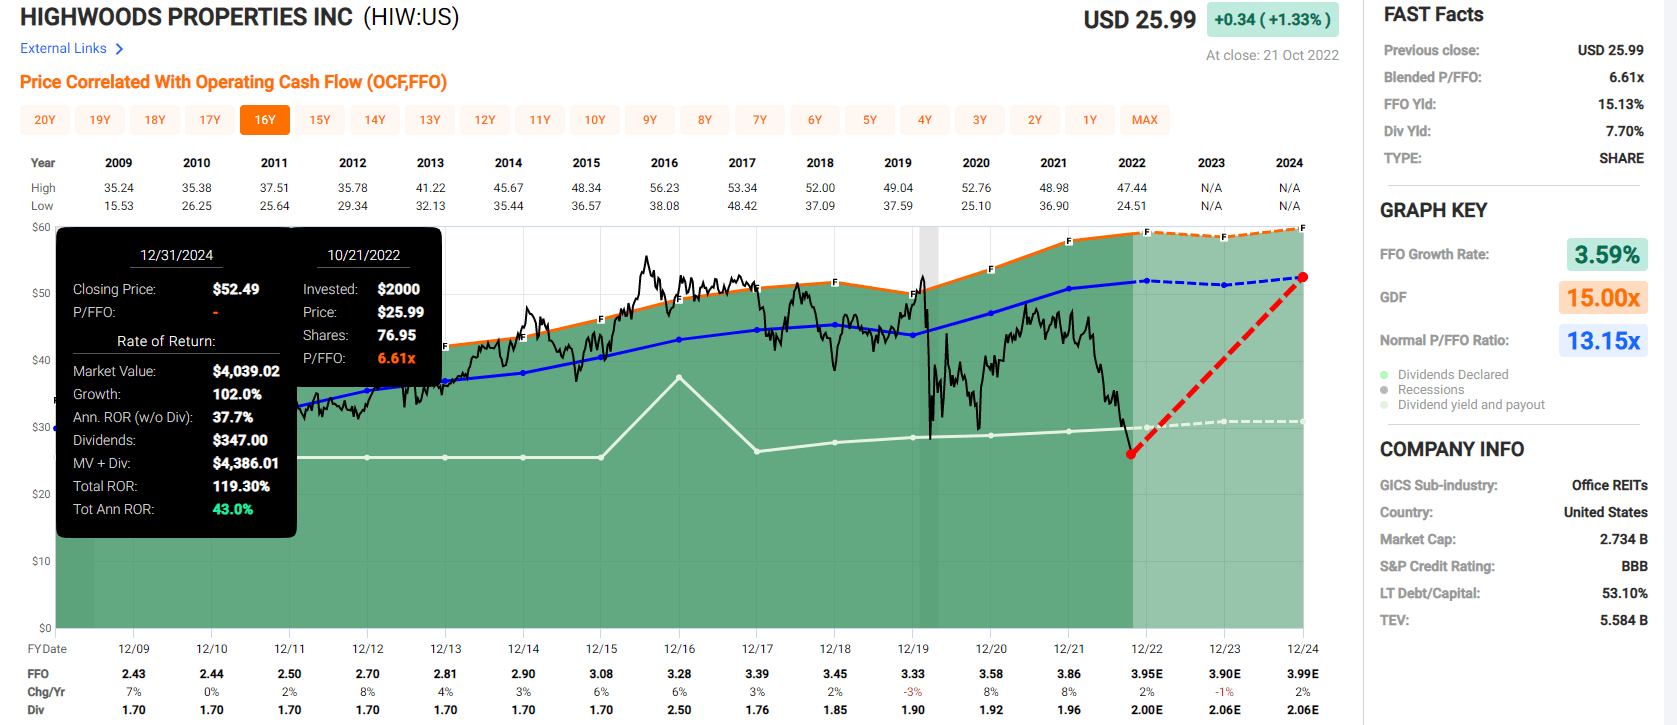
Keyera 2024 Consensus Return Potential
(Source: FAST Graphs, FactSet)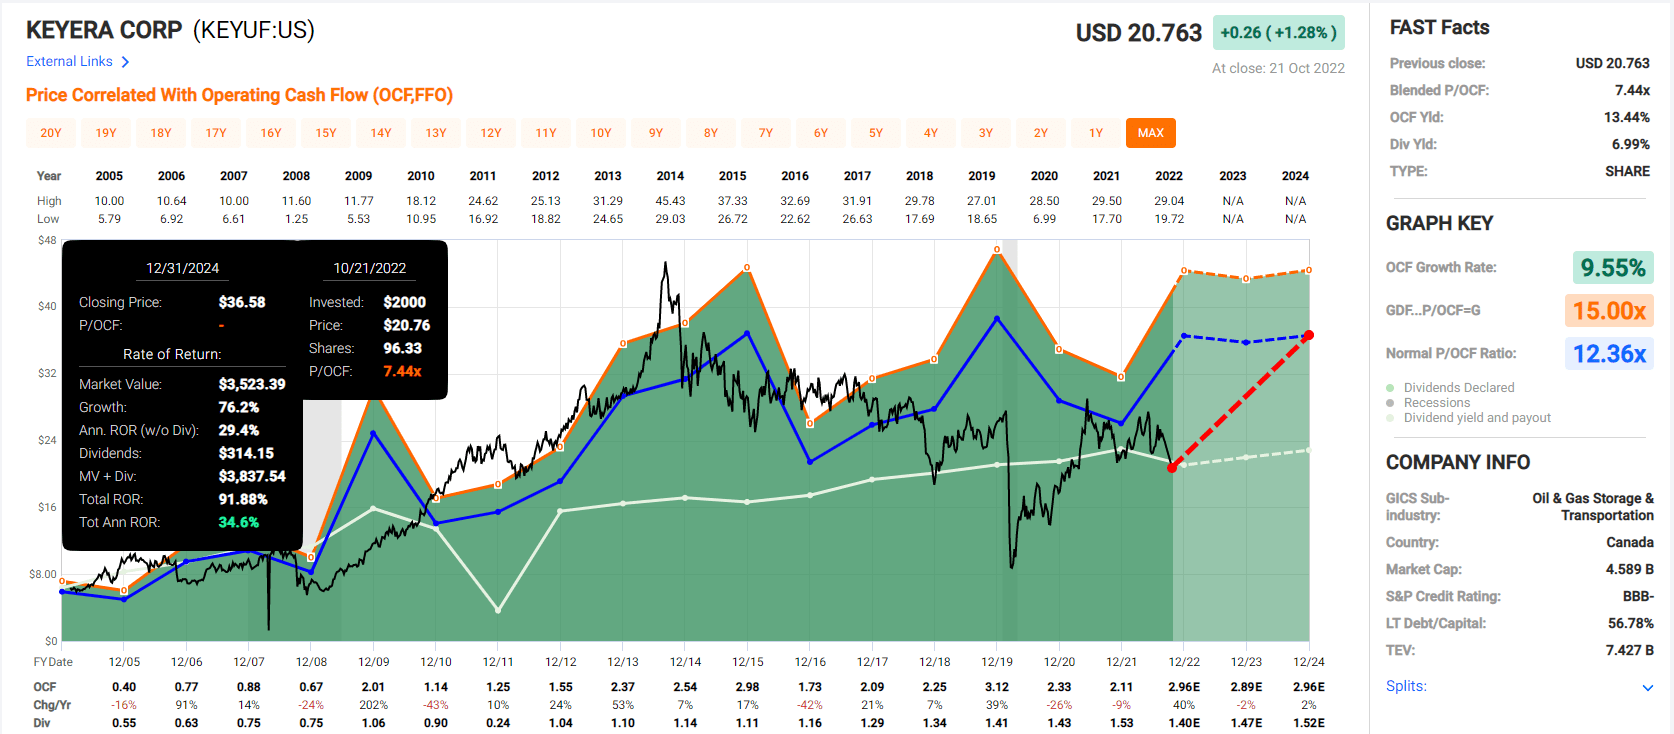
Scotiabank 2024 Consensus Return Potential
(Source: FAST Graphs, FactSet)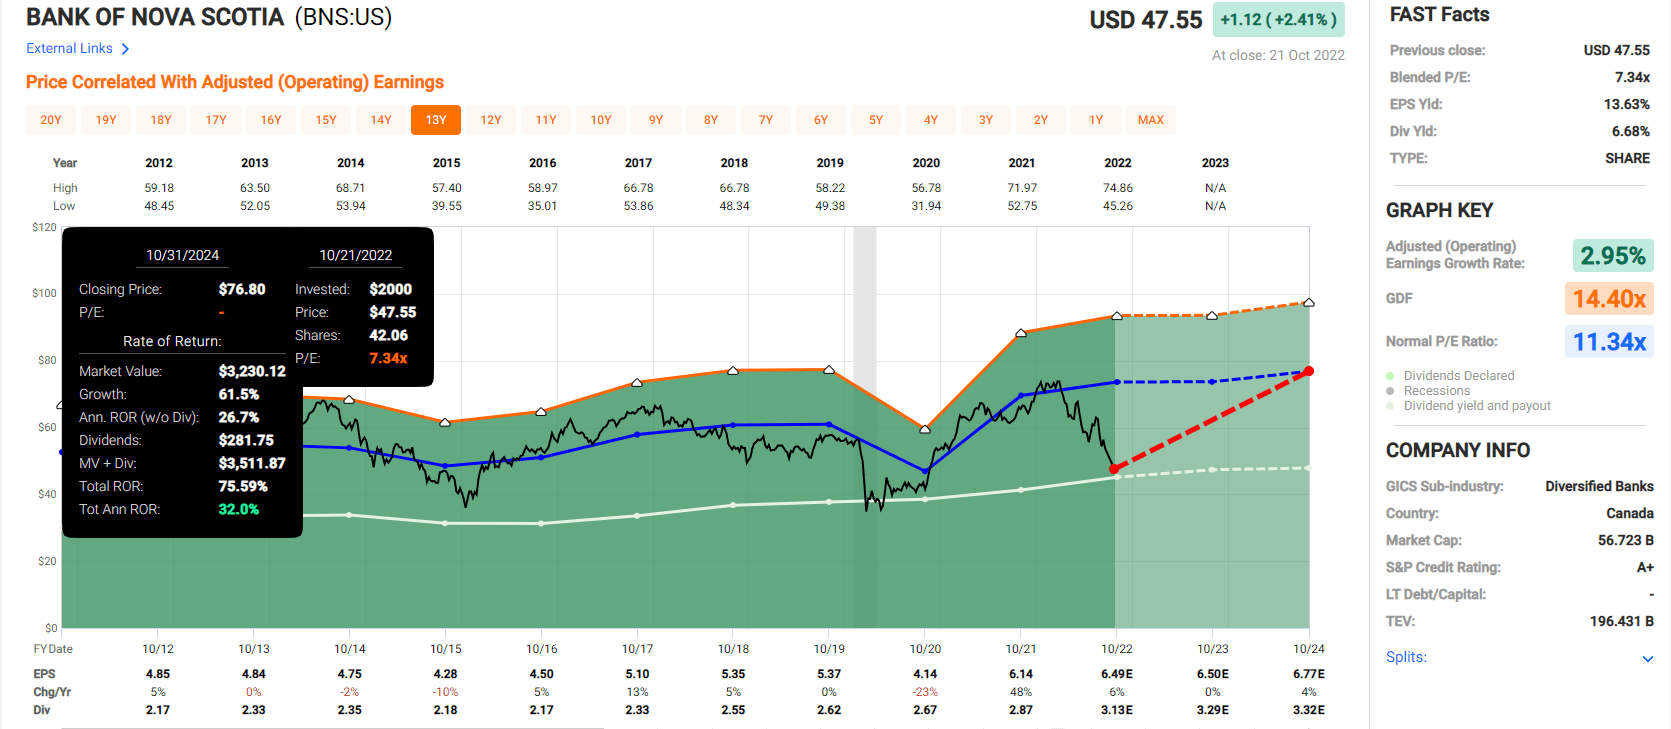
The average 2024 consensus total return potential: 35.6% CAGR
Average 2024 consensus total return potential: 90%
Now compare that to the S&P 500.
S&P 500 2024 Consensus Return Potential
(Source: FAST Graphs, FactSet)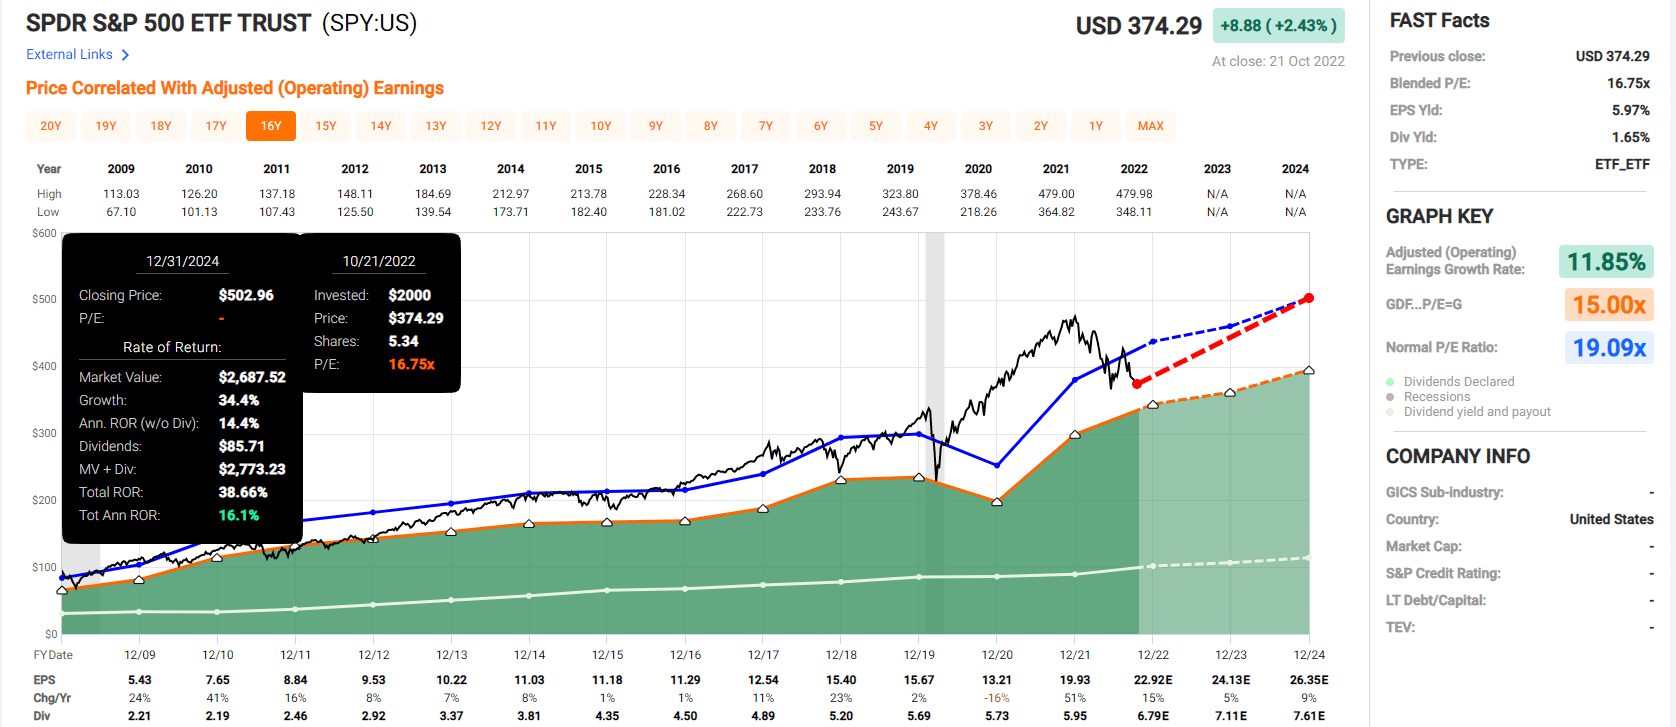
Analysts expect the S&P to potentially deliver 17% annual returns through 2024.
- these 10 blue-chips offer more than 2X the market’s return potential through 2024
But my goal isn’t to help you quickly double your money and earn Buffett-like 36% annual short-term returns.
I want to help you achieve financial freedom and that’s what these 10 blue-chips can do.
10 Of The Highest Quality Blue-Chip Bargains On Earth
(Source: Dividend Kings Zen Research Terminal)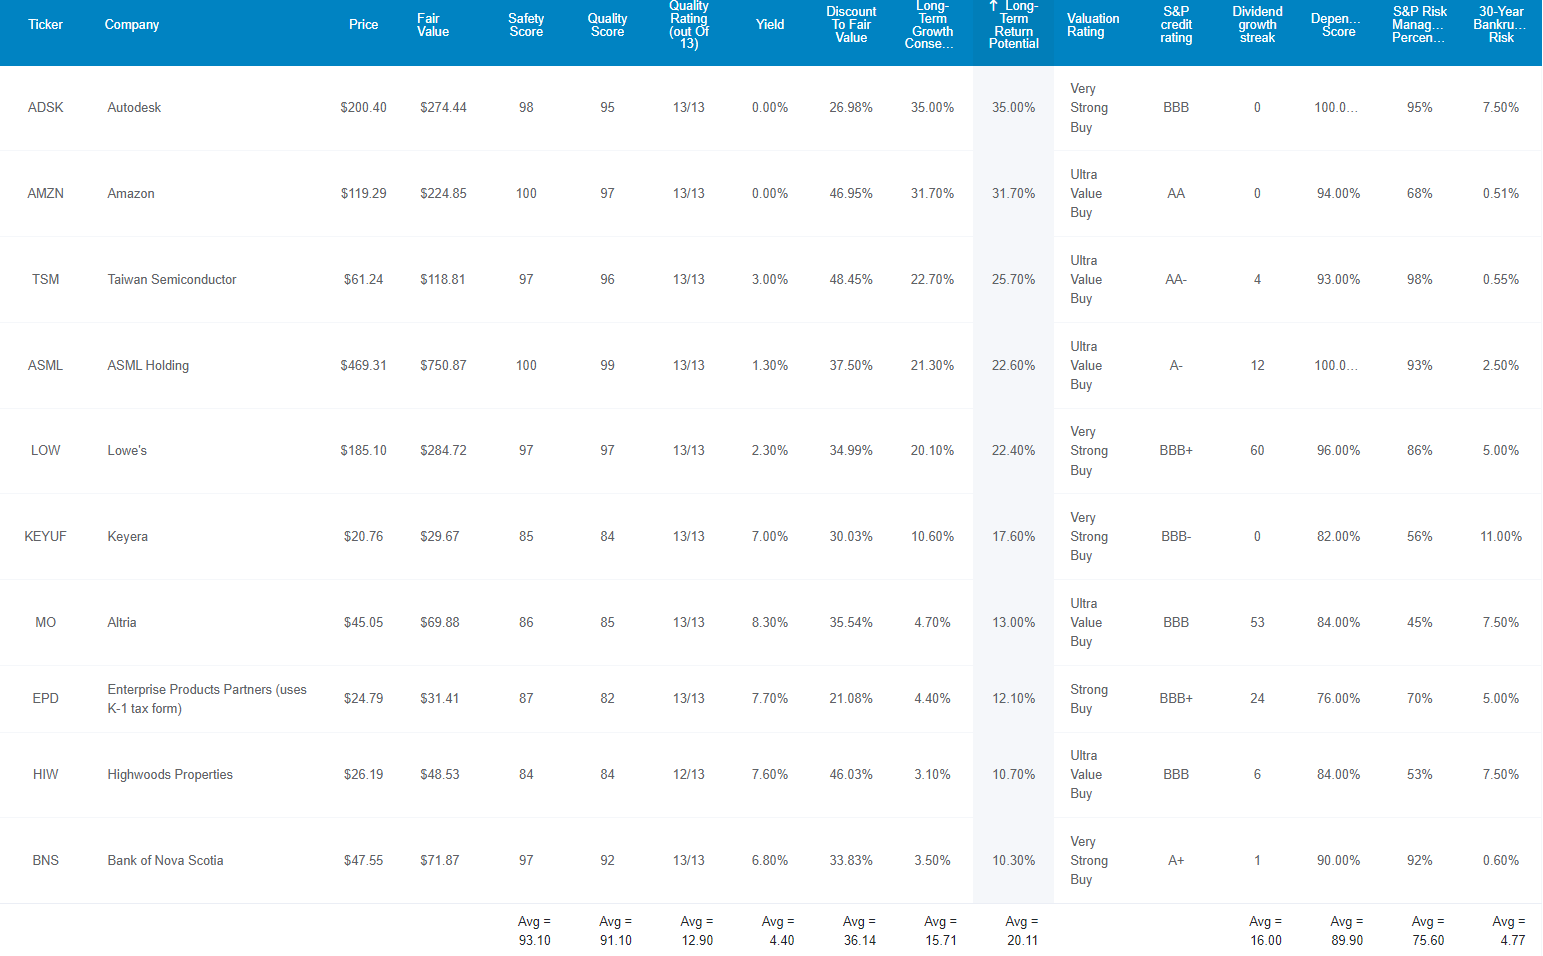
These aren’t just blue-chips they are 12.9/13 Ultra SWAN quality blue-chips, as close to perfect quality companies as exist on Wall Street. How can we tell? By comparing their fundamentals to the dividend aristocrats, the bluest of blue-chips.
41% Better Fundamentals Compared To Dividend Aristocrats
| Metric | Dividend Aristocrats | 10 Incredible Blue-Chips For Millennials |
Compared To Aristocrats |
| Quality | 87% | 93% | 107% |
| Safety | 90% | 91% | 101% |
| Average Recession Dividend Cut Risk | 0.5% | 0.5% | 100% |
| Severe Recession Dividend Cut Risk | 1.50% | 1.45% | 97% |
| Dependability | 84% | 90% | 107% |
| Dividend Growth Streak (Years) | 44.8 | 20.0 | 45% |
| Long-Term Risk Management Industry Percentile | 67% Above-Average, Low Risk | 76% Good, Low Risk | 113% |
| Average Credit Rating | A- Stable | BBB+ Stable | NA |
| Average Bankruptcy Risk | 3.04% | 4.77% | 157% |
| Average Return On Capital | 105% | 161% | 153% |
| Average ROC Industry Percentile | 83% | 80% | 96% |
| 13-Year Median ROC | 89% | 108% | 121% |
| Forward PE | 18.7 | 14.7 | 79% |
| Discount To Fair Value | 8% | 36% | 450% |
| DK Rating | Reasonable Buy | Ultra Value Buy | NA |
| Yield | 2.7% | 4.4% | 163% |
| LT Growth Consensus | 8.6% | 15.7% | 183% |
| Total Return Potential | 11.3% | 20.1% | 178% |
| Risk-Adjusted Expected Return | 7.7% | 13.4% | 175% |
| Inflation & Risk-Adjusted Expected Return | 5.5% | 11.2% | 205% |
| Conservative Years To Double | 13.2 | 6.4 | 49% |
| Average | 141% |
(Source: Dividend Kings Zen Research Terminal)
Overall, these Ultra SWANs are 41% better than the dividend aristocrats and here’s why.
Ben Graham considered a 20+ year dividend growth streak an important sign of excellent quality and these Ultra SWANs average a 20-year streak, meeting the Graham standard of excellence.
Their average dividend cut risk in an average recession since WWII is 0.5% and their average cut risk in a severe Pandemic/Great Recession economic downturn is approximately 1.45%.
Joel Greenblatt considers return on capital or ROC his gold standard proxy for quality and moatiness.
- using valuation and ROC he achieved 40% annual returns for 21 years
- S&P ROC in 2021 was 14.6%
The aristocrats have impressive 105% ROC, but these Ultra SWANs 161%.
- 11X better than the S&P 500
- 53% higher than the dividend aristocrats
Their average ROC is in the 80th industry percentile, indicating a wide moat.
Their 13-year median ROC is 108%, indicating wide and potentially expanding moats.
S&P estimates their average 30-year bankruptcy risk at 4.77%, a BBB+ stable credit rating.
- the opposite of Cathie Wood’s speculative/non-profitable tech focus
S&P also estimates that their average long-term global risk-management percentile is in the 76th percentile.
- S&P has spent over 20 years creating the most comprehensive risk management rating score in the world
- 1,000 fundamental metrics
- over 130 sub-categories
- over 30 major categories
- including: labor relations, supply chain management, innovation (R&D efficiency), brand management, corporate governance, climate change adaptation, corporate scandals, lawsuit risk, etc.
- these are built into every credit rating for the last 20 years
| Classification | S&P LT Risk-Management Global Percentile |
Risk-Management Interpretation |
Risk-Management Rating |
| BTI, ILMN, SIEGY, SPGI, WM, CI, CSCO, WMB, SAP, CL | 100 | Exceptional (Top 80 companies in the world) | Very Low Risk |
| Strong ESG Stocks | 86 |
Very Good |
Very Low Risk |
| Foreign Dividend Stocks | 77 |
Good, Bordering On Very Good |
Low Risk |
| 10 Incredible Millennial Blue-Chips | 76 |
Good |
Low Risk |
| Ultra SWANs | 74 | Good | Low Risk |
| Dividend Aristocrats | 67 | Above-Average | Low Risk |
| Low Volatility Stocks | 65 | Above-Average | Low Risk |
| Master List average | 61 | Above-Average | Low Risk |
| Dividend Kings | 60 | Above-Average | Low Risk |
| Hyper-Growth stocks | 59 | Average, Bordering On Above-Average | Medium Risk |
| Dividend Champions | 55 | Average | Medium Risk |
| Monthly Dividend Stocks | 41 | Average | Medium Risk |
(Source: S&P, Dividend Kings Zen Research Terminal)
So now that you know why these Ultra SWANs are 10 of the best blue-chips Millennials can buy, here’s why you might want to buy some of them today.
Wonderful Companies At Wonderful Prices
(Source: Dividend Kings Zen Research Terminal)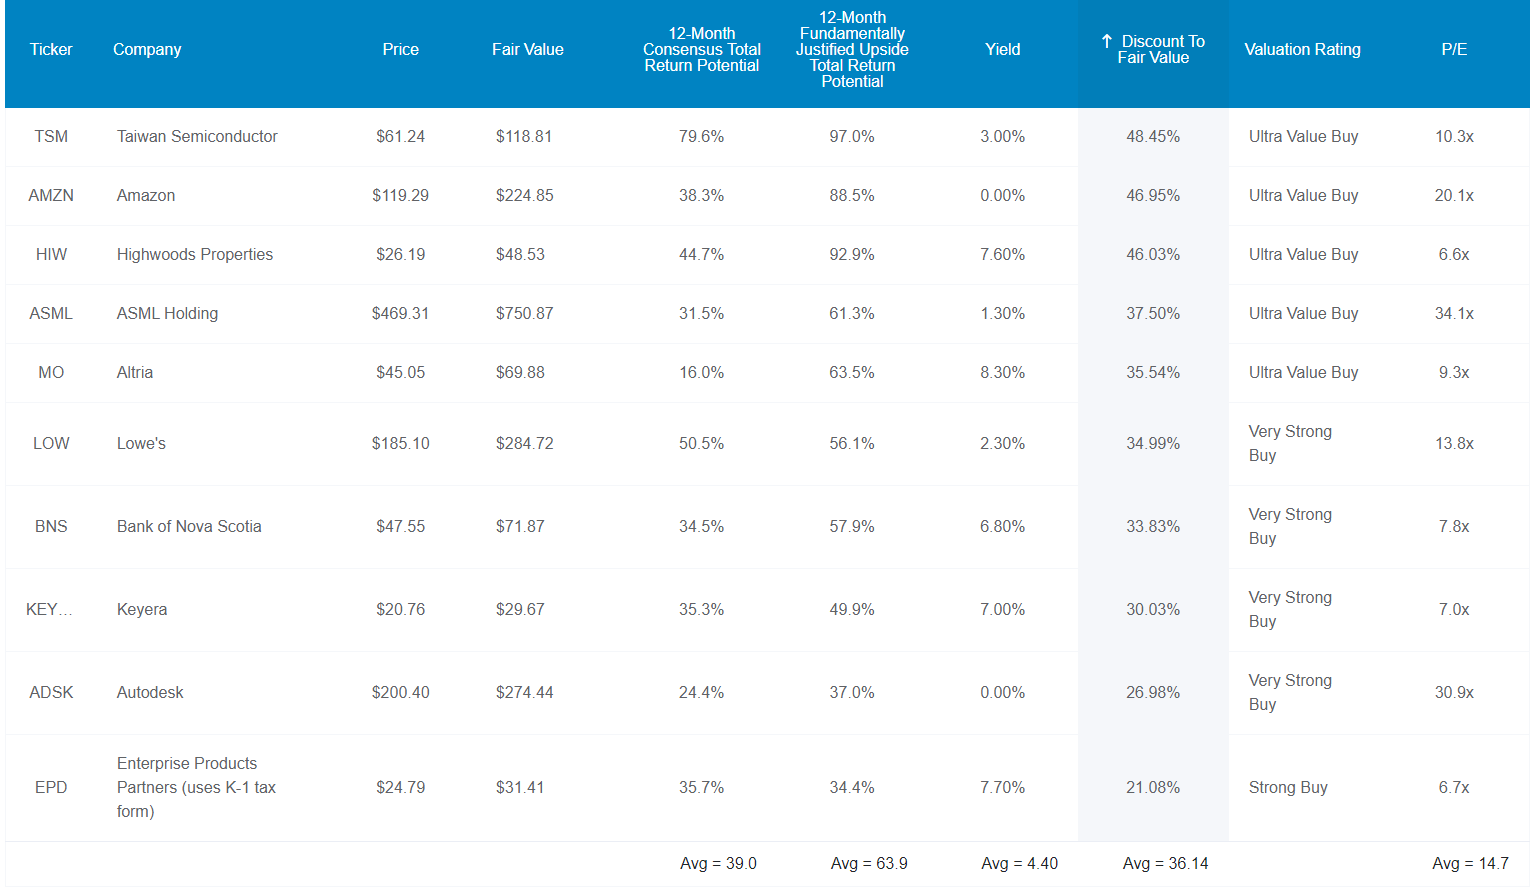
For context, the S&P is trading at a 16.2X forward P/E, a 4% historical discount.
The dividend aristocrats, which according to Joel Greenblatt are 53% lower quality than these Ultra SWANs, trade at 18.7X forward earnings.
These Ultra SWANs trade at 14.7X forward earnings, a 36% historical discount.
- and that makes them collectively an Ultra Value Buffett-style “fat pitch” table-pounding buy
Analysts think they will deliver 39% total returns in the next 12 months. But they are so undervalued and growing so quickly (over 15% per year) that their 12-month fundamentally justified total return potential is 64%.
- If they all grow as expected and return to historical mid-range market-determined fair value you will earn 64% in the next year
But my goal isn’t to help you potentially earn 39% in a year, or even 64%, or 36% annual returns for two years (90% by 2024).
I’m not trying to double your money in 2 years, I’m trying to help you potentially earn 40X returns in the next 20 years.
How These 10 Ultra SWANs Can Potentially Help You Retire In Safety And Splendor
(Source: Dividend Kings Zen Research Terminal)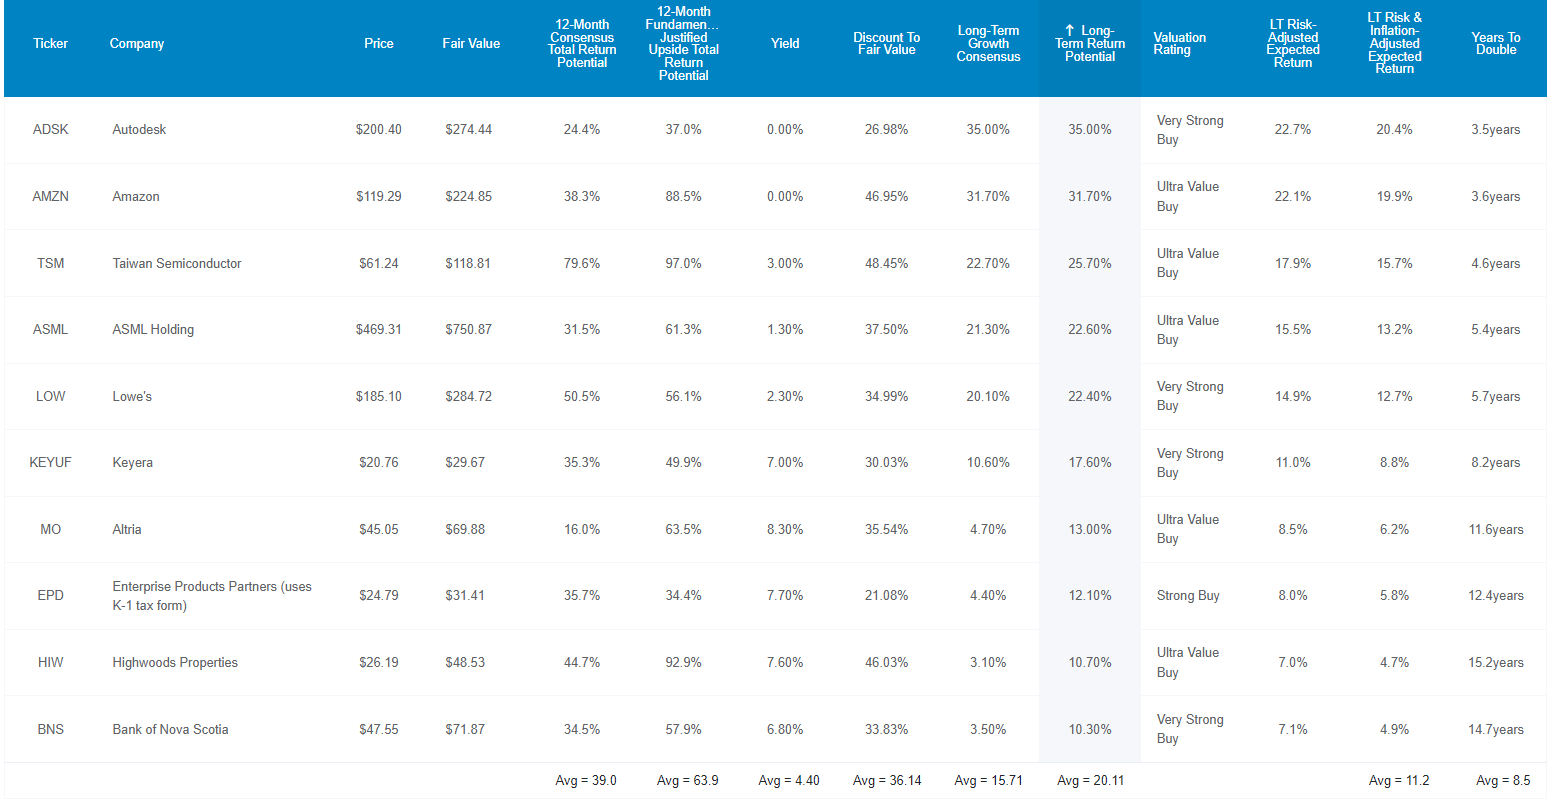
These Ultra SWANs, even with 2 that pay no dividends at all, generate one of the world’s safest 4.4% yields AND are growing at almost 16% per year.
That means 20.1% CAGR consensus long-term return potential.
| Investment Strategy | Yield | LT Consensus Growth | LT Consensus Total Return Potential | Long-Term Risk-Adjusted Expected Return | Long-Term Inflation And Risk-Adjusted Expected Returns | Years To Double Your Inflation & Risk-Adjusted Wealth |
10-Year Inflation And Risk-Adjusted Expected Return |
| 10 Millennial Ultra SWANs | 4.4% | 15.7% | 20.1% | 14.1% | 11.8% | 6.1 | 3.05 |
| Schwab US Dividend Equity ETF | 3.8% | 8.5% | 12.3% | 8.6% | 6.3% | 11.4 | 1.84 |
| Nasdaq | 0.8% | 11.5% | 12.3% | 8.6% | 6.3% | 11.4 | 1.85 |
| Dividend Aristocrats | 2.8% | 8.7% | 11.5% | 8.1% | 5.8% | 12.5 | 1.75 |
| S&P 500 | 1.8% | 8.5% | 10.3% | 7.2% | 4.9% | 14.6 | 1.62 |
(Sources: DK Research Terminal, FactSet, Morningstar, YCharts)
4.4% yield and Buffett-like long-term return potential. Show me an ETF that can potentially deliver that? Show me an ETF with 4.4% yield that’s expected to nearly double the market’s long-term returns and run circles around the Nasdaq, which has more than doubled ARKK’s returns for the last eight years.
Inflation-Adjusted Consensus Total Return Potential
| Time Frame (Years) | 8.0% CAGR Inflation-Adjusted S&P 500 Consensus | 9.2% Inflation-Adjusted Aristocrat Consensus | 17.8% CAGR Inflation-Adjusted 10 Millennial Ultra SWANs Consensus | Difference Between Inflation-Adjusted 10 Millennial Ultra SWANs Consensus And S&P Consensus |
| 5 | $1,468.65 | $1,553.50 | $2,271.33 | $802.68 |
| 10 | $2,156.93 | $2,413.37 | $5,158.92 | $3,001.99 |
| 15 | $3,167.77 | $3,749.18 | $11,717.59 | $8,549.82 |
| 20 | $4,652.33 | $5,824.36 | $26,614.45 | $21,962.12 |
| 25 | $6,832.64 | $9,048.16 | $60,450.09 | $53,617.45 |
| 30 | $10,034.74 | $14,056.34 | $137,301.83 | $127,267.09 |
(Source: Dividend Kings Research Terminal, FactSet)
Even if these Ultra SWANs can only grow as expected for the next decade that’s still a more than 5X inflation-adjusted return. Over the next 20 years they have the potential for 40X returns (27X adjusted for inflation).
And over the next 30 years? If they can keep growing at the consensus rate that’s a 137X potential real return.
| Time Frame (Years) | Ratio Inflation-Adjusted 10 Millennial Ultra SWANs Consensus/Aristocrat Consensus | Ratio Inflation-Adjusted 10 Millennial Ultra SWANs Consensus vs. S&P consensus |
| 5 | 1.46 | 1.55 |
| 10 | 2.14 | 2.39 |
| 15 | 3.13 | 3.70 |
| 20 | 4.57 | 5.72 |
| 25 | 6.68 | 8.85 |
| 30 | 9.77 | 13.68 |
(Source: Dividend Kings Research Terminal, FactSet)
Potentially running circles around the S&P and aristocrats (and Nasdaq) while paying a very safe 4.4% yield? That’s something that every Millennial, retiree, and everyone else can appreciate.
OK, so this sounds amazing, and the math is very compelling. But what evidence is there that these blue-chips can deliver anything close to 20% long-term returns?
Historical Returns Since March 1999 (Annual Rebalancing)
The future doesn’t repeat, but it often rhymes. – Mark Twain
In our case, “past performance is no guarantee of future results.”
Still, studies show that blue chips with relatively stable fundamentals offer predictable returns based on yield, growth, and valuation mean reversion over time.
Bank of America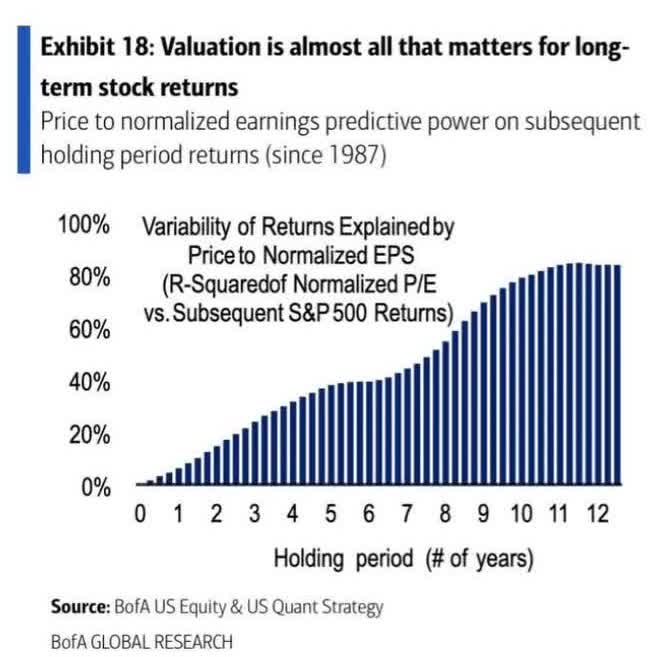
23 years is a time frame in which 94% of total returns are due to fundamentals, not luck.
(Source: Portfolio Visualizer Premium)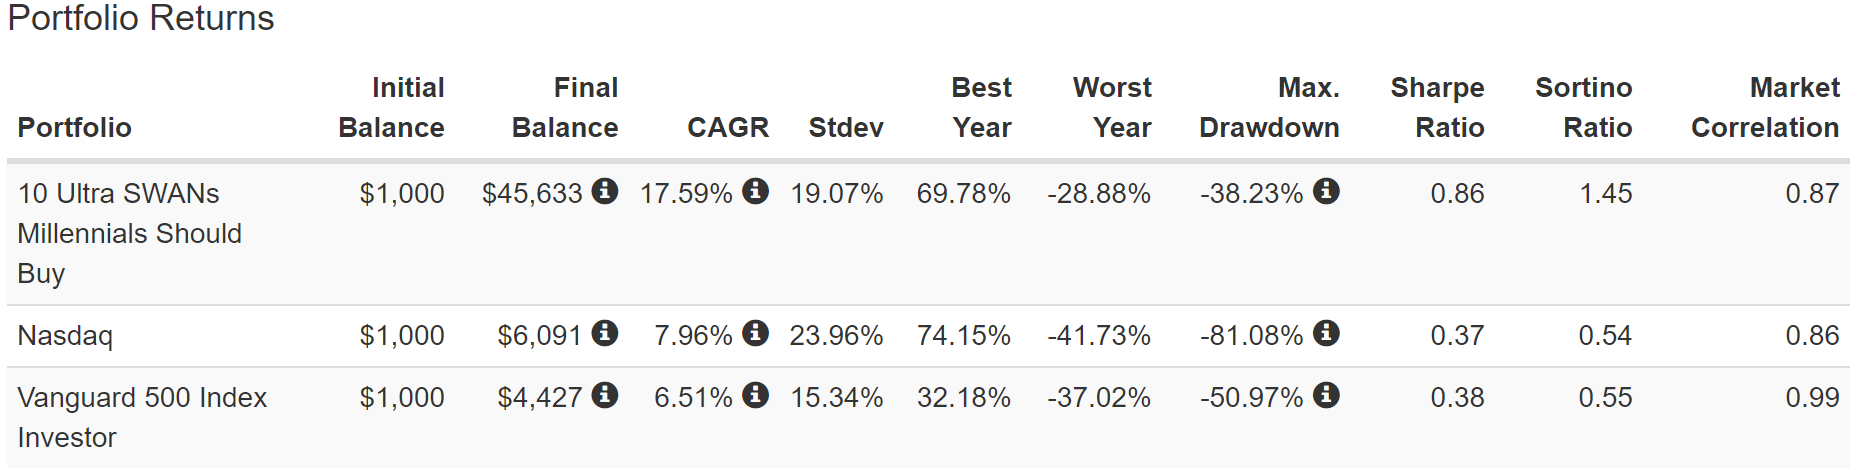
2X the long-term returns of the Nasdaq and 3X those of the S&P 500 but with far smaller peak declines thanks to diversifying into both value and growth.
3X better negative-volatility-adjusted total returns (Sortino ratio).
Over 23 years the market is 94% right about a portfolio, and its judgement is clear. These are world-beater blue-chips that are far superior to the market and even the Nasdaq.
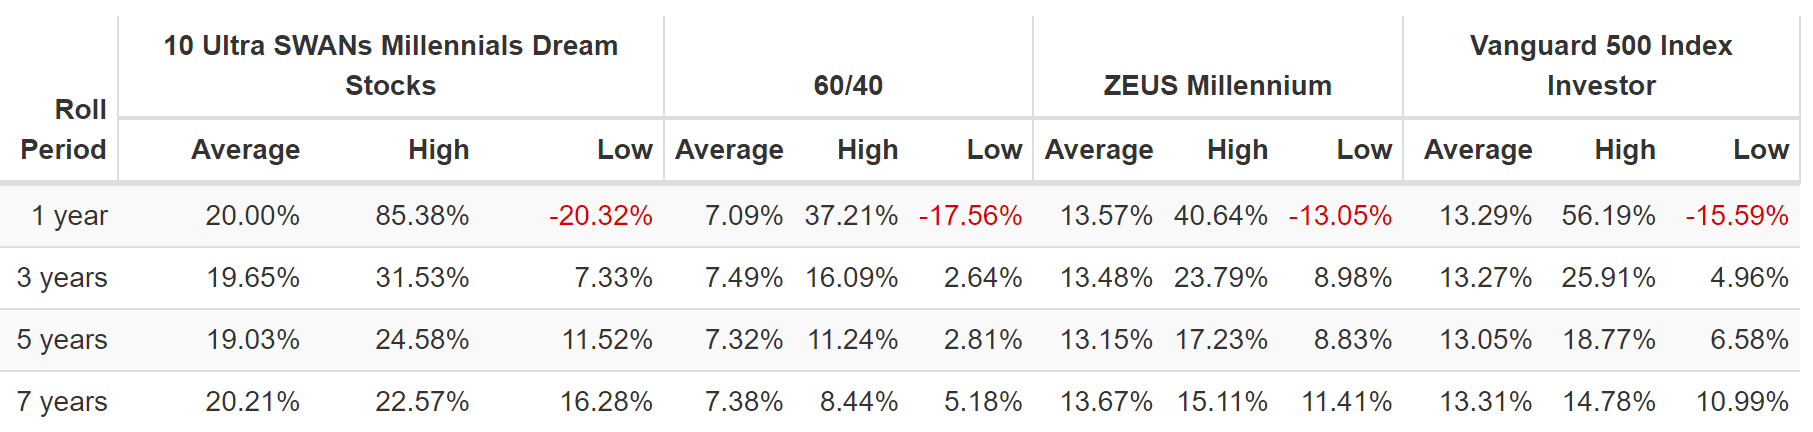
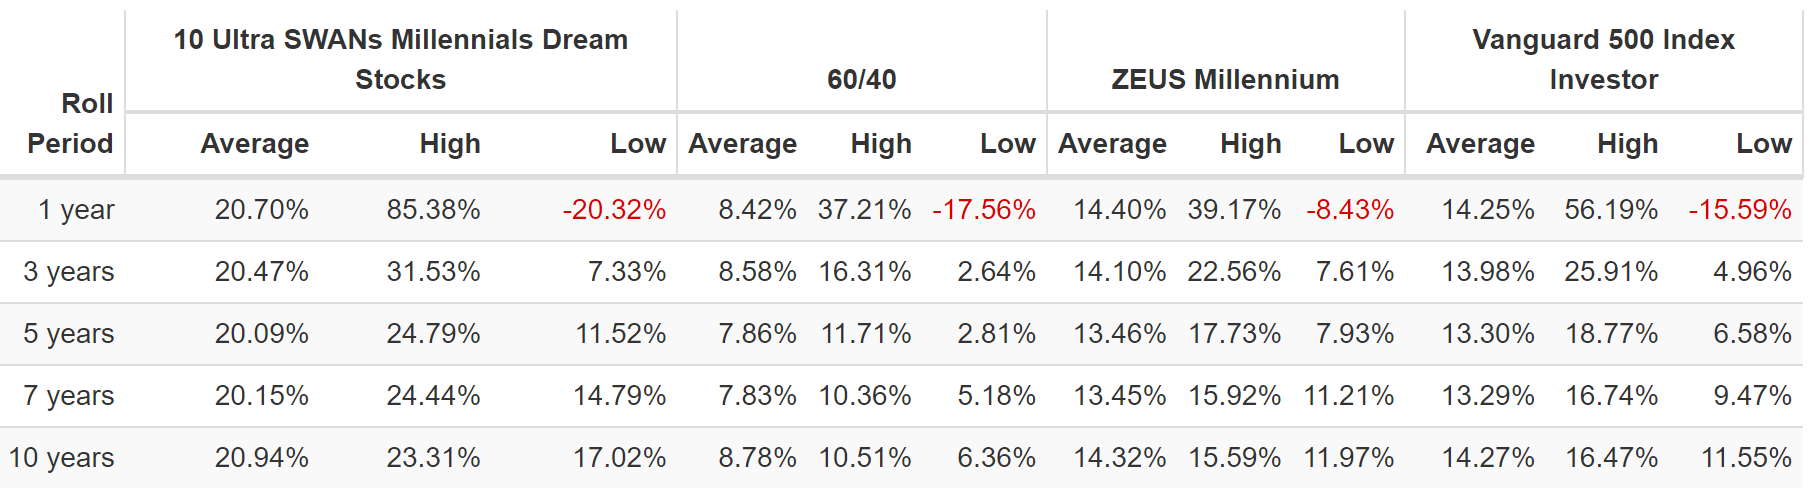
(Source: Portfolio Visualizer Premium)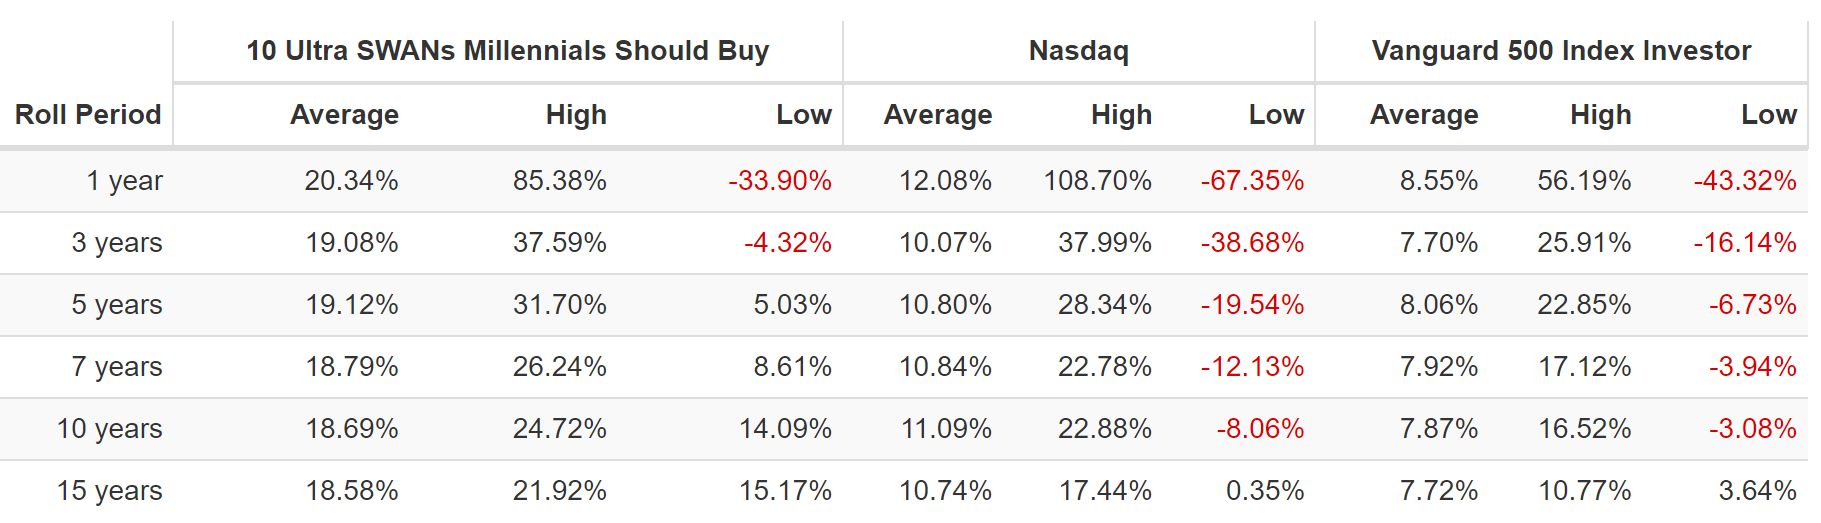
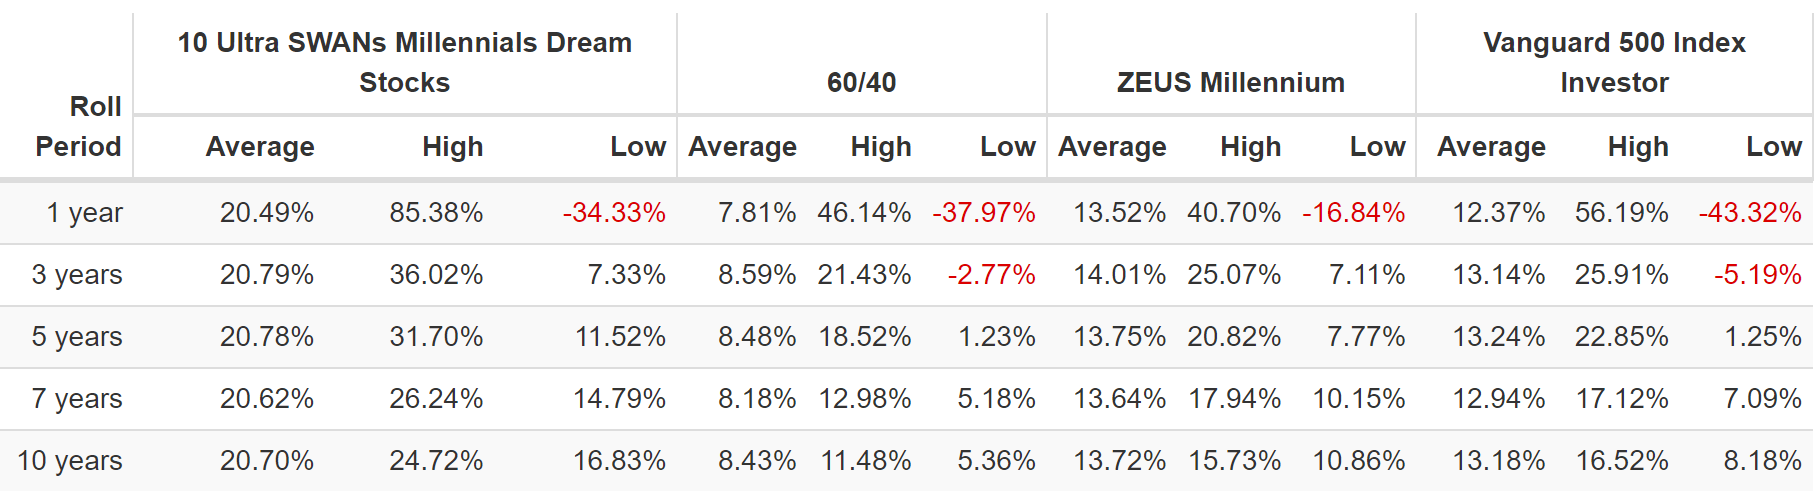
The Nasdaq’s average 12-month return since inception is 12% annually, just like what analysts expect in the future.
The average 12-month return for these Ultra SWANs is 20%, just like what analysts expect in the future.
Their average long-term rolling return is 19% CAGR, about 2X better than the Nasdaq and 3X better than the S&P 500.
This Is What Rich Retirement Income Looks Like
2007 and 2008 were 3 MO Spinoffs ( (Source: Portfolio Visualizer Premium))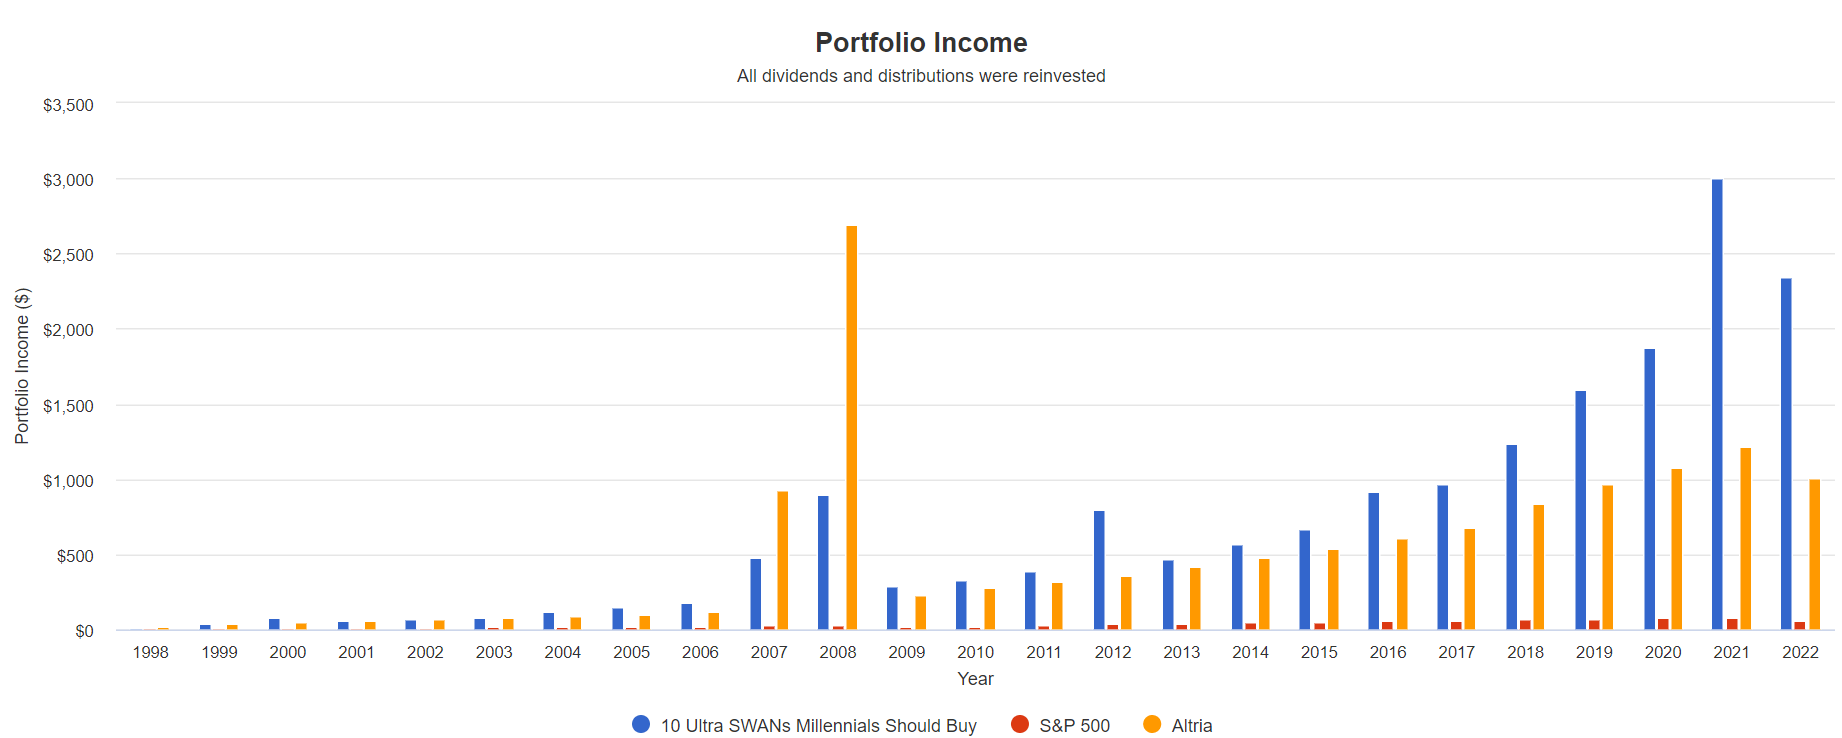
Remember how MO is a rockstar dividend grower? With 16% CAGR long-term income growth? Well these 10 Ultra SWANs have delivered even better income growth and a lot more income over time.
Cumulative Dividends Since 1998 Per $1,000 Initial Investment
| Metric | S&P 500 | Altria | 10 Ultra SWANs Millennials Should Buy |
| Total Dividends | $945 | $13,588 | $18,382 |
| Total Inflation-Adjusted Dividends | $522.10 | $7,507.18 | $10,155.80 |
| Annualized Income Growth Rate | 8.8% | 17.2% | 24.9% |
| Total Income/Initial Investment % | 0.95 | 13.59 | 18.38 |
| Inflation-Adjusted Income/Initial Investment % | 0.52 | 7.51 | 10.16 |
| More Inflation-Adjusted Income Than S&P | NA | 14.38 | 19.45 |
| Starting Yield | 1.1% | 3.0% | 1.5% |
| Today’s Annual Dividend Return On Your Starting Investment (Yield On Cost) | 8.3% | 134.0% | 312.4% |
| 2022 Inflation-Adjusted Annual Dividend Return On Your Starting Investment (Inflation-Adjusted Yield On Cost) | 4.6% | 74.0% | 172.6% |
(Source: Portfolio Visualizer Premium)
4.4% yield and historically 25% annual income growth, similar to what analysts think is possible in the future.
20X more dividends than the S&P and even more than MO with 3 spin-offs creating a massive 2007 and 2008 windfall.
A 173% inflation-adjusted yield on cost, which is more than 2X higher than buying MO alone.
This is why Millennials, and all younger investors should combine growth with yield, and so should everyone else;)
Turning These 10 Millennial Dream Blue-Chips Into A ZEUS Retirement Portfolio
As great as these 10 Ultra SWANs are, this portfolio still experiences more volatility than many investors could stomach without panic selling.
(Source: Portfolio Visualizer Premium)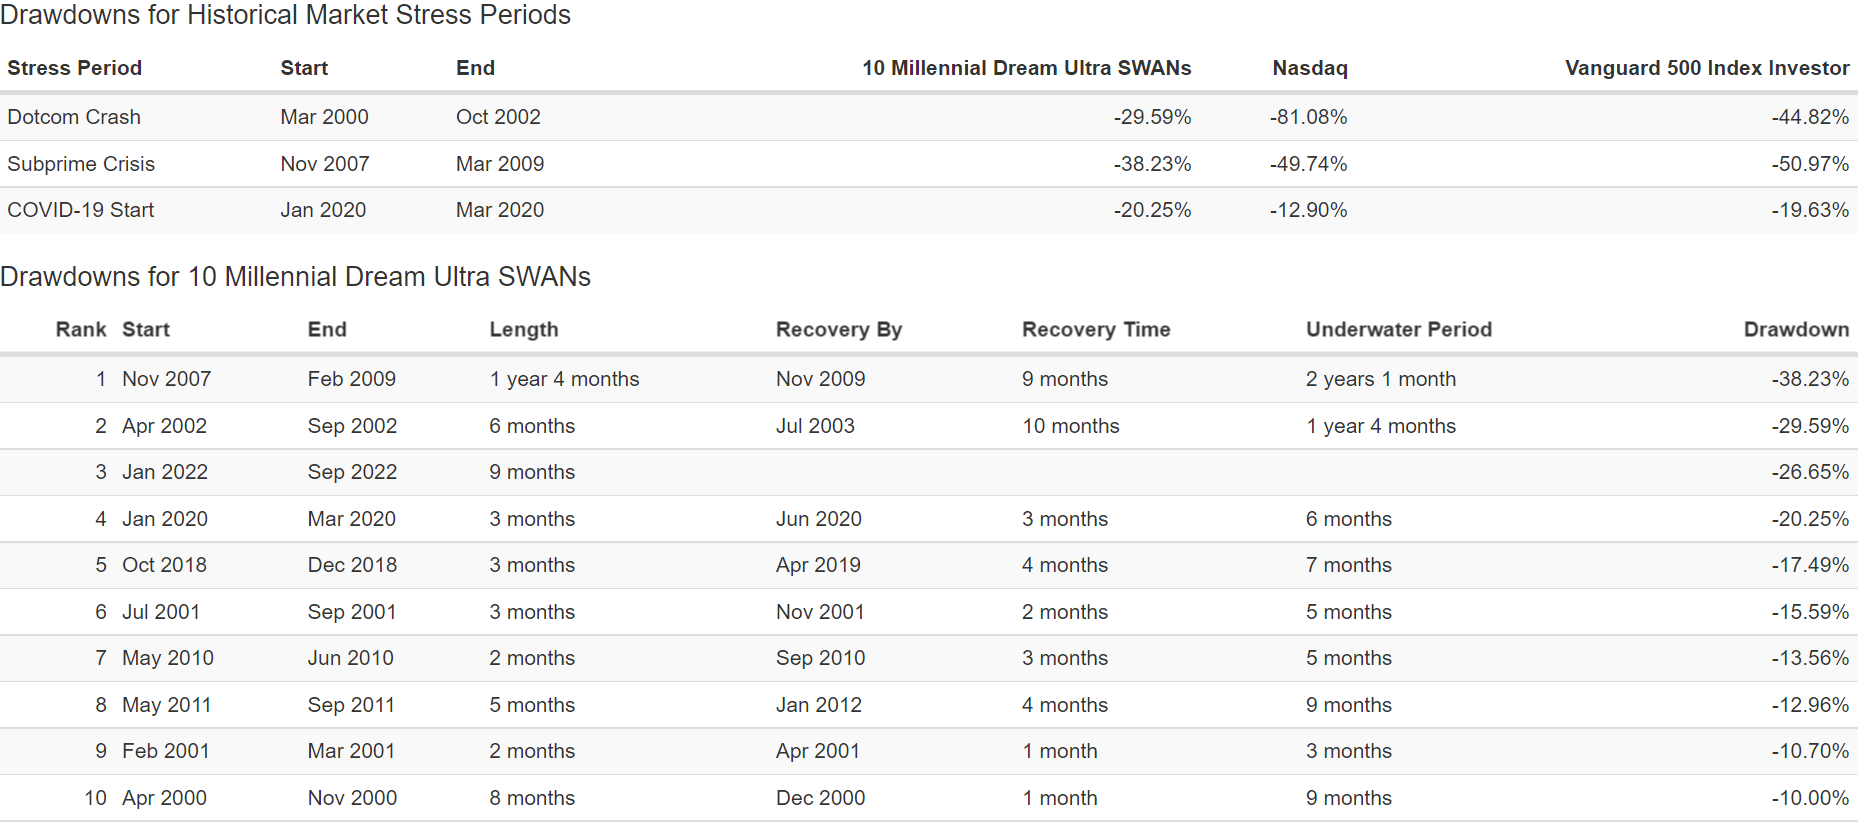
A 27% peak decline in 2022’s bear market, a 20% peak Pandemic crash, 38% decline in the Great Recession and a 30% decline in the tech crash.
Others might simply be uncomfortable investing 20% into chip makers and 40% into tech.
So here’s how the Dividend Kings ZEUS strategy can help.
ZEUS = Zen Extraordinary Ultra SWAN (Sleep Well At Night)
- 33% stock ETFs
- 33% hedging assets (cash, bonds, alternatives)
- 33% individual blue-chips
In this case:
- 16.67% SCHD or VYM (gold standard high-yield blue-chip ETFs)
- 16.67% QQQM (the king of fast-dividend growth ETFs)
- 16.67% long bonds (EDV or TLT)
- 16.67% managed futures (DBMF, GIFMX, PQTAX, AMFAX)
- 33% Millennial Ultra SWAN dream stocks (3.33% each)
| Metric | 60/40 | ZEUS Millennium | X Better Than 60/40 |
| Yield | 2.3% | 4.5% | 1.93 |
| Growth Consensus | 5.1% | 8.6% | 1.69 |
| LT Consensus Total Return Potential | 7.4% | 13.1% | 1.76 |
| Risk-Adjusted Expected Return | 5.2% | 9.2% | 1.76 |
| Safe Withdrawal Rate (Risk And Inflation-Adjusted Expected Returns) | 2.9% | 6.9% | 2.35 |
| Conservative Time To Double (Years) | 24.6 | 10.4 | 2.35 |
(Source: DK Research Terminal, FactSet)
Here we have a high-yield balanced portfolio that yields 3X the S&P 500, and has 13% long-term return potential.
- more than the Nasdaq, aristocrats or S&P 500
7% safe withdrawal rate is far higher than any ETF or standard fund can offer and just take a look at what happens to volatility when you diversify into high-yield, growth, and blue-chip hedging assets.
Total Returns Since June 2019 (DBMF, SCHD, EDV, QQQM, And 10 Millennial Dream Blue-Chips)
(Source: Portfolio Visualizer Premium)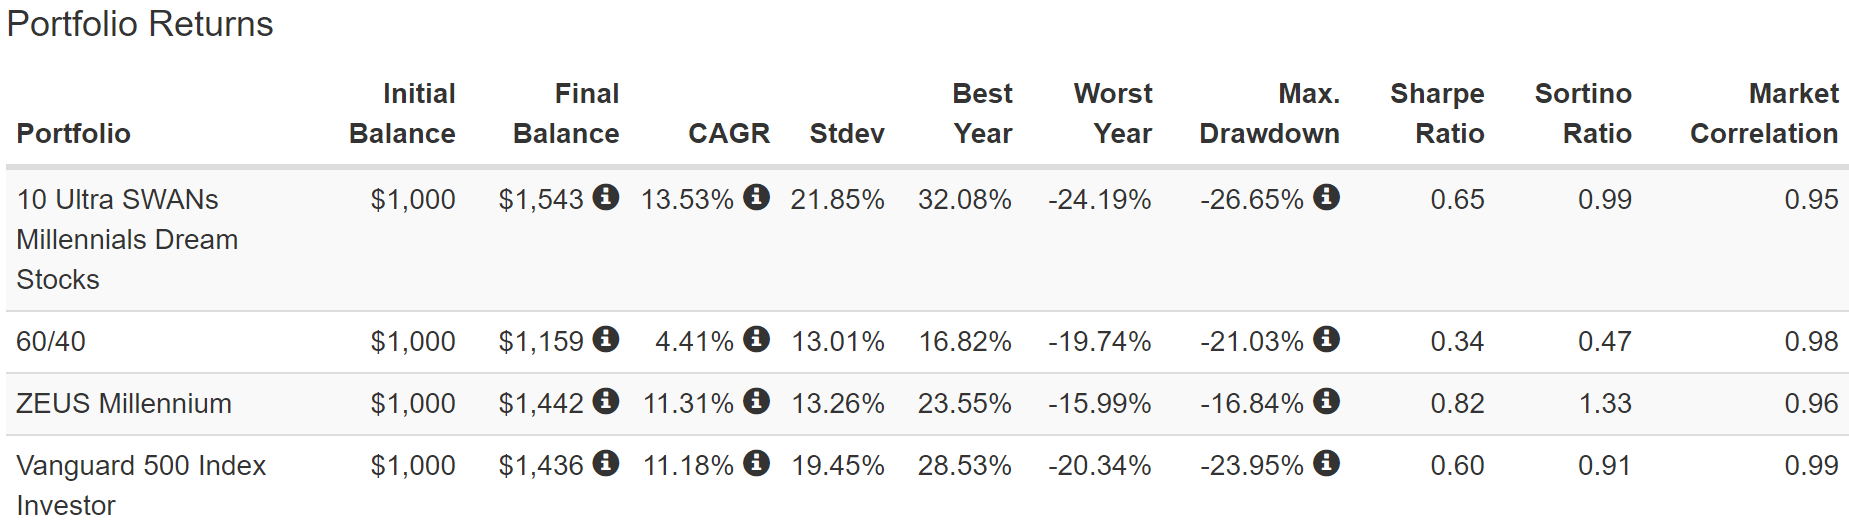
The peak decline falls by 10% in this bear market thanks to the ZEUS strategy.
- negative-volatility-adjusted total returns 33% higher
Total Returns Since February 2016 (GIFMX, SCHD, EDV, QQQM, And 10 Millennial Dream Blue-Chips)
(Source: Portfolio Visualizer Premium)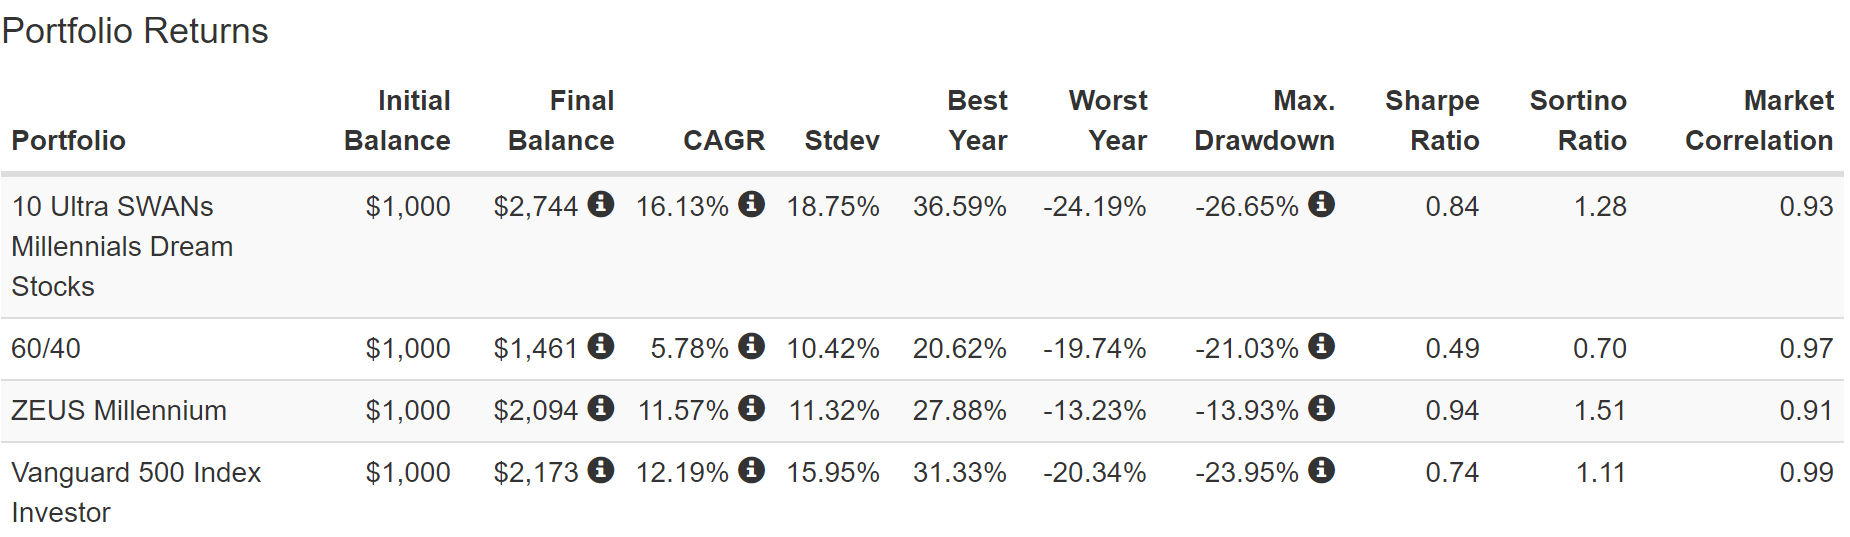
40% lower annual volatility and a 50% smaller peak decline using the ZEUS strategy.
- negative-volatility-adjusted returns 36% higher than the S&P 500
(Source: Portfolio Visualizer Premium)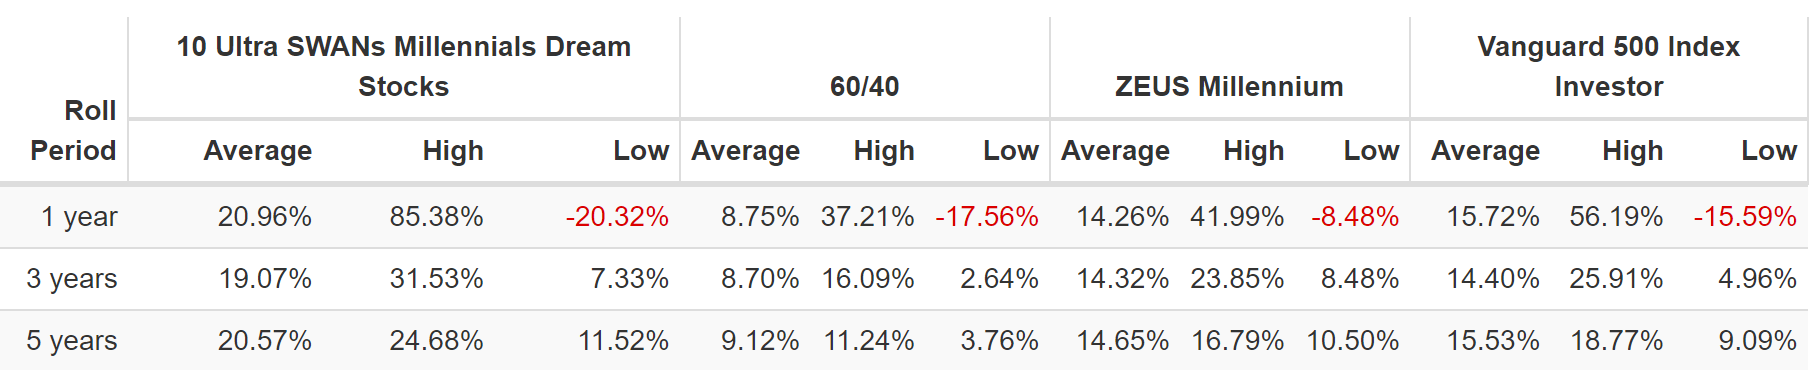
14% rolling returns, similar to what analysts expect in the future.
Total Returns Since January 2014 (PQTAX, SCHD, EDV, QQQM, And 10 Millennial Dream Blue-Chips)
(Source: Portfolio Visualizer Premium) (Source: Portfolio Visualizer Premium)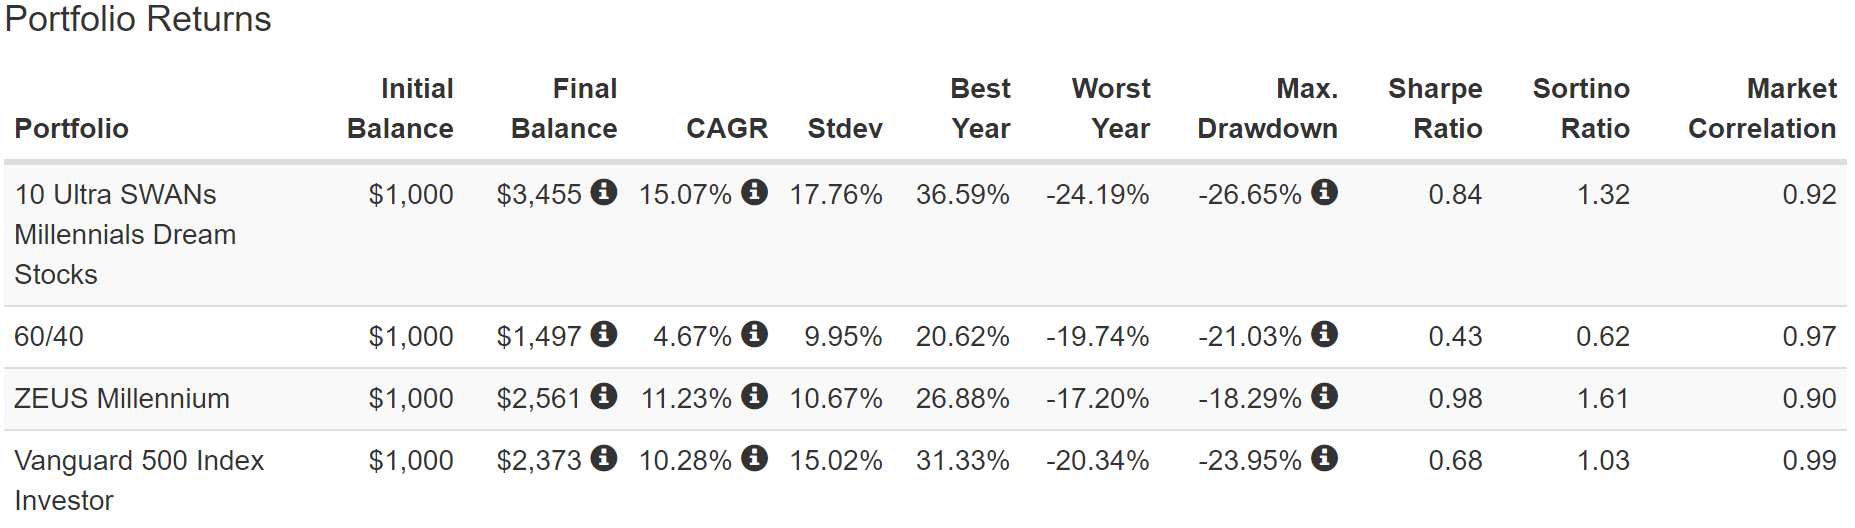
Total Returns Since August 2010 (AMFAX, VYM, EDV, QQQM, And 10 Millennial Dream Blue-Chips)
(Source: Portfolio Visualizer Premium) (Source: Portfolio Visualizer Premium)
Total Returns Since December 2007 (RYMTX, VYM, EDV, QQQM, And 10 Millennial Dream Blue-Chips)
(Source: Portfolio Visualizer Premium) (Source: Portfolio Visualizer Premium)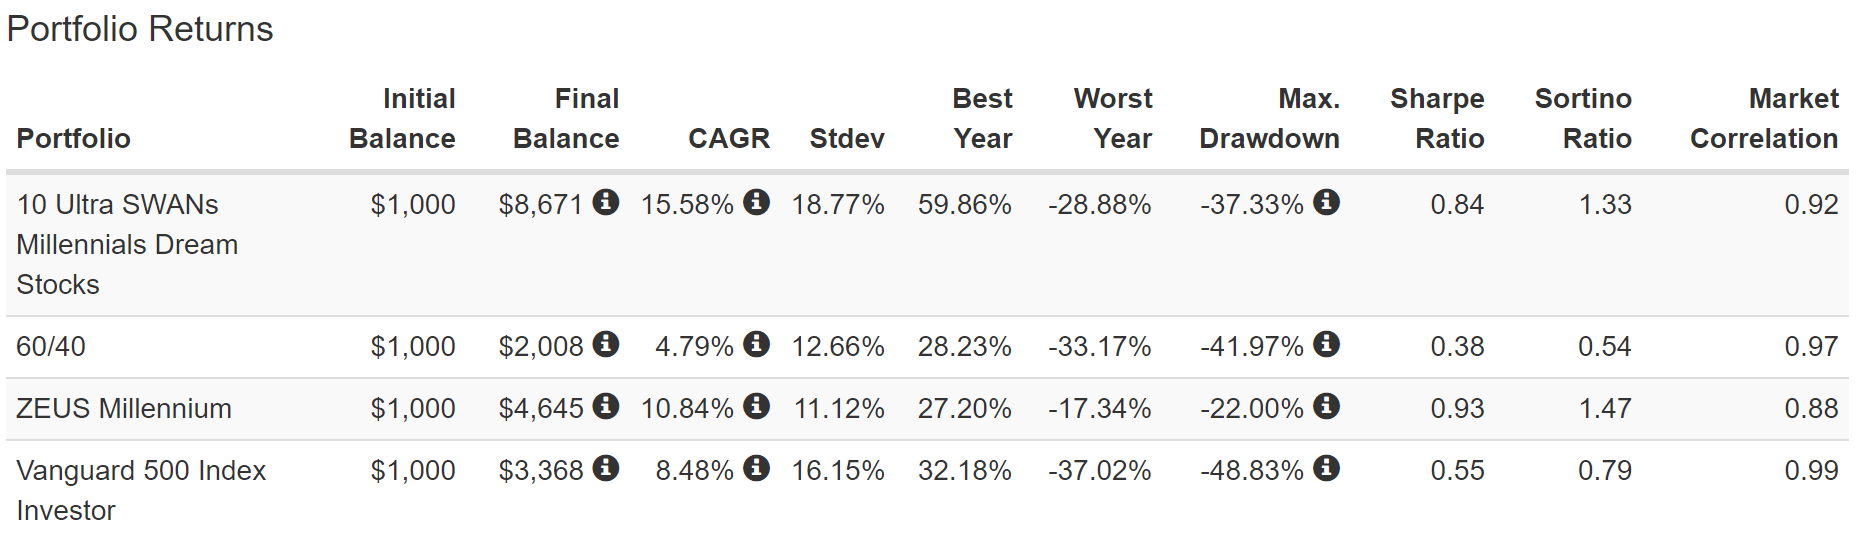
Total Returns Since March 2007 (RYMTX, VYM, TLT, QQQM, And 10 Millennial Dream Blue-Chips)
(Source: Portfolio Visualizer Premium)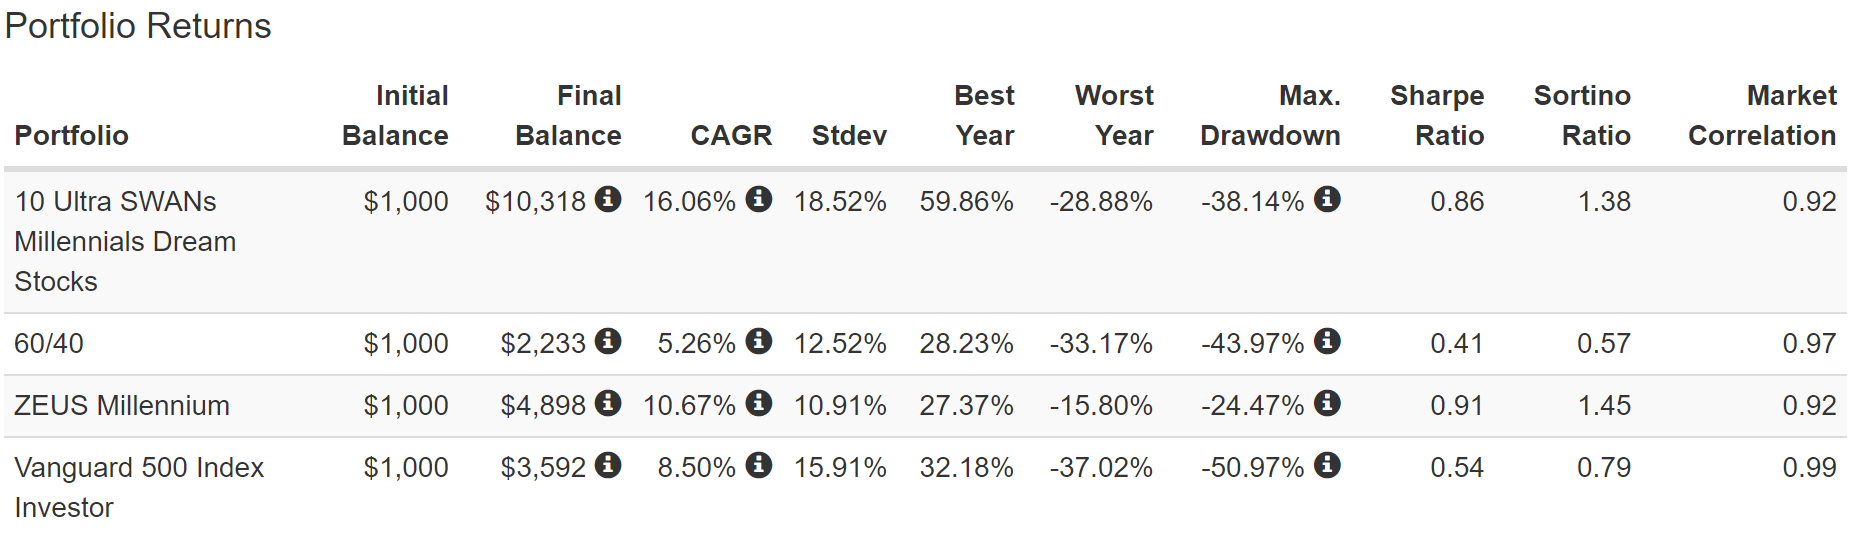
Market beating total returns and 2X that of a 60/40. But with much lower volatility.
(Source: Portfolio Visualizer Premium)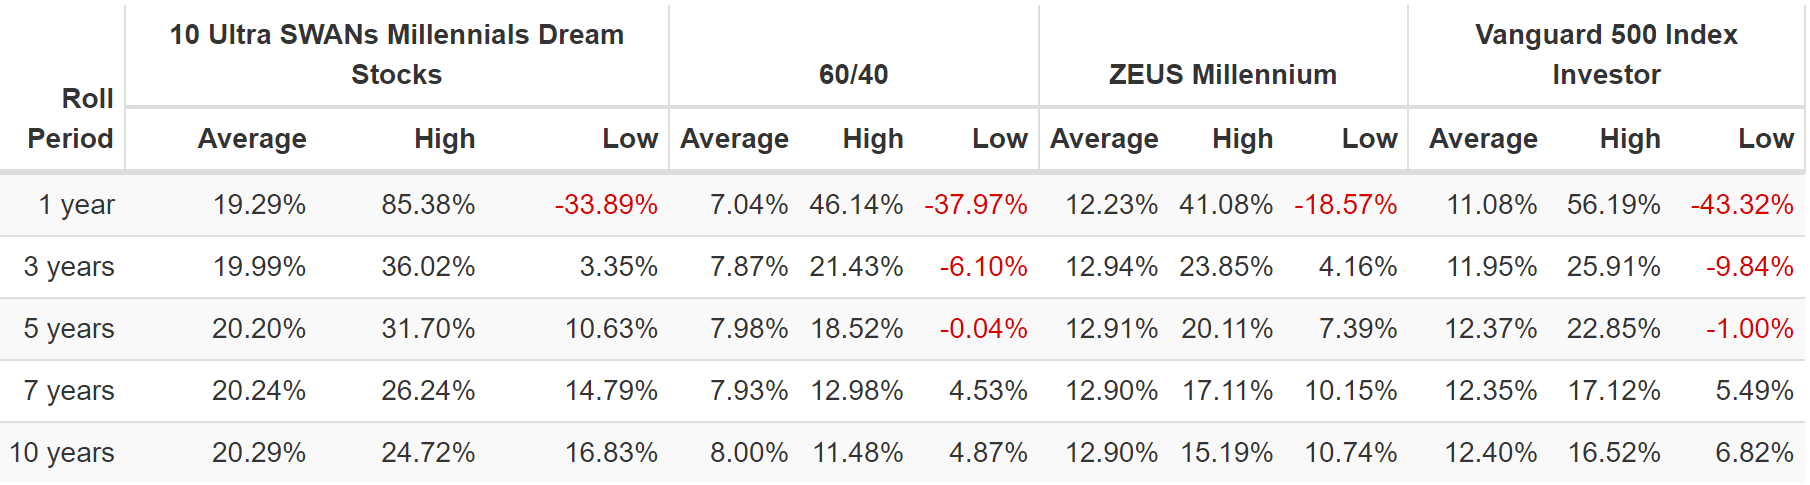
13% long-term rolling returns, just as has been the case across the last 16 years, and what analysts expect in the future.
(Source: Portfolio Visualizer Premium)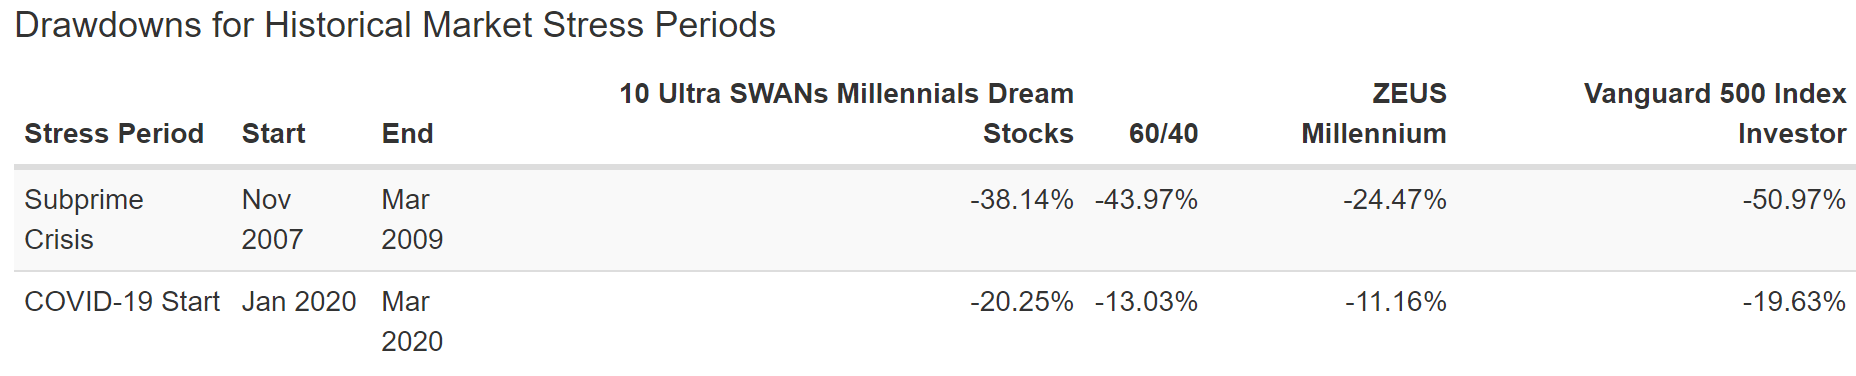
An 11% correction in the Pandemic.
(Source: Portfolio Visualizer Premium)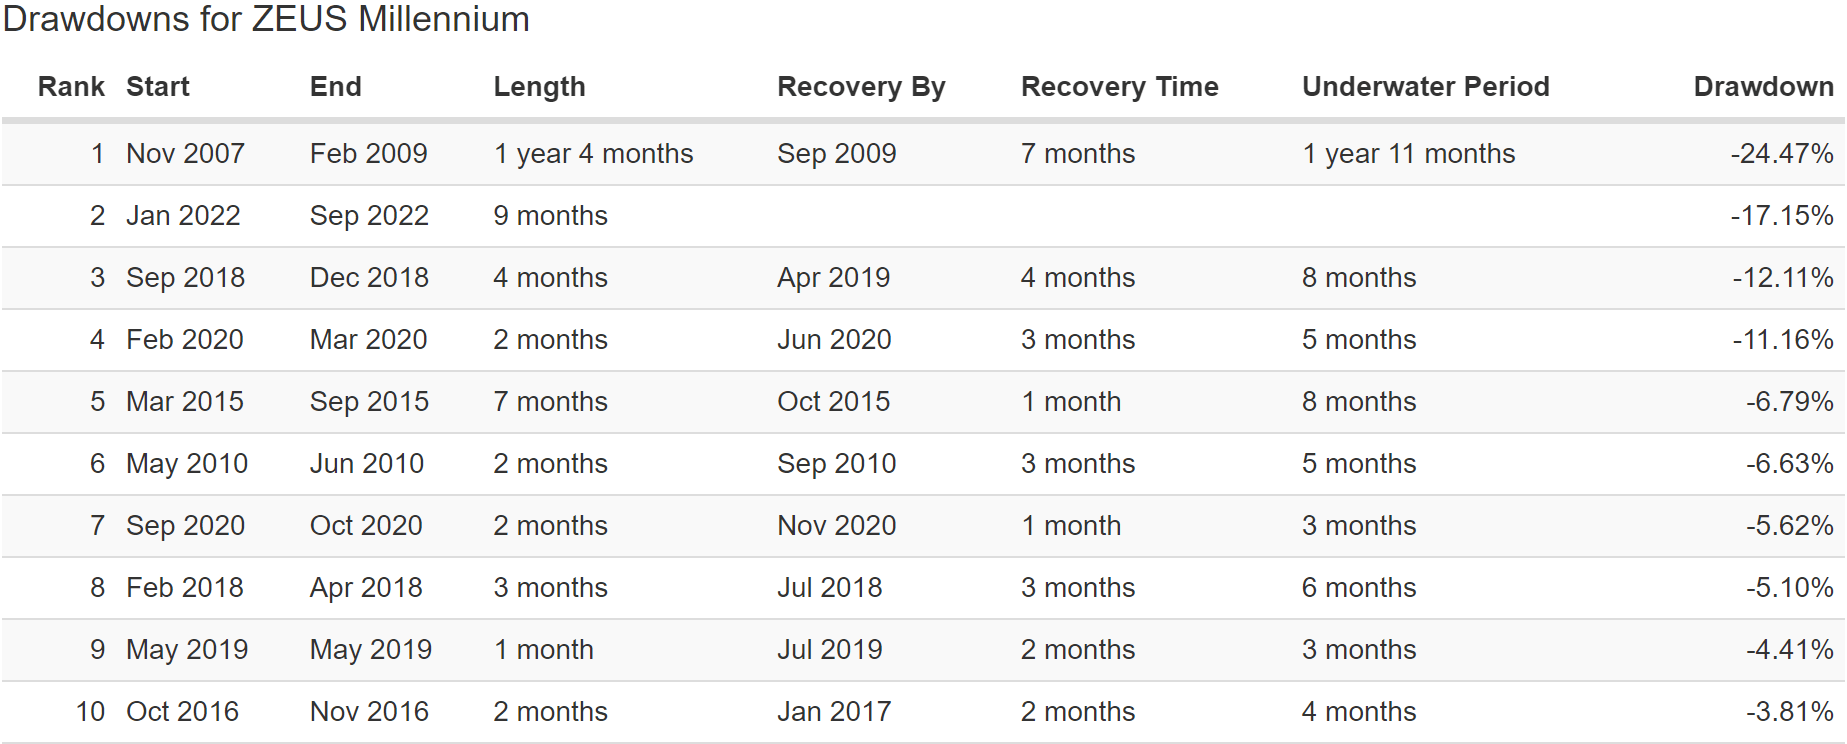
A 17% peak decline in this bear market.
- Nasdaq -35%S&P -28%
- 10 Millennial Dream Blue-Chips: -27%
- 60/40 -21%
Higher yielder than the market, better returns than the market, and with far less volatility than the market, including 50% smaller peak declines during the Great Recession, the 2nd largest market crash in US history.
This is the power of diversification.
This is the power of asset allocation.
This is the power of ZEUS.
Bottom Line: These 10 Millennial Dream Blue-Chips Could Help Anyone Retire Rich
Combining ultra-yield + hyper-growth is the best way to maximize long-term retirement income.
For those with a decade of longer until retirement, the power of triple dividend compounding can truly work miracles.
But that doesn’t mean you can’t enjoy a generous very safe yield from day one.
This is where ADSK, AMZN, TSM, ASML, LOW, MO, EPD, HIW, KEYUF, and BNS come in.
They represent 10 Millennial dream Ultra SWANs that offer:
- 4.4% very safe yield
- 20-year dividend growth streak
- BBB+ stable credit rating
- 15.6% CAGR long-term growth
- 20.1% CAGR long-term return potential (just as they’ve delivered since 1999)
- 25% annual income growth
If you can’t stand the high volatility that comes with owning such a concentrated portfolio, then using the ZEUS strategy can deliver 13% long-term returns with a 4.5% very safe yield along with 50% lower peak declines in even the most extreme market crashes.
Whatever your personal risk profile may be, the point is that when you own world-beater blue-chip assets, you don’t have to pray for luck, you make your own.
When you entrust your savings to the world’s best management teams, they work hard so one day you don’t have to.
That’s how you take charge of your financial destiny, make your own luck on Wall Street, and retire in safety and splendor.
Be the first to comment