US Dollar, S&P 500, China PMI, Coronavirus – Talking Points
- US Dollar may fall vs JPY, EUR and CHF if ISM statistics echo China’s suffering
- APAC stocks, commodity-linked FX suffered at the start of Asia’s Monday session
- EUR/USD broken descending resistance, aiming at key resistance – Will it hold?
ASIA-PACIFIC RECAP: MARKETS PANCIKING AFTER CHINESE PMI
The growth-oriented Australian and New Zealand Dollars fell against the anti-risk Japanese Yen early into Asia’s Monday trading session before modestly recovering later. APAC equities also expressed similar price action as part of a broad risk-off tilt in market mood following last week’s dismal publication of Chinese PMI data.
However, sentiment quickly recovered and Asian stock markets began to nurse their losses from the prior week. Some of the figures marked the weakest readings on record, and even surpassed prints released at the peak of the 2008 financial crash.
US DOLLAR MAY FALL IF US ISM DATA ECHOES CHINESE REPORT
The US Dollar may fall against the anti-risk, low-yielding Japanese Yen, Swiss Franc and Euro if local ISM data underwhelms and boosts Fed rate cut bets. The manufacturing and employment statistics for February are anticipated to print 50.5 and 47 readings, respectively. However, if China’s PMI data from last week was a prelude for others in the coming week, markets may experience another bout of risk-induced volatility.
While the US Dollar may rise against cyclically-sensitive assets – like NZD, AUD, NOK, SEK and emerging market FX – its may suffer against JPY, CHF and EUR. The interest rate differential between the latter group and USD means in the event of easing, the Greenback has a greater interest rate gap to adjust for relative to its anti-risk peers.
The downside adjustment in interest rates means USD has a far greater fall in yield relative to the Euro, Japanese Yen and Swiss Franc. On the other hand, growth-oriented currencies that are tied to outward-facing economies like Norway, Australia and New Zealand may fall vs USD. Pressure on their respective central banks to cut rates may be higher due to their comparatively more-sensitive position in the global supply chain.
EUR/USD PRICE CHART
After bottoming out at the lower lip of the three-year support range between 1.0783 and 1.0828, EUR/USD has jumped over 2.20 percent and shattered the December descending resistance channel along the way. Bullish price action may be predicated on fundamental catalysts in the week ahead which may be required if the pair is looking to break formidable former support-turned-resistance at 1.1091 (gold-dotted line).
EUR/USD – Daily Chart
EUR/USD chart created using TradingView
S&P 500 FORECAST
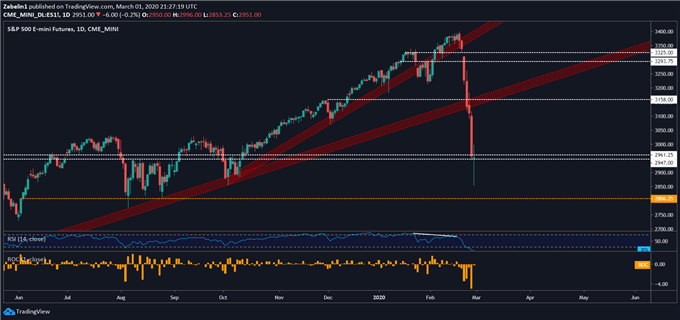
On Friday’s close, the S&P 500 index stopped just short of the lower tier of the multi-month support area between 2961.25 and 2947.00. The long wicks extending in both directions combined with the small body of the candle suggests an underlying feeling of indecision. Looking ahead, if the index breaks below support zone, the next major point of downside friction may be the floor at 2806.25 (gold-dotted line).
S&P 500 – Daily chart
S&P 500 chart created using TradingView
US DOLLAR TRADING RESOURCES
— Written by Dimitri Zabelin, Jr Currency Analyst for DailyFX.com
To contact Dimitri, use the comments section below or @ZabelinDimitrion Twitter


Be the first to comment