


DNY59
Reflexivity is a powerful driver of market moves but also the cause of pain for those who underestimate its dynamics.
As more investors increase exposure to low-volatility stocks and move their prices, their volatility increases, and rebalancing causes a reversal. In other words, the low-volatility trade reaches a point when it becomes a higher-volatility trade. Then, panic selling ensues, as investors realize the trade is unsustainable.
Last week, the iShares MSCI USA Min Vol Factor ETF (USMV) jumped 1.2%, due to a switch of investors’ preferences to low-volatility stocks.
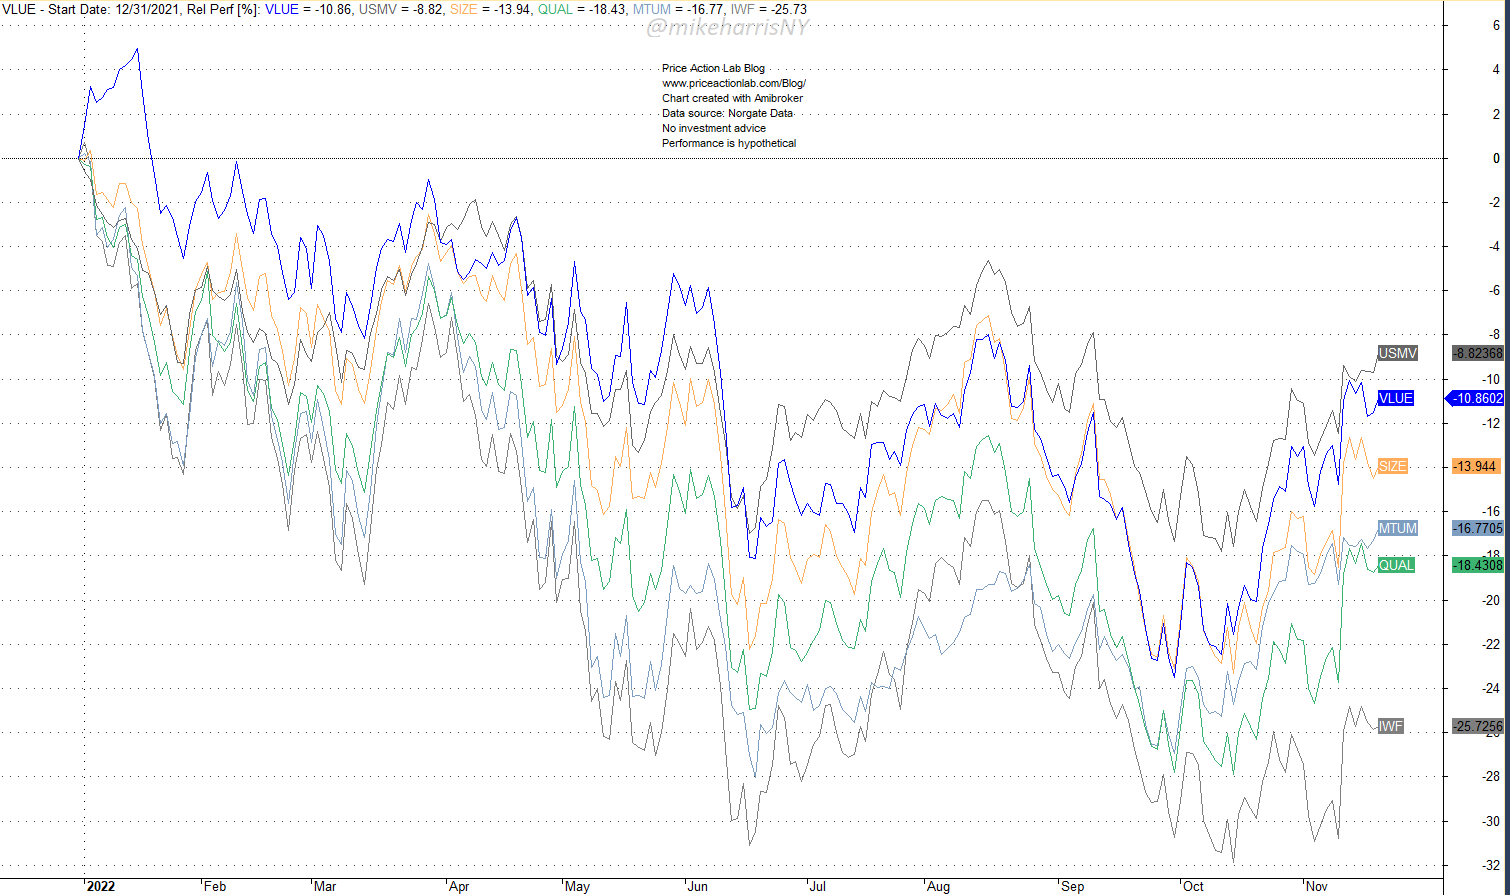
Year-to-Date Relative Performance Of Six Factor ETFs (Price Action Lab Blog – Norgate Data)
The min volatility factor is now outperforming the other five factors as of November 18, 2022. This factor is also outperforming the value factor (VLUE) that outperformed for a good part of the year. The worst performing factor is growth (IWF) with a year-to-date loss of 25.7%. Quality (QUAL) and Momentum (MTUM) are close, with losses of 18.4% and 16.7%, respectively. The size factor (SIZE) is down 13.9%, and the value factor is 10.8% in red.
The min volatility gains were expected based on historical analysis. Although the trade involves low-volatility stocks, it is a rather higher-risk trade, because it is driven by reflexivity and wishful thinking that the market has made a final bottom. But this is not how things have worked out in previous bear markets.
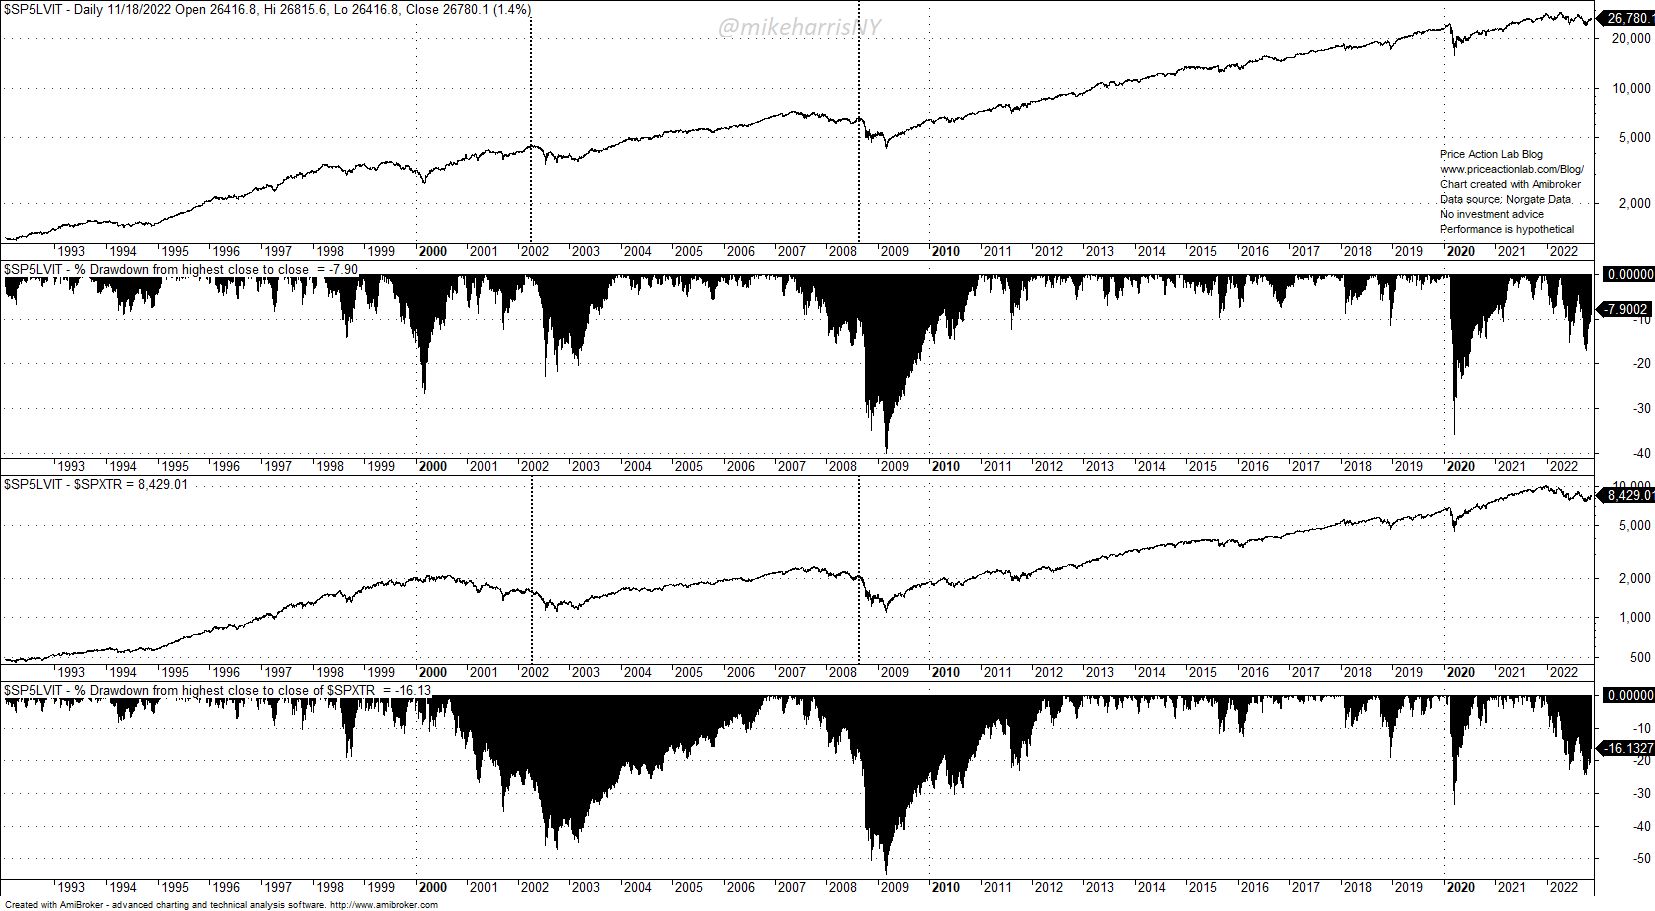
Daily Chart With Drawdown Profiles for S&P 500 Total Return and S&P 500 Low Volatility Total Return Indices (Price Action Lab Blog – Norgate Data)
This chart shows daily prices of the S&P 500 Total Return and the S&P 500 Low Volatility Total Return Indices along with their drawdown profiles since 1992.
Two vertical dotted lines mark periods when low volatility outperformed by a wide margin during the dot-com and GFC bear markets.
By April 10, 2002, the S&P 500 total return index drawdown was 24.1% but the S&P 500 Low Volatility total return index had made new all-time highs! Investors thought the new highs in low volatility signaled the bottom: Why would anyone be buying stocks if a bottom was not in place?
Unfortunately, by July 23, 2002, or a few months later, the S&P 500 Low Volatility total return index had fallen by 23%, and the S&P 500 total return was down 46.2%. The low volatility trade was crowded and unsustainable, while it was driven by wishful thinking.
Investors seem to repeat the same mistakes. During the GFC bear market and by August 27, 2008, the S&P 500 Low Volatility total return index had recovered to a drawdown of 9.9%, while the S&P 500 total return was down 16.6%, a situation that appears similar to the current.
But, by March 9, 2009, the S&P 500 Low Volatility total return index was down 40.4%!!! The S&P 500 total return was down 55.3%.
This last example was a devastating trade for low-volatility investors. The trade was reflexive and became crowded fast. The result was the low-volatility stocks became higher-risk stocks.
Below is a simple example of how volatility can turn into higher volatility. Although funds may use complex methods, for illustration purposes only I use the annualized 21-day volatility.
Gilead Sciences, Inc. (GILD) has the second-highest weight of 1.77% in the iShares MSCI USA Min Vol Factor ETF. Note that since October 13, 2022, when stocks found a bottom (we do not know if that is a final one), this stock has gained 27.9%.
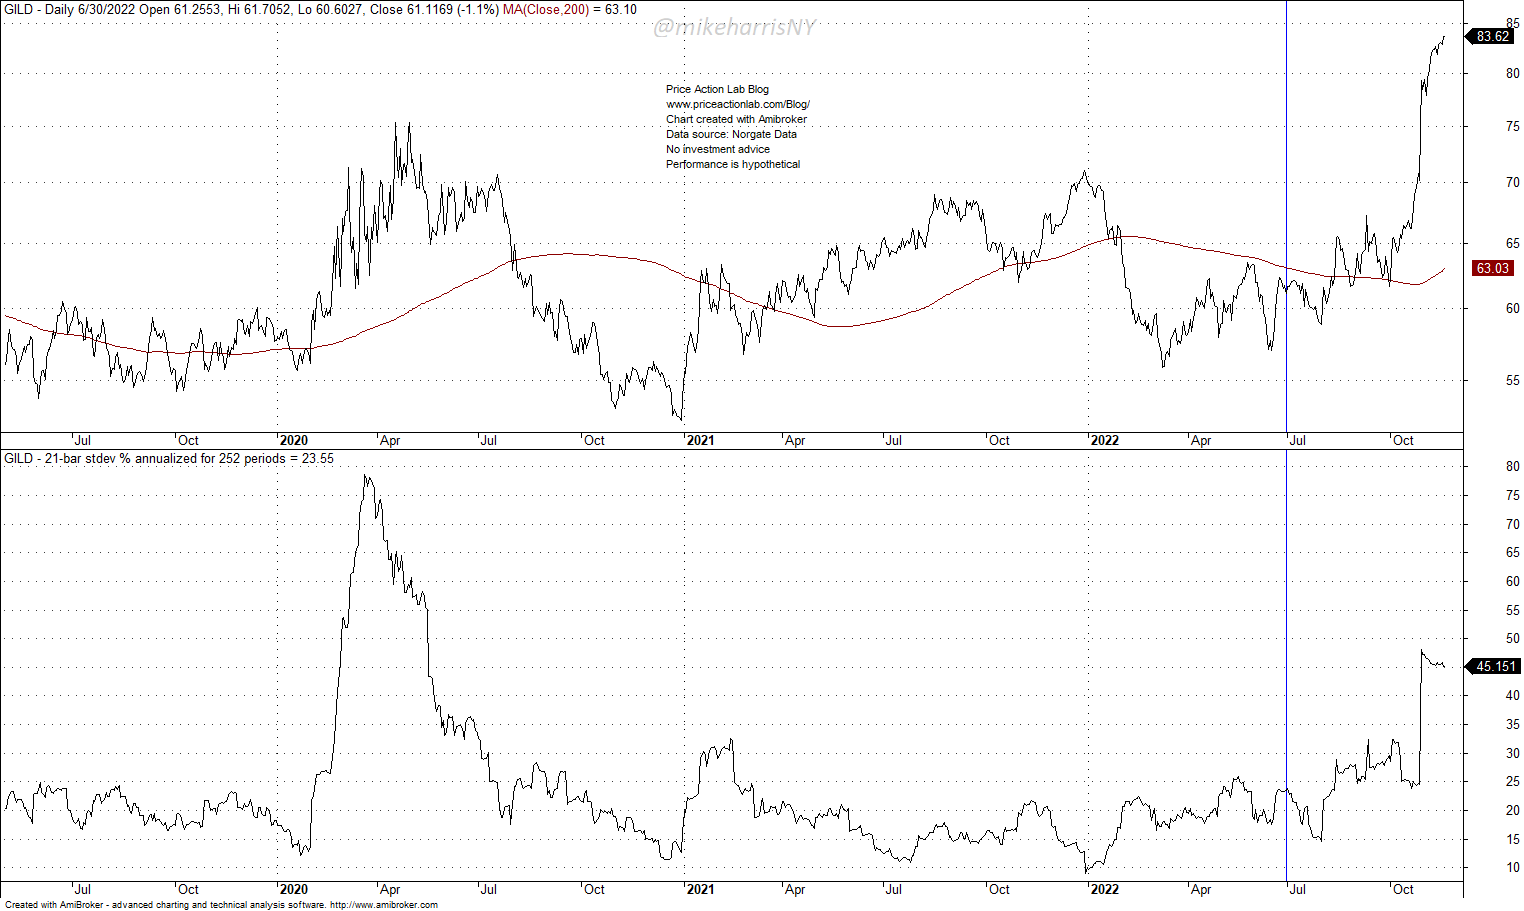
Daily Chart of GILD With Volatility (Price Action Lab Blog – Norgate Data)
Note that the VLUE ETF is rebalanced semi-annually. For illustration purposes, if we assume that the last rebalance date was June 30, 2022, the volatility of GILD was at 23.6%. As of November 18, 2022, the volatility has increased to 45.2%. This could mean that the weight of this stock in the min volatility factor ETF could drop, and as a result, the exposure will be decreased by selling shares.
Conclusion
Gains in low-volatility stocks during a bear market have not been a reliable indicator of a bottom in the past. One reason is that reflexive investing in low volatility to reduce portfolio risk causes the opposite effect if the trade becomes crowded. Diversification is superior to a switch to low-volatility assets. Higher volatility assets may provide better diversification at times. This has been the case this year with managed futures. It is correlation that counts, more than volatility. Focusing just on the volatility of assets could often lead to crowded trades, premature rebalancing, and eventually losses.
Be the first to comment