

Mario Tama
The 2022 bear market has taken the S&P 500 down ~12.5% over the past year. That being the case, and with the Federal Reserve indicating yesterday that more interest rate increases are very likely on the way, many investors may be looking to allocate capital to some lower risk/reward assets. Enter the Invesco S&P 500 Low Volatility ETF (NYSEARCA:SPLV). This fund invests in 100 securities from the S&P 500 Index with the lowest realized volatility over the past 12 months. It is re-balanced and reconstituted on a quarterly basis. As can be seen in the graphic below, the SPLV ETF significantly has outperformed the S&P 500 (by 13%+) over the past year:
Seeking Alpha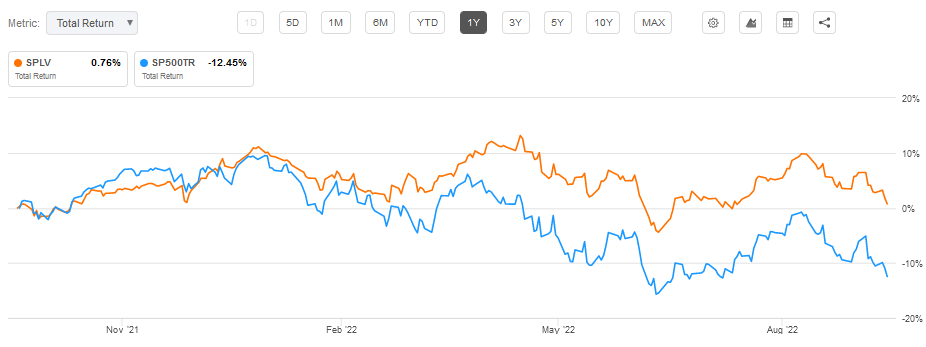
So let’s take a look at how the SPLV ETF has positioned investors for success going forward.
Top-10 Holdings
The top-10 holdings in the SPLV ETF are shown below and equate to what I consider to be a very well-diversified 12.1% of the entire 100-stock portfolio.
Invesco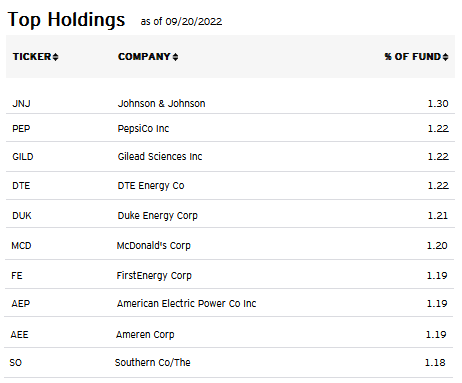
My first observation is that the S&P 500 Low Volatility Index is constructed in such a manner that the allocation percentage across the 100 companies in the index is rather flat as compared to many broad market ETFs. That is, the top holding in the SPLV ETF is Johnson & Johnson (JNJ) has only a 1.3% weight while the #100 holding is International Paper (IP) with a 0.75% weight. The point is that while the ETF may hold only 100 companies, it is still what I consider to be very well-diversified because the allocation of capital across those 100 companies is – on a relative basis – much more equal as compared to, say, the S&P 500, which has ~16.9% tied up in only three stocks (Apple, Microsoft, and Alphabet).
The second observation I have is that by virtue of its low-volatility thesis, the SPLV ETF is overweight in utilities, consumer staples, and health care companies. That is evident in the top-10 holdings and throughout the portfolio.
Indeed, utility companies make up 27.6% of the entire portfolio and 6 of the top-10 holdings: DTE Energy (DTE), Duke Energy (DUK), FirstEnergy (FE), American Electric Power (AEP), Ameren (AEE), and The Southern Company (SO). This is to be expected in an ETF that targets low-volatility stocks. It is also the source of much of the fund’s income (the 30-day yield is 2.43%). As can be seen in the graphic below, the utility sector, as measured by the Utility Sector SPDR ETF (XLU), has outperformed the S&P 500 by over 26% over the past year:
Seeking Alpha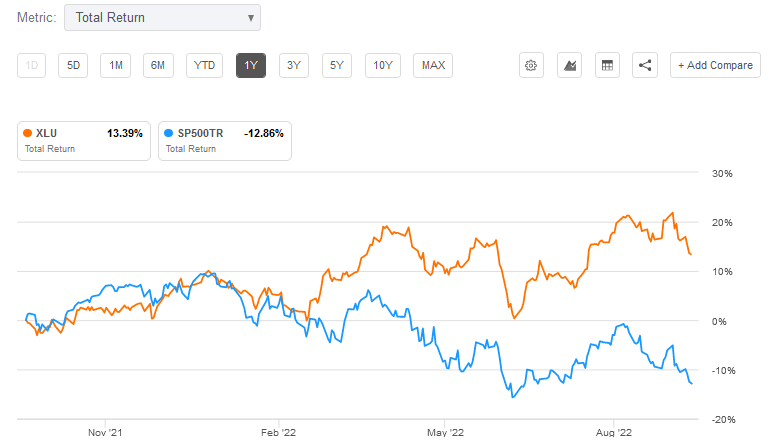
Consumer Staples companies have the next highest allocation within the SPLV portfolio, with a 19.2% weight. Once again, this is evident in the top-10 holdings with #2 holding PepsiCo (PEP) and #6 McDonald’s (MCD) which, in aggregate, account for 2.4% of the portfolio. Like the Utility Sector mentioned previously, the Consumer Staples Sector, as measured by the (XLP) ETF, has significantly outperformed the S&P500 during the 2022 bear market (by over 15%):
Seeking Alpha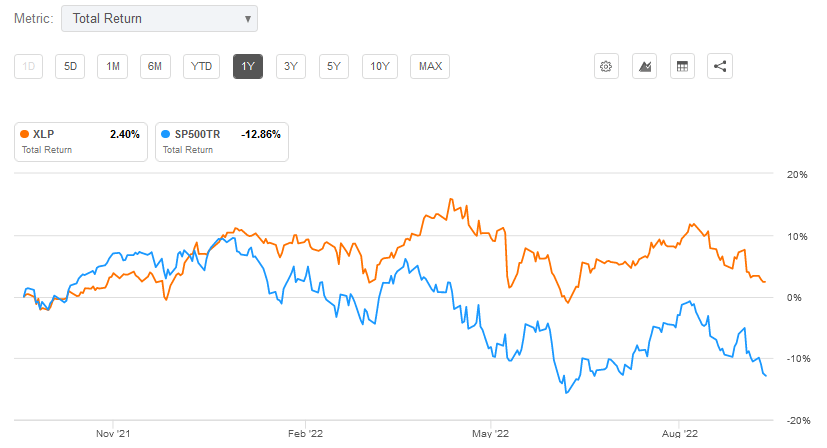
With a 13.9% weight, the third-largest allocation in the SPLV ETF is the Health Care Sector, represented in the top-10 holdings by JNJ and Gilead Sciences (GILD). It is somewhat surprising that relatively defensive big-pharma stocks are not represented in the top-10, but they have apparently been too volatile over the past few quarters to make an appearance in the top holdings.
For the portfolio as a whole, the Sector Allocation is shown below:
Invesco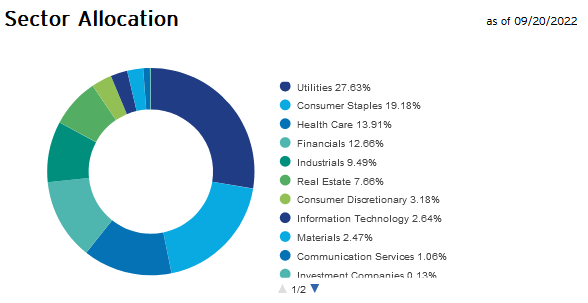
As can be seen in the graphic above, the SPLF ETF – through its thematic low-volatility slant – is overweight in the so-called “defensive” sectors that are relatively less impacted by high inflation and rising interest rates. As you probably know, the Utility Sector is considered to be defensive because consumers need electricity, gas, and water no matter what the state of the economy. Utilities stocks also typically throw off nice income, and many have inflation adjustments as a result of regulatory oversight.
Similarly, the Consumer Staples Sector is considered “defensive” because consumers need to eat and conduct daily personal hygiene no matter the state of the economy. Consumer Staples companies also have a reputation for being able to pass on rising costs directly onto consumers. Similar arguments can be made for the Health Care Sector, which is 12.9% of the SPLV ETF.
The fourth-highest allocation in the SPLV ETF is to the Financial Sector (12.7%). Financials are considered to be a good place to be in a rising interest rate environment because they generate profits off the net-interest rate margin. That is, the interest rate differential between the interest rate that they are able to borrow money at as compared to the (higher) interest rate they can get from lending (mortgages, car loans, etc.).
Performance
The (monthly) long-term performance of the SPLV ETF is shown below:
Invesco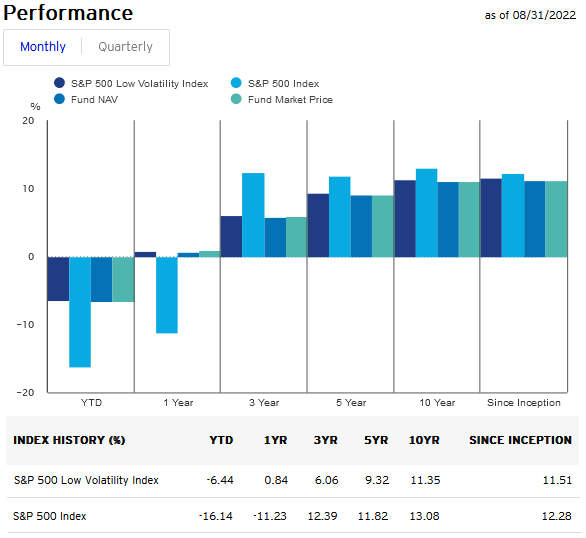
Note that – since inception – the fund has lagged that of the S&P 500 by 77 basis points and over the past 10 years by 173 basis points. That said, the 11.35% average annual return over the past 10 years is a very solid performance track record in my opinion. In addition, many investors may well find the significant out-performance during the recent bear market to be a very attractive way to smooth out their portfolio’s returns during times of high market volatility.
Risks
While the companies in the SPLV low-volatility ETF are generally less affected by high-inflation and a rising interest rate environment as compared to the broad market averages, they are still not immune to the negative impact these factors have on the domestic and global economies. Also, COVID-19 related shut-downs in China and supply-chain disruptions can negatively impact the sales and operations of companies in the portfolio with international operations. In addition, the strong US dollar is another stiff headwind for companies with significant international sales.
The SPLV ETF has a market value of $10.5 billion and has an average daily trading volume of ~3.2 million shares. That being the case, I see very little liquidity issues with this fund.
Summary & Conclusions
While the 0.25% expense fee of the SPLV is quite high relative to many cost-efficient funds (the Vanguard S&P 500 ETF has a 0.03% fee), I can’t argue with this fund’s long-term performance track record. I find the portfolio, and its defensive sector allocation, to be very attractive given the current rising interest rate environment. As a result, I think SPLV is likely to continue to outperform the S&P 500 over the next twelve months. That being the case, I rate SPLV as a BUY.
I’ll end with a long-term price chart of the SPLV ETF:
Seeking Alpha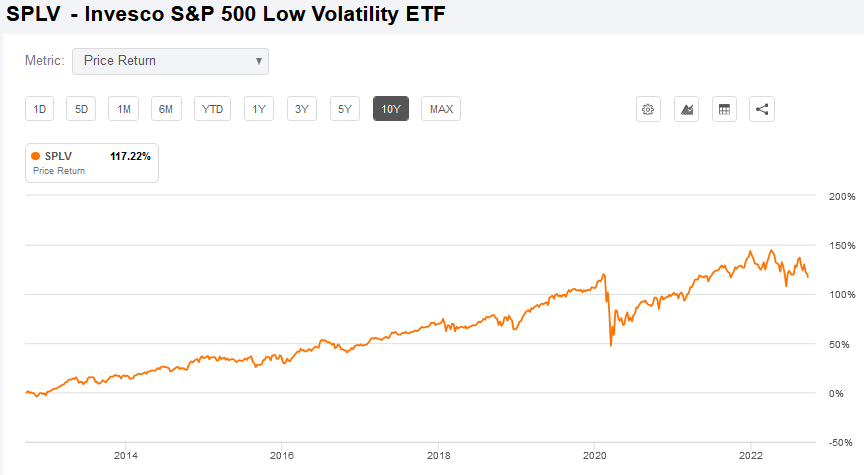
Be the first to comment