

Petmal
Written by Nick Ackerman, co-produced by Stanford Chemist. A version of this article was published to members of the CEF/ETF Income Laboratory on September 8th, 2022.
BlackRock ESG Capital Allocation Trust (NYSE:ECAT) launched around one year ago. Since then, the results have been rather lackluster. However, that seems to be a function of bad timing rather than anything fundamentally wrong with the fund. Despite the fund’s ESG focus, we see a lot of familiar names that any investor could recognize. They invest in mostly large-cap names at this time, with a greater focus on equity over credit investments.
We last looked at the basics of this fund in March for our initial coverage. Today, we can look at the performance since then, the distribution and its coverage, as well as any position changes that might seem material.
Naturally, there are a lot of similarities between ECAT and BlackRock Capital Allocation Trust (BCAT), which we also just looked at recently. That fund launched around a year earlier than ECAT, in September 2020. We’ll be looking at several comparisons between these two funds too.
The Basics
- 1-Year Z-score: N/A
- Discount: 18.23%
- Distribution Yield: 8.89%
- Expense Ratio: 1.35%
- Leverage: N/A
- Managed Assets: $1.786 billion
- Structure: Term (anticipated liquidation date September 27th, 2033)
ECAT has a fairly basic investment objective; “to provide total return and income through a combination of current income, current gains and long-term capital appreciation.” This is essentially copy-paste from most of their other funds.
To achieve this, the fund will “invest in a portfolio of equity and debt securities. Generally, The Trust’s portfolio will include both equity and debt securities. At any given time, however, the Trust may emphasize either debt securities or equity securities. The Trust will invest at least 80% of its total assets in securities that, in the Advisor’s assessment, meet the environmental, social and governance criteria as described in the Trust’s Prospectus and shareholder reports.”
The fund launched with a significant amount of capital, that’s generally a common occurrence with BlackRock (BLK) funds. That’s certainly a benefit of being the largest asset manager in the world; you have a lot of connections. Therefore, due to the size of the fund, plenty of liquidity is provided for most retail investors. That’s even despite the struggles the fund has been going through since its launch, which has reduced its size. BCAT is a similar size with around $1.927 billion AUM.
ECAT doesn’t intend to utilize any leverage. BCAT does utilize leverage and adjusts what would seem fairly drastically, as we noted recently. With no leverage, ECAT doesn’t have to worry about added leverage expenses due to higher interest rates. During a bear market, it can also be seen as a positive as the fund should be relatively less volatile too.
ECAT Fund Performance – A Discount Worth Paying Attention To
As I mentioned, the fund has been quite a struggle. That being said, it has done relatively well compared to the broader market as measured by the S&P 500. Here is the performance from our previous posting to today.
ECAT Performance Since Prior Coverage (Seeking Alpha)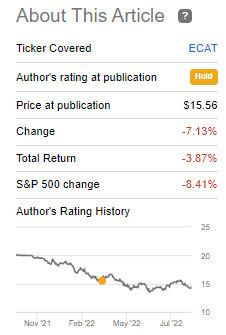
We can look at a comparison between the SPDR S&P 500 (SPY), and we will also include the Vanguard Total Bond Market Index Fund (BND) and the iShares iBoxx High Yield Corporate Bond Fund (HYG) since ECAT’s launch. I’m including both BND and HYG as the fund’s portfolio is split between investment-grade and below-investment-grade bonds. I’ll also include BCAT to see how this fund compared to its sister fund.
Ycharts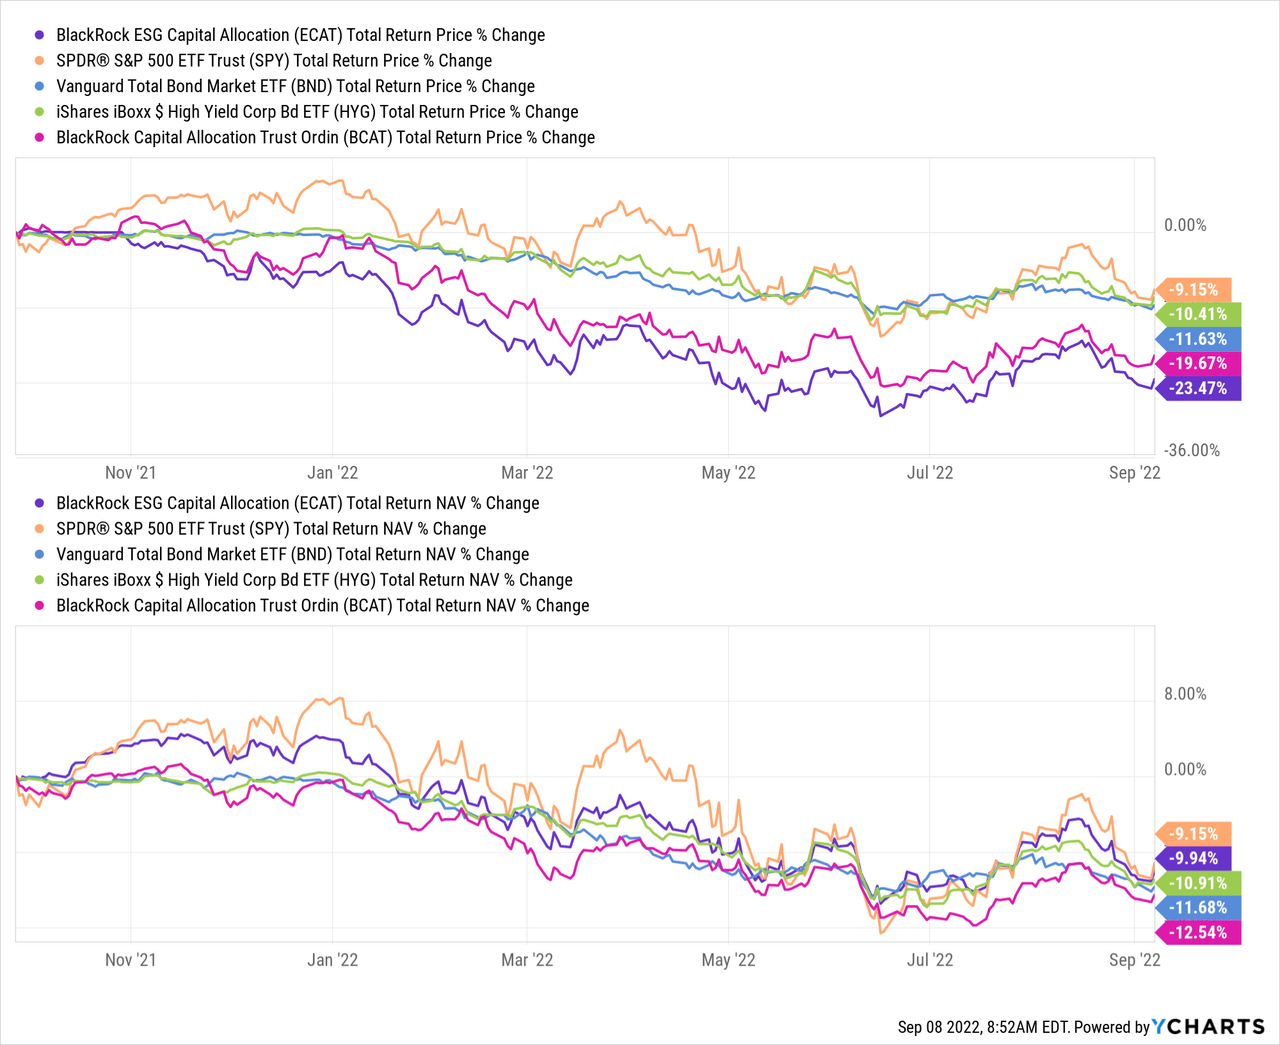
What we can see is that the results have been quite encouraging on a total NAV return basis. Remember, the NAV is what the fund managers can basically control directly as that shows their performance. The share price, if all things go well, should follow this. The fund might have underperformed SPY, but we can see that HYG and BND have as well. Since ECAT has a bit of exposure to these types of assets, too, it isn’t too surprising to see these results. Performing the worst during this rather arbitrary time period was BCAT. BCAT has favored fixed-income exposure over equity at this time.
The fund also still has some cash exposure which isn’t represented in the chart above. It is capital that they could put to work at these cheaper valuations in the equity and bond market, though.
We can often see wide discounts open up on newer funds. For ECAT, this is easily being reflected by simply looking at the total share price performance. It has performed more than doubly as poorly, which has opened up the opportunity we see in ECAT today – as well as BCAT.
Both of these funds have gone to some significant discounts but seem to be bouncing around the 16 to 18% levels lately. Deeper discounts from here, at this point anyway, were struck on mostly short-lived dips. These dips lower were more consistent with the broader market as well, where in May and June, the market reached new lows.
Ycharts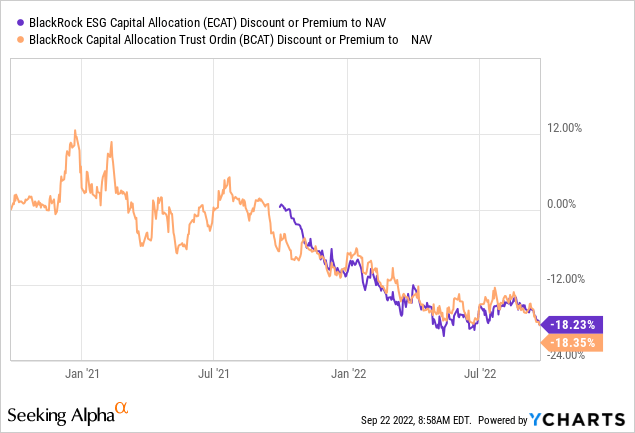
Distribution – Still Reasonable
The fund has maintained the same $0.10 monthly distribution since the launch. That currently works out to an 8.89% distribution yield. On a NAV basis, due to the significant discount only comes to a 7.27% distribution yield. For the most part, that seems quite reasonable.
With a significant amount of exposure to equity investments, a lot of the distribution will be covered if they are able to provide capital gains. In the current market, that can become quite difficult. That’s why it isn’t too surprising to see that they weren’t able to provide any realized gains during the period.
ECAT Semi-Annual Report (BlackRock)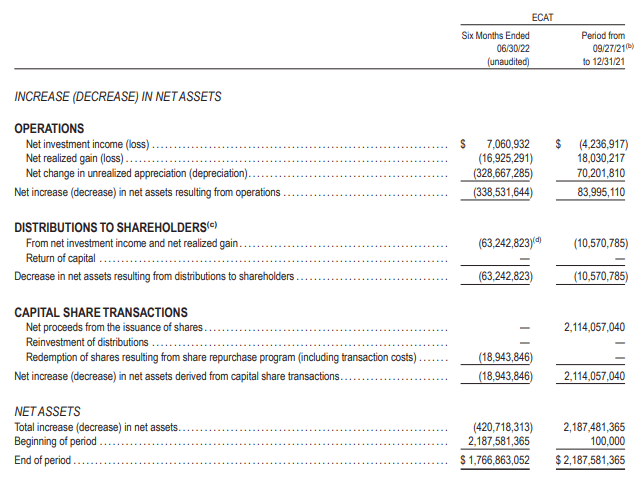
Net investment income coverage has improved massively. However, that seems to be more of a function that the portfolio is up and running now. The previous “fiscal year” was an abbreviated period. Just three months where they were still putting most of their capital to work. Though it is also worth noting that besides still having a fairly sizeable allocation to cash, at the end of January, they were sitting at nearly 30% in cash.
NII coverage at just 11.16% means they still have a lot of work to do in terms of covering their distribution. The cash they’ve put to work and continue to put to work should see NII increase again in the next report.
Helping to reduce what ultimately ended up as realized losses were the fund’s currency contracts and options writing. That’s similar to what we saw for BCAT too, but they actually had foreign currency contracts play out positively, as well as a significant boost from the futures contracts and swaps. For ECAT, their foreign currency transactions and swaps resulted in negative results.
ECAT Semi-Annual Report (BlackRock)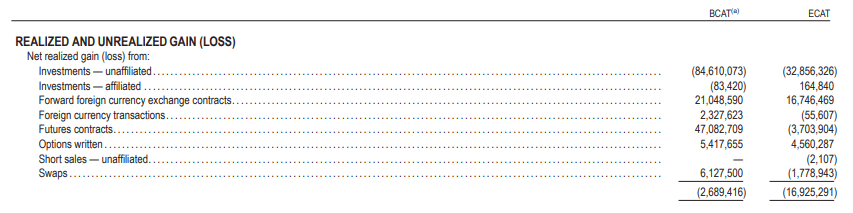
It’s quite surprising the stark contrast here between one fund producing positive results from these derivatives and another resulting in losses. They have almost the same managers, only Kate Moore is on ECAT, but Rick Rieder, David Clayton and Russ Koesterich are on both these funds. A good reminder that while on the surface, ECAT and BCAT might share some similarities but become quite different funds looking into them.
Overall, I wouldn’t be overly concerned with whether an adjustment in the distribution is needed yet. However, at some point, gains will be required, and they have the tools to deliver those in a variety of ways.
ECAT’s Portfolio
One of those differences we start to see between ECAT and BCAT on the surface would be asset positioning. Both funds are multi-asset funds, but ECAT favors equities over fixed-income. BCAT has a higher allocation to fixed-income assets over equity.
ECAT Asset Weighting (BlackRock)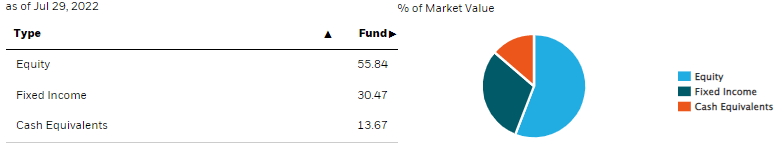
ECAT was in a position where they could put more capital to work at the end of July with an over 13.5% cash allocation. In fact, that’s exactly what they appeared to do through August, as they are now showing a slight negative allocation to cash. A good reminder of how dramatic the shifts in this fund can be.
ECAT Asset Weighting (BlackRock)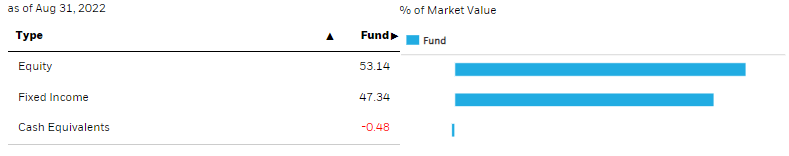
BCAT is still down to very minimal leverage, and they intend to utilize leverage. So they also can get quite aggressive if they feel that valuations make sense to do so.
The geographic allocation for both of these funds favors North American assets, which would presumably be primarily made up of U.S.-based investments.
ECAT Geographic Breakdown (BlackRock)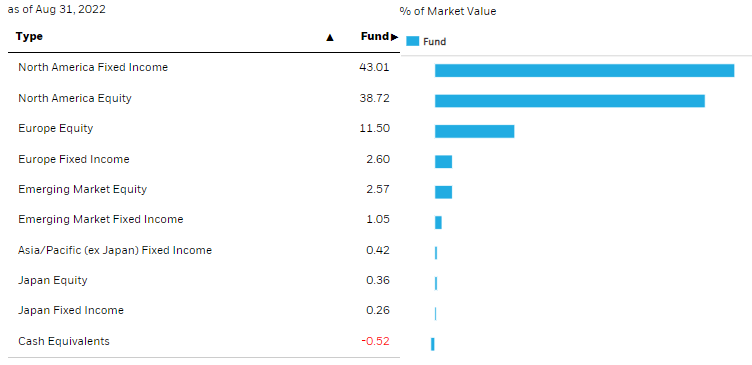
The equity positioning in sector weightings shows quite a difference. Both of these funds favor tech positions, but for ECAT, they go much in much higher allocations. Tech exposure for BCAT comes to 6.37%, followed by 5.39% in consumer discretionary and 5% in financials. This is presumably due to the overweight equity weighting compared to BCAT. However, I wouldn’t say they aren’t just as diversified. They have enough exposure here through the other sectors, which leaves the fund relatively balanced.
ECAT Equity Allocation (BlackRock)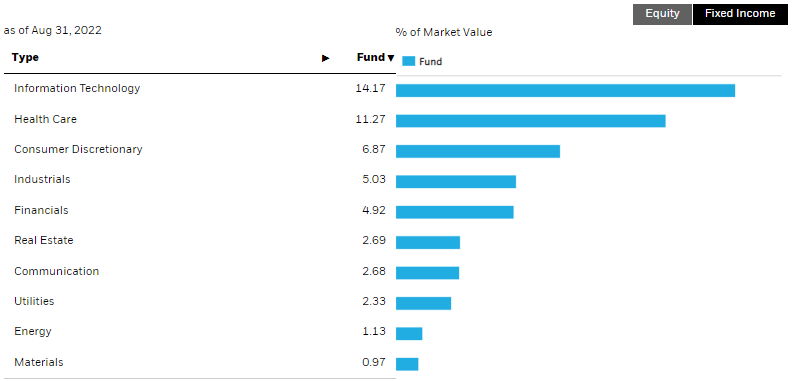
Of course, helping provide that diversification and overall balance would be the weighting in fixed-income allocations too.
ECAT Fixed-Income Allocation (BlackRock)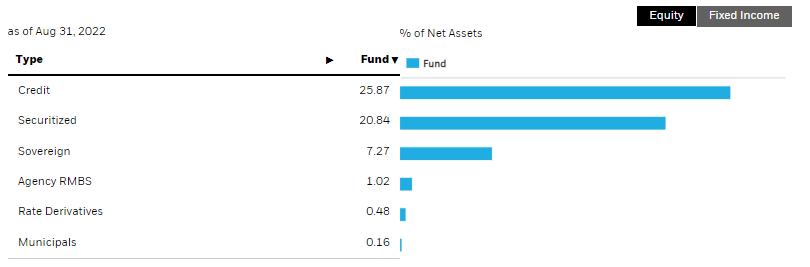
Here we see a solid weighting for credit over securitized investments. These two categories are relatively more balanced for BCAT due partially to the heavier fixed-income exposure. BCAT also has a higher allocation to sovereign debt investments. As a reminder, credit here means bonds or loans. Securitized are pooled debt investments such as CLOs, CMOs and MBSs.
CAT’s average market cap for the underlying holdings comes to $297.756 billion. For BCAT, this figure comes in at $243.212 billion. That means both funds invest primarily in large-cap names, but ECAT has invested in relatively larger companies.
This is also where it gets a bit interesting since this fund is supposed to have an “ESG” focus. When looking at the top fixed-income positions, it is unclear where the ESG is coming into play.
ECAT Top Ten Fixed-Income Positions (BlackRock)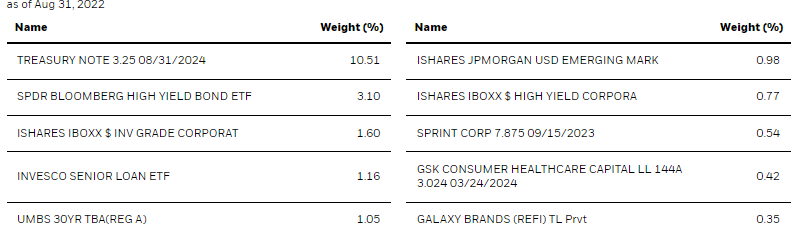
First off, several of these positions are just ETFs that the fund is holding, including HYG and the cousin fund, iShares iBoxx Investment Grade Corporate Bond Fund (LQD). There is also exposure to iShares JPMorgan USD Emerging Markets Bond (EMB)
So while we are getting a nice balanced and diversified pool of assets while holding ETFs, this positioning to me isn’t screaming ESG. This is the type of positioning that the people throwing around “get woke, go broke” can’t even get worked up about.
This is similarly the case with the fund’s top equity positions.
ECAT Top Ten Equity Positions (BlackRock)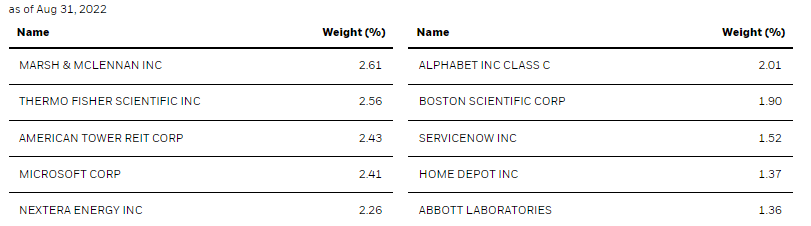
While Microsoft (MSFT), Alphabet (GOOG) (GOOGL) and Home Depot (HD) are all household names with a focus on all stakeholders, are we really getting ESG with these names? I wouldn’t think so.
The only name that first jumps out to me as ESG would be NextEra Energy (NEE). NEE is one of the world’s largest producers of clean and renewable energy. As a utility stock, it is richly valued relative to peers, but it continues to keep its premium up.
Admittedly, I’m not on either side of ESG or non-ESG investing; I just want to invest in whatever makes people money and meets their objectives. In the case of ECAT, though, the term ESG seems to be thrown around here pretty loosely. When looking at its largest holdings, I view it like any other multi-asset fund. In my opinion, it isn’t a negative, but so far, the “ESG” here hasn’t really meant anything. I’ll be interested to see if that changes over time.
The fund’s positioning is quite similar to what we saw at the end of last year. The major differences appear to come in the weighting of the positions. The allocations have come down for most of these top ten, which helps indicate that they’ve spread their portfolio out amongst a large group of positions. The top ten represent 22.95% of the portfolio, while it was previously 49.46%.
Conclusion
ECAT is an interesting fund, but if you are looking for ESG specifically, I wouldn’t say this is it. Instead, this is an interesting fund based on the multi-asset approach that provides flexibility for the portfolio. The deep discount that has opened up is making it a compelling investment at this time. The fund has been doing just fine, relatively speaking, and is likely just reflecting the struggles we see in broader equity and debt investments.
Be the first to comment