

franckreporter/iStock via Getty Images
Prices change when events are different from what the market has expected them to be. – Peter Bernstein
Why SPLV?
Long-term wealth generation is an art that requires investors to adroitly juggle offense and defense; I find that some of the younger stakeholders in the market tend to be too myopic at times, focusing only on the home runs, whilst paying scant attention to building any sort of defensive shield when the going gets tough.
The Invesco S&P 500 Low Volatility ETF (NYSEARCA:SPLV) appears to be a vehicle that has the ingredients to help investors cope during difficult market conditions. This is a popular defensive product (having accumulated close to $9bn of AUM over nearly 11 years) that focuses on 100 securities of the S&P 500 that have exhibited the lowest realized volatility over the past 12 months (weights are based on the inverse of each security’s volatility, with the least volatile securities receiving the highest weights). You’re looking at quite an updated portfolio as it gets reconstituted and rebalanced four times in a year, and the most recent exercise only took place last month.
We’ve already seen the utilitarian qualities of this ETF come to the fore this year; it’s well documented that 2022 hasn’t been a particularly serene year for the markets. On a YTD basis, the VIX has expanded by ~37%; interestingly, during this time, we’ve seen the traditionally popular growth segment of the S&P 500, as represented by the Invesco S&P 500 High Beta ETF (SPHB), loses its AUM by an identical percentage amount. Meanwhile, our defensive vehicle – SPLV, whilst not pulling any trees, has seen its AUM being maintained during the same period.
YCharts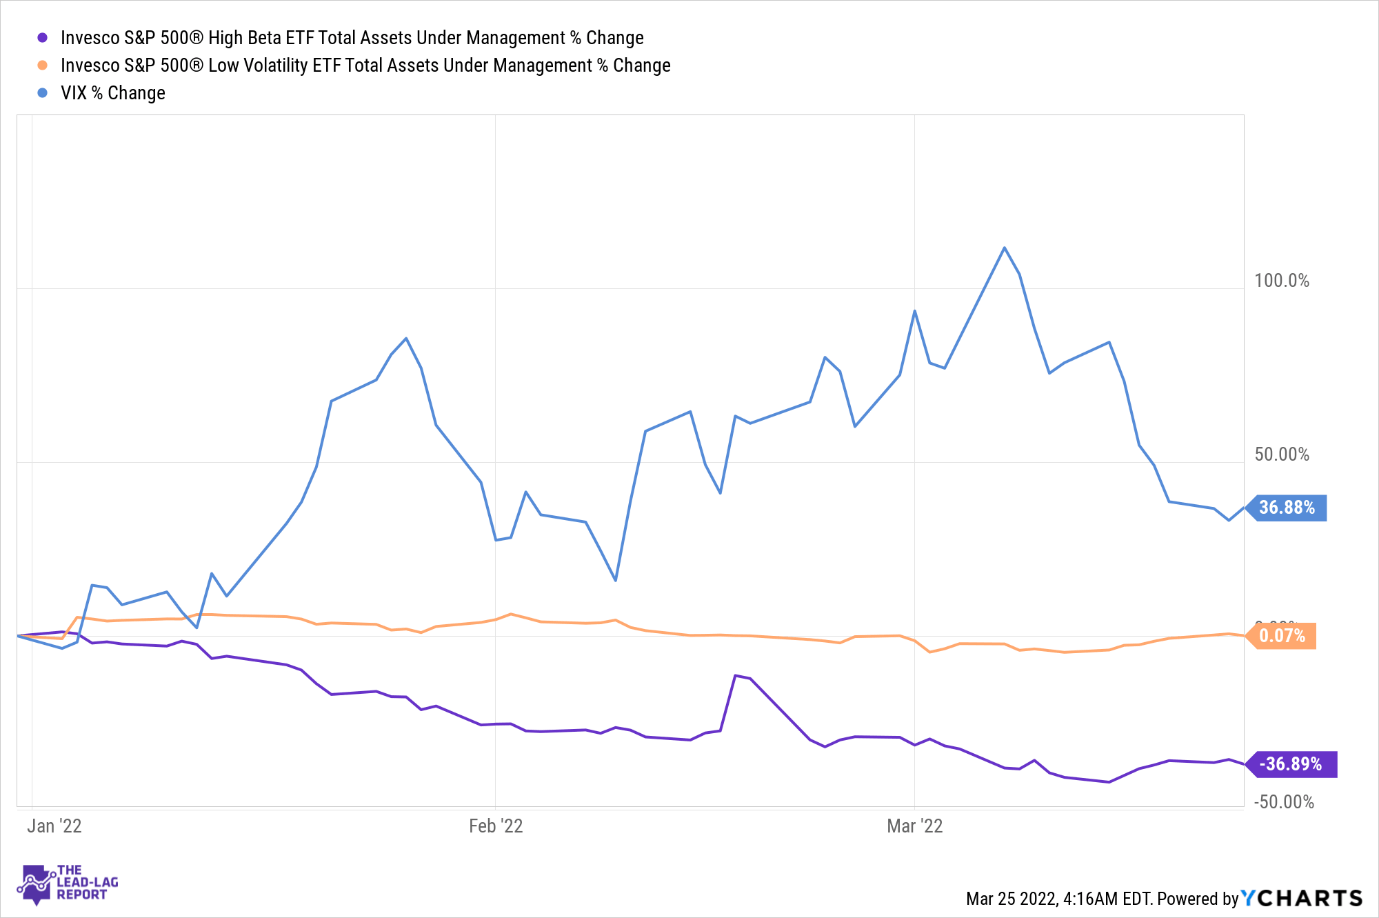
SPLV’s useful qualities in an environment such as this can also be viewed over a much longer time frame and will give you a sense of what sort of product you’re looking at. If you consider a 10-year lookback period, note that SPLV’s annualized standard deviation of its monthly returns is only roughly half as much as SPHB’s figure. Crucially also note SPLV’s superior Sortino ratio, which gives you a sense of the ability of an ETF to juggle downside deviation, or harmful volatility, in its question to engender excess returns. Also, note that the max drawdown with the low-beta cohort of SPLV has been a lot less pronounced than SPHB.
YCharts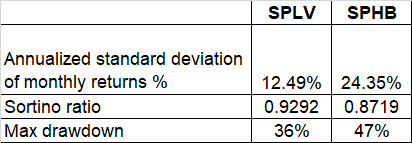
Then, I do acknowledge that you won’t quite get the heady earnings growth runaway that the constituents of SPHB can offer you, but I don’t think you can cast off the income yielding qualities of some of SPLV’s top holdings, which will serve as a very useful cushion during choppy market environments or prolonged drawdowns.
For instance, consider SPLV’s top holdings; with the exception of perhaps The Hershey Co., all these other stocks currently offer forward yields that are better than the median of the sector they belong to (Procter & Gamble’s (PG) variance is hardly meaningful).
Seeking Alpha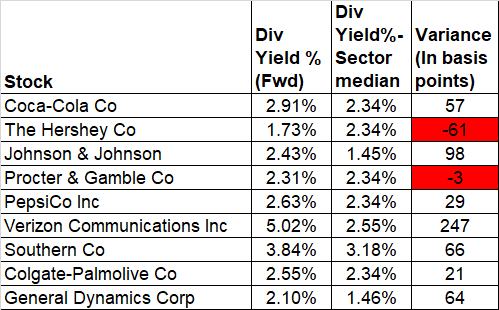
SPLV is dominated by two sectors in particular; utilities which account for ~24% of the total portfolio and consumer staples which account for 23% of the total portfolio. As noted in the Leaders/Laggers section of The Lead-Lag Report, (where I compare different segments of the market to the SPY), the long-term conditions for both these sectors look relatively healthy.
Conclusion
Subscribers of The Lead-Lag Report would acknowledge that I use a series of time-tested, inter-market signals to gauge relative conditions of volatility, and based on these signals, I advise investors to play offense or defense.
Twitter
Now even though 2022 so far has been hard enough for equity investors to navigate, I still believe a more profound risk-off environment is brewing, which could raise the allure of an SPLV even more. Why do I think so?
Well, consider the economic outlook, which is likely to turn south in the months ahead; Q1 GDP expectations have quickly dropped from 3% at the start of the year to anything between 1.3%-1.7%. This also makes the IMF’s FY forecast of 4% seem particularly far-fetched. As noted in the recent edition of The Lead-Lag Report, I also don’t think you can be particularly calm about growth expectations when the Fed appears to be moving quite aggressively with rates. Powell has been implying that the Fed will likely engage only in quarter-point rate increases at each of the remaining Fed meets this year, but clearly, the futures market isn’t buying this, and rather, what you’re looking at is, a 40% expectation that we will get 50bps hikes in May and June (the likes of Governor Bullard and Waller too have posited this).
Tighter monetary conditions and slowing growth are just the right concoction for recession risks to pick up and you’re seeing this being reflected in trends in the bond market where the treasury yield curve is flattening, and we’re not too far away from seeing the 10Y/2Y inverting.
Stockcharts.com
Finally, also note the scope for mean reversion with something like SPLV as investors potentially rotate out of SPHB. Currently, SPLV’s relative strength ratio vs SPHB looks quite some way from the normalized range, and this could tempt defensively-minded value hunters to come on board.
 Anticipate Crashes, Corrections, and Bear Markets
Sometimes, you might not realize your biggest portfolio risks until it’s too late.
That’s why it’s important to pay attention to the right market data, analysis, and insights on a daily basis. Being a passive investor puts you at unnecessary risk. When you stay informed on key signals and indicators, you’ll take control of your financial future.
My award-winning market research gives you everything you need to know each day, so you can be ready to act when it matters most.
Click here to gain access and try the Lead-Lag Report FREE for 14 days.
Be the first to comment