

asbe/iStock via Getty Images
This dividend ETF article series aims at evaluating products regarding the relative past performance of their strategies and quality metrics of their current portfolios. As holdings and their weights change over time, I may update reviews, usually once a year.
PEY Strategy And Portfolio
The Invesco High Yield Equity Dividend Achiever ETF (NASDAQ:PEY) has been tracking the NASDAQ US Dividend Achievers 50 Index since 12/09/2004. It has 50 holdings, a distribution yield of 4.01% and a total expense ratio of 0.53%.
As described on Invesco’s website,
The Index is comprised of 50 stocks selected principally on the basis of dividend yield and consistent growth in dividends. The Fund and the Index are reconstituted annually in March and rebalanced quarterly.
The fund invests exclusively in U.S. based companies of all size segments.
Asset value by market capitalization (chart: author; data: Fidelity)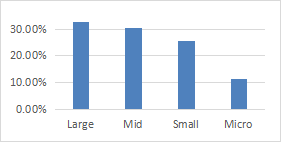
The heaviest sectors are utilities (24.7%), financials (21.4%) and consumer staples (17.3%). Other sectors are below 9%. Compared to the S&P 500 (SPY), the fund overweights these three sectors, and underweights technology, consumer discretionary, healthcare and communication services a lot.
Asset value by sector (Chart: author; data: Fidelity)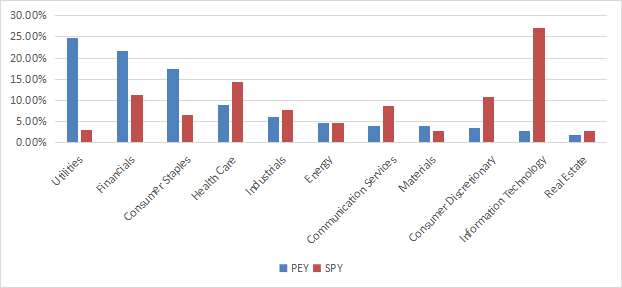
The top 10 holdings, listed in the next table with some fundamental ratios, represent about 27% of asset value. The largest holding weighs 3.2%, so risks related to individual stocks are low.
|
Ticker |
Name |
Weight% |
EPS growth %TTM |
P/E TTM |
P/E fwd |
Yield% |
|
Altria Group Inc |
3.23 |
-29.52 |
28.72 |
9.70 |
7.63 |
|
|
Universal Corp |
3.09 |
-1.40 |
16.37 |
N/A |
5.56 |
|
|
International Business Machines Corp |
2.95 |
1.82 |
22.18 |
13.87 |
4.88 |
|
|
Exxon Mobil Corp |
2.79 |
234.97 |
15.88 |
9.38 |
3.67 |
|
|
Healthcare Services Group Inc |
2.76 |
-68.41 |
37.15 |
26.32 |
5.26 |
|
|
Unum Group |
2.62 |
17.48 |
7.45 |
6.50 |
3.56 |
|
|
Northwest Bancshares Inc |
2.54 |
32.18 |
11.06 |
13.53 |
6.49 |
|
|
Pinnacle West Capital Corp |
2.44 |
7.63 |
13.45 |
17.76 |
4.77 |
|
|
Philip Morris International Inc |
2.42 |
4.39 |
17.05 |
17.90 |
5.08 |
|
|
LyondellBasell Industries NV |
2.34 |
150.50 |
5.56 |
5.80 |
4.88 |
Historical Performance
Since inception in December 2004, PEY has underperformed SPY by 2.71 percentage points in annualized return, with a higher risk measured in volatility (standard deviation of monthly returns) and maximum drawdown.
|
Total Return |
Annual.Return |
Drawdown |
Sharpe ratio |
Volatility |
|
|
PEY |
180.56% |
6.08% |
-73.43% |
0.39 |
17.35% |
|
SPY |
336.57% |
8.79% |
-55.42% |
0.6 |
15.02% |
Data calculated with Portfolio123
However, PEY has beaten SPY by a wide margin in 2022 year-to-date (-1.8% vs. -20.9% from 1/1 to 6/13).
The next chart plots the equity value of $100 invested in PEY and SPY since PEY inception, with all dividends reinvested.
PEY vs. SPY (Chart: author: data: Portfolio123)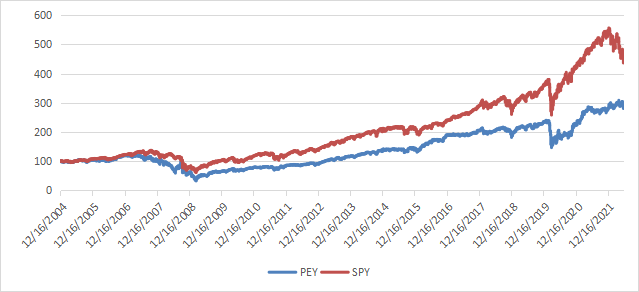
Scanning The Current Portfolio
PEY holds 50 stocks. It is much cheaper than the S&P 500 regarding the usual valuation ratios (see next table).
|
PEY |
SPY |
|
|
Price / Earnings TTM |
13.35 |
20.05 |
|
Price / Book |
1.65 |
3.85 |
|
Price / Sales |
1.07 |
2.58 |
|
Price / Cash Flow |
10.18 |
15.55 |
In previous articles, I have shown how three factors may help cut the risk in a dividend portfolio: Return on Assets, Piotroski F-score, Altman Z-score. My core portfolio holds 14 stocks selected using these metrics (more info at the end of this post). I have scanned PEY holdings with these quality metrics. I consider that risky stocks are companies with at least 2 red flags among: bad Piotroski score, negative ROA, unsustainable payout ratio, bad or dubious Altman Z-score, excluding financials and real estate where these metrics are less relevant. With these assumptions, 9 stocks are risky, and they weigh about 17% of asset value, which is not very good.
Based on my calculation, aggregate Altman Z-score, Piotroski F-score and return on assets are below SPY’s aggregate values. These metrics point to a portfolio quality inferior to the benchmark.
|
PEY |
SPY |
|
|
Altman Z-score |
2.08 |
3.32 |
|
Piotroski F-score |
5.57 |
6.16 |
|
ROA% TTM |
5.22 |
7.89 |
Takeaway
PEY implements a dividend growth strategy in a high-yield stock universe. Over 63% of asset value is in 3 sectors: utilities, financials and consumer staples. The dividend yield and valuation ratios are attractive, but quality metrics and past performance since inception are mediocre. However, it is close to flat in 2022, outperforming the S&P 500 by 19%. For transparency, my equity investments are split between a passive ETF allocation (PEY is not part of it) and an actively managed stock portfolio, whose positions and trades are disclosed in Quantitative Risk & Value.
Be the first to comment