

VLG/iStock via Getty Images
InvenTrust Properties Corp. (NYSE:IVT) is a multi-tenant real estate investment trust (“REIT”) that is focused on grocery-anchored neighborhood and community centers, as well as power centers that often have a grocery component.
They are Sunbelt-concentrated, with 93% of their total net operating income (“NOI”) derived from these markets. Compared to their peer set, which includes RPT Realty (RPT) and SITE Centers Corp. (SITC), among others, IVT has the highest level of Sunbelt concentration.
This provides important benefits, such as high in-bound migration rates into these regions from corporations and highly compensated employees, which translates into greater levels of economic activity supporting their tenant base, which includes highly rated companies like Kroger (KR), Publix, and The TJX Companies (TJX), to name a few of their top ten.
The company also has healthy portfolio metrics and a well-capitalized balance sheet, with one of the lowest debt loads among their peers. In addition, they have grown their dividend for the past six years at a conservative five-year compound rate of 3%.
YTD, shares are down 10% but are up 3.8% over the past year. This not only outperforms their peers, many of which are down at or near double-digit rates over the comparative period, but also the broader S&P 500 index, which is down 11% on the year.
Seeking Alpha – Comparative Total Returns Over The Past One Year Of IVT Compared To Related Peers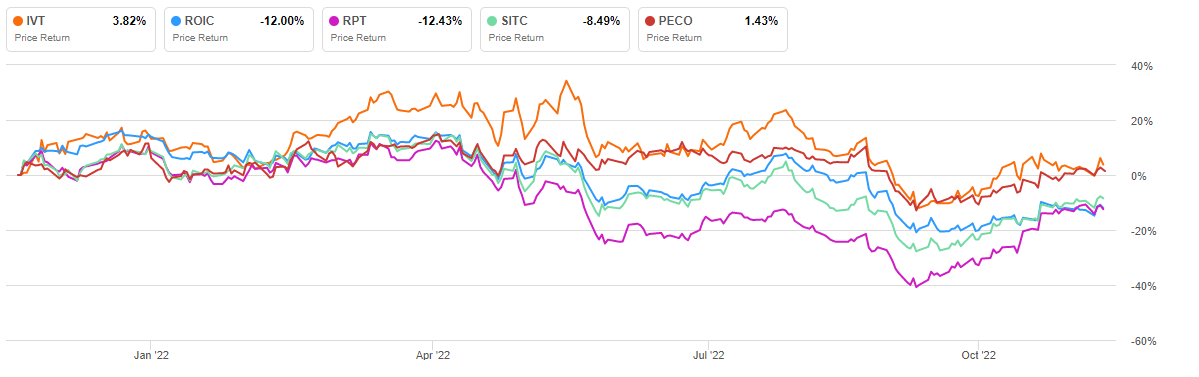
Current investors holding shares in IVT would have buffeted some of the losses inflicting overall portfolios over the past year. But whether that outperformance can continue is debatable.
With occupancy levels already in the upper range, especially among their anchors, opportunities for material growth appear limited in the near-medium term. The company could drive rents higher, but growth rates have likely peaked. For prospective investors, IVT would make for an adequate add to the watch-list but there are better investment opportunities elsewhere.
The Business And The Competition
IVT’s business strategy is centered on multi-tenant essential retail in premier Sunbelt locations. At present, 86% of these properties are grocery-anchored and are in locations with above average growth in population, employment, and education levels. These characteristics create a favorable demand environment that is generally resistant to changing business cycles.
90% of the company’s properties are also within a two-hour drive of their regional field offices. This enables the company to interact with their tenant base more readily and provides them with more in-depth local market knowledge.
With a current enterprise value (“EV”) of approximately 2.25B, the company’s scale is on par with many other smaller names in the sector.
Seeking Alpha – Basic Company Data Of IVT Compared To Related Peers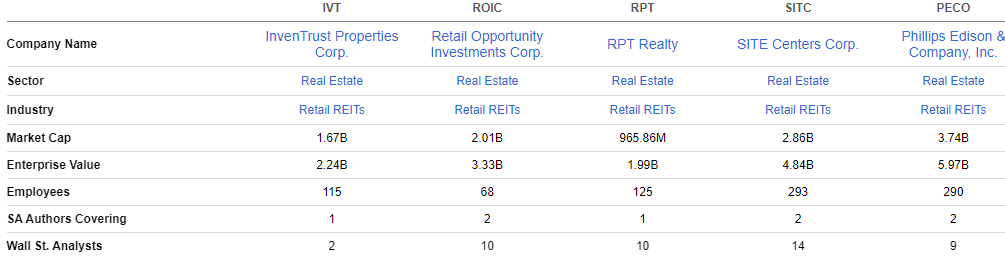
While the stock rates favorably on Seeking Alpha’s (“SA”) Quant system, the company is thinly covered by both SA authors and Wall Street analysts.
For income-focused investors, the company does offer a dividend payout. Though, similar to the industry, the current yield is unappealing, considering the risk-free alternatives that provide either matching or greater yields.
Seeking Alpha – Dividend Yield Of IVT Compared To Related Peers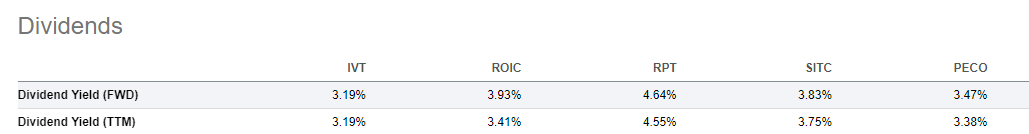
Key Portfolio Statistics
At present, the company’s total portfolio includes 62 properties with an overall leased occupancy rate of 95.6%. This is the highest it’s been over the past several years going back to 2019. And compared to the end of 2021, occupancy is up 170 basis points (“bps”). That compares to growth of 110bps from 2020 to 2021.
November 2022 Investor Presentation – Historical Occupancy Levels From 2019 To 2022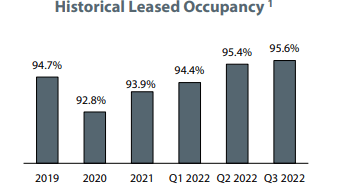
Within their same-property population, the company had 57 properties through the first nine months of the year with a leased rate of 95.4%.
In terms of actual overall economic occupancy, this stood at 93.5% at quarter end, signifying a signed but not yet commenced (“SNO”) spread of 210bps. While this is significantly lower than the 350bps and 510bps spread reported by both SITC and RPT, respectively, it is not necessarily a negative.
Though a wider spread provides greater visibility into future earnings growth, it could also result in greater current expenses due to the inevitability of the company incurring direct and indirect costs in readying the space for physical occupancy.
What’s more important is the company’s current leasing pipeline and ability to sign new and renewal leases at favorable rates. In this regard, they are doing well. YTD, they have signed about 950K SF of space with a variety of quality retailers, such as Publix, Starbucks (SBUX), and Chipotle (CMG), to name a few.
In addition, spreads remain strong, even if they are down from the double-digit rates achieved in Q2.
November 2022 Investor Presentation – Historical Re-Leasing Spreads From 2019 to 2022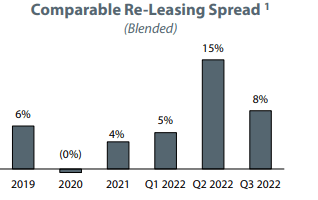
Altogether, the company maintains diversified tenant and industry exposure, with no single tenant representing more than 5% of total base rents (“ABR”). KR, at 4.8% of ABR, is their largest tenant followed by Publix.
In addition, the company has 2.5% exposure to Albertsons (ACI). Together with KR, that represents 7.3% of ABR, which, at the moment, poses uncertainty risk due to the upcoming merger between the two companies.
One consequence of this merger could be potential store closures. As such, investors should be mindful of continuing developments with regards to this tie-up, as it could affect IVT in similar ways to PECO, who has even higher exposure to the two tenants.
Liquidity And Debt Profile
IVT had ample liquidity of +$574.1M as of September 30, 2022, comprised of cash on hand and availability on their revolving credit facility.
Compared to their peers, their cash balance of +$245.9M is nearly 4x higher than the collective total of the four companies included in the comparative population.
Seeking Alpha – Balance Sheet Figures For IVT Compared To Related Peers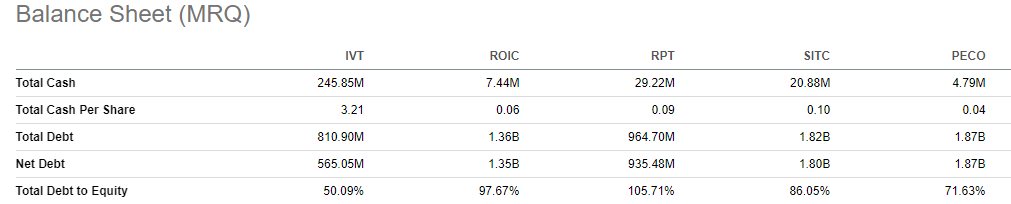
In addition to a strong liquidity position, the company benefits from having one of the lowest overall net debt levels in relation to EBITDA. While peers average about 6.1x, IVT’s is just 5x, which is slightly above the 4.8x reported by Regency Centers (REG).
November 2022 Investor Presentation – Comparison of IVT’s Net Debt Levels With Related Peers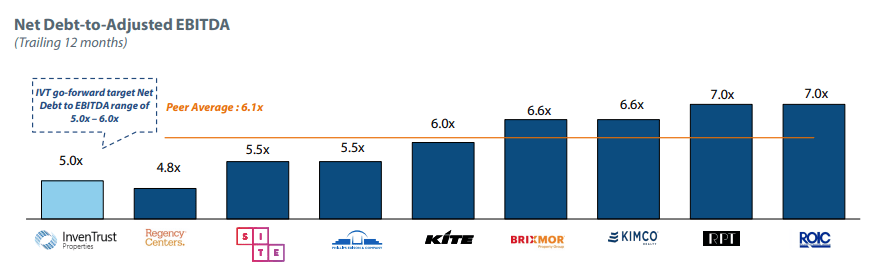
A total debt stack that is heavily weighted towards later years also provides the flexibility to reallocate funds to more accretive and shareholder-friendly priorities.
November 2022 Investor Presentation – Debt Maturity Schedule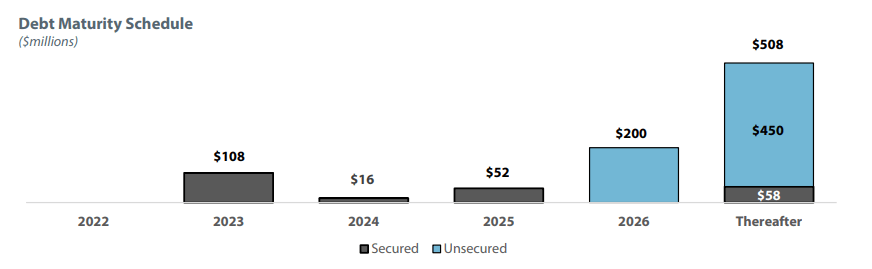
This year, IVT even earned an inaugural investment grade rating with a stable outlook from Fitch.
Dividend Safety
The strong liquidity position has enabled IVT to maintain a stable dividend for the past six years. In fact, the payout has grown every year over this period at a compound rate of 3%.
Presently, the current quarterly payout amounts to $0.2052, which represents a yield slightly above 3% at current pricing. While this doesn’t seem inviting to most income-focused investors, the stability of the payout and its growth streak speaks to the credibility of their inbound cash flows.
At just over 50% of core funds from operations (“FFO”), coverage is better than sector averages. In addition, the company has generated just over +$100M in operating cash flows through the first nine months of the year. This is nearly 2.5x their total distributions paid out over the same period.
While IVT does have room to grow the dividend, expectations aren’t high. Consensus estimates for the 2023 payment are pegged at $0.84, which is just over 2% above current levels. This would still translate to a yield of less than 3.5%, which is not enough for those seeking robust income through dividends.
Seeking Alpha – IVT Consensus Dividend Estimates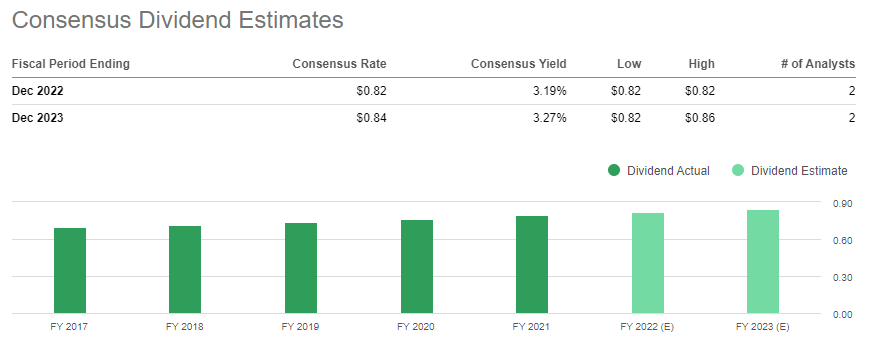
A Solid Grocery-Anchored & Sunbelt-Concentrated REIT
IVT has proved to be a competitive operator of grocery-anchored properties in the key Sunbelt region of the country. The company has a conservative balance sheet with a cash balance greater than many of their peers. In addition, they’ve showcased their cash flow strength via continuous dividend increases over the past six years.
In the current period, they reported double-digit FFO growth on occupancy levels that reached record levels. Moreover, broader cost/return headwinds in the development market is limiting supply growth of grocery centers, which in-turn is providing IVT with the pricing power to drive higher leasing rates.
Despite the higher rates, retention continues to hold above 89%, and the company continues to sign additional square footage into their portfolio.
While the metrics are clearly strong, one can ask where does the company go from here? Occupancy is already above 95% and most of the growth has already been captured, unlike some of their peers, which have some runway in the SNO pipeline.
Furthermore, though spreads were up in the upper single-digits in the current period, they are down significantly from the 15% reported last quarter, suggesting peak growth has passed.
IVT does have the financial capacity for acquisitions, but the transaction market is notoriously uncertain at present. They do have a development pipeline, but that may not be enough, either. If anything, it would add to their cost burden, which is already on the high end, as evidenced by the continued growth in their operating costs.
At just over 16x forward FFO, shares already trade at a premium to other peers within the sector. RPT and SITC, for example, trade at 10.9x and 11.7x, respectively. And another grocery-anchored peer with a similar tenant base, PECO, trades at 14.4x. While the company makes for a solid hold for existing shareholders, it is simply one to watch from the sidelines for most others.
Be the first to comment