

Sundry Photography/iStock Editorial via Getty Images
Thesis: Quality REIT But Wait For A Pullback
InvenTrust Properties Corp. (NYSE:IVT) is a retail real estate investment trust ((“REIT”)) that owns primarily grocery-anchored shopping centers that are mostly concentrated in the Sun Belt region of the United States. Approximately 86% of properties are grocery-anchored (or “shadow anchored,” meaning that IVT owns the shopping center but not the anchor real estate), while 90% of properties are located in the Sun Belt.
That is the highest exposure to the Sun Belt and one of the highest exposures to grocery-anchored centers of all shopping center REITs.
In October 2021, Green Street calculated IVT’s net asset value (“NAV”) per share to be $32.75, based on a 5.6% cap rate. More recently, however, Green Street revised its NAV calculation upward by about 10%, which would put IVT’s NAV at ~$36. That is about 20% higher than the current stock price of ~$29.50.
Perhaps it was this upside to NAV, or IVT’s Sun Belt concentration, or its low leverage, or some combination of factors, that has fueled the REIT’s outperformance over the broader real estate index (VNQ) and S&P 500 (SPY) this year:
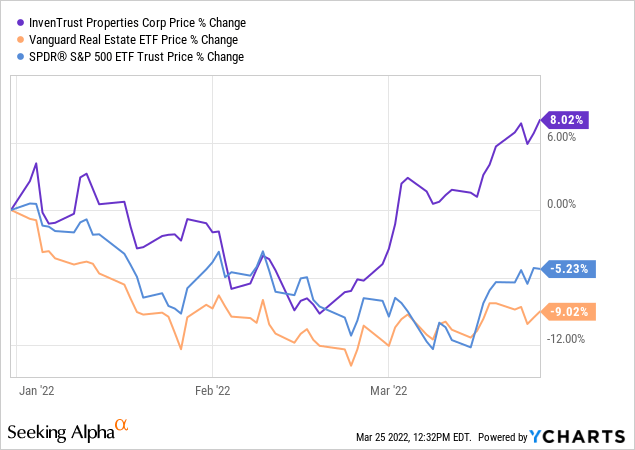
IVT is a high-quality retail REIT that I own and would like to own more of.
Even so, despite the quality of IVT’s portfolio, the REIT is too rich for my blood today. Based on 2021 core FFO per share of $1.40, IVT currently trades at a price-to-FFO multiple of about 21x. That FFO multiple strikes me as too high a price to pay for a dividend growth investor such as myself.
IVT’s dividend of $0.82 offers a yield of ~2.8%. Though that yield represents a mere 58.6% of 2021 core FFO, it is too low relative to IVT’s established track record of low- to mid-single-digit annual dividend growth to make the stock a buy today.
For total return investors wishing to bet on stock price upside due to IVT’s discount to estimated NAV, IVT may be a good buy today. But for dividend growth investors, it would seem wise to wait for a dip to buy.
Undeniable Quality
IVT’s portfolio is phenomenally well-positioned across the United States for optimal demographic growth. By far, the REIT’s largest state by NOI is Texas at 34% as of the end of 2021 (40% as of today).
IVT Q4 2021 Presentation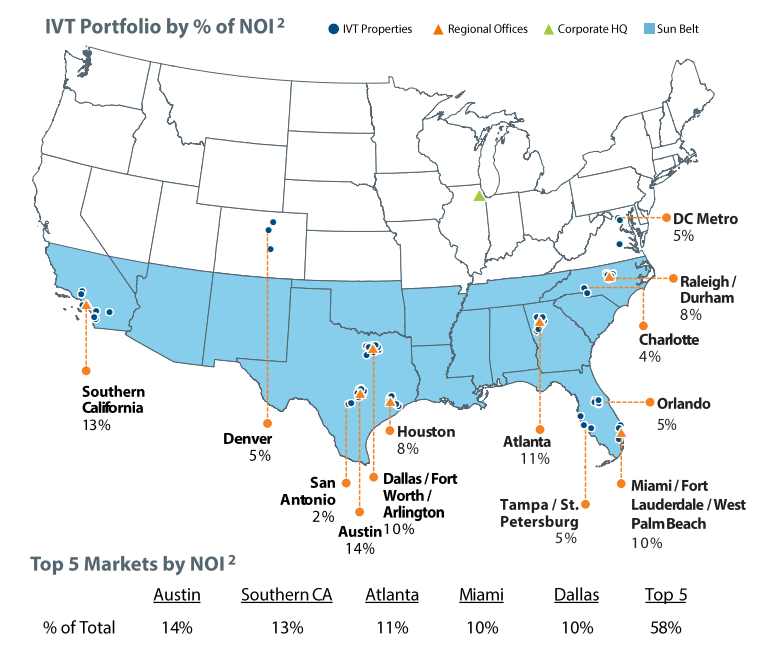
The above illustration is already a bit outdated, as IVT closed on the acquisition of two grocery-anchored shopping centers in Austin, TX in February 2022, pushing Austin’s share of NOI up to 20%. This was a great move for IVT, as CBRE has called Austin the #1 market for commercial real estate investment in the post-COVID environment.
As a resident of the city of Austin myself, I can attest to the huge influx of tech workers at recently opened (or expanded) offices for Google (GOOG, GOOGL), Facebook (FB), Amazon (AMZN), Oracle (ORCL), Indeed (OTCPK:RCRRF), and Tesla (TSLA). Apartment complexes are being built everywhere, and a dozen or so high-rises have been erected downtown in just the last 5-7 years.
According to one projection, the median household income growth in IVT’s particular mix of markets should outpace its retail REIT peers in the next several years. And population growth in its markets should be double that of peers.
IVT Q4 2021 Presentation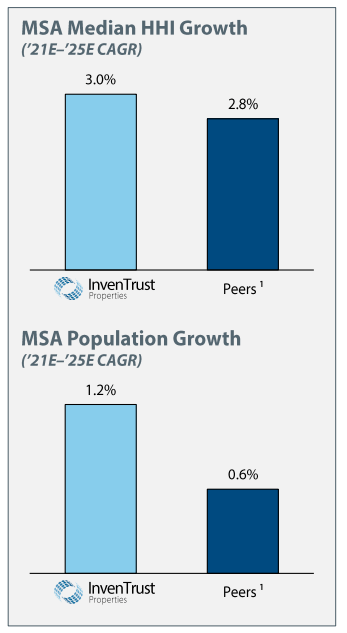
Moreover, IVT’s portfolio scores very highly on Green Street’s “trade area power” (“TAP”) score, which aggregates a number of metrics to measure a property’s fundamental strength.
IVT Q4 2021 Presentation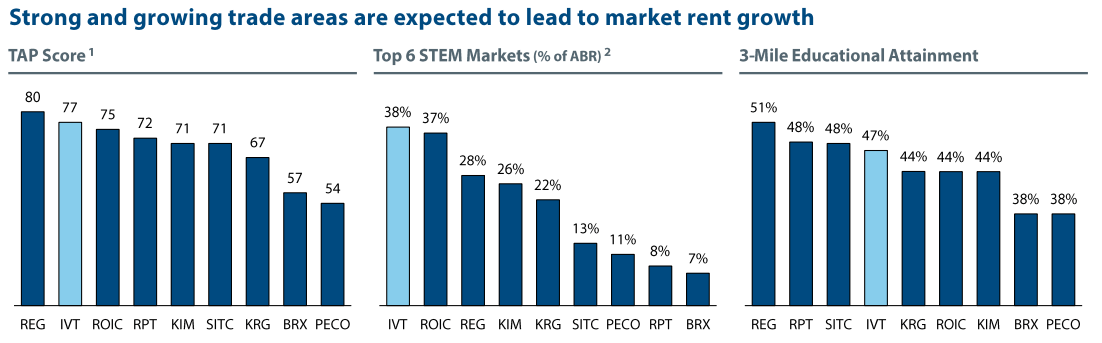
More than simply having the fastest population growth or household income growth, IVT also enjoys the fastest net migration of high income individuals.
IVT Q4 2021 Presentation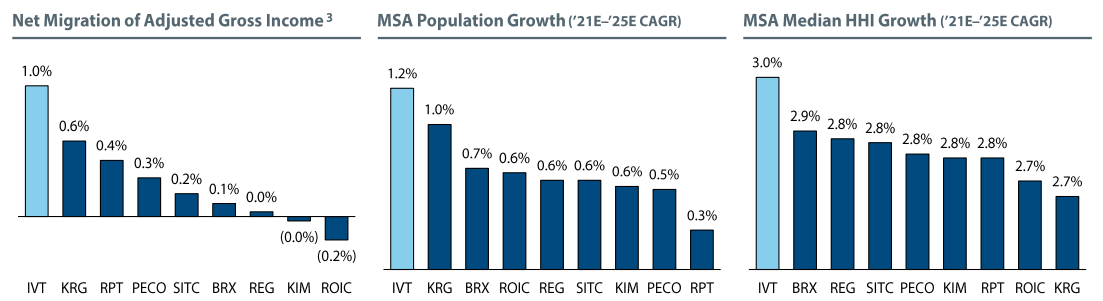
Though some of IVT’s centers are shadow-anchored by grocers (meaning IVT doesn’t actually own the grocery store real estate), it still derives ~20% of its ABR from grocery/drug stores, and five of its top ten tenants are grocers.
IVT Q4 2021 Presentation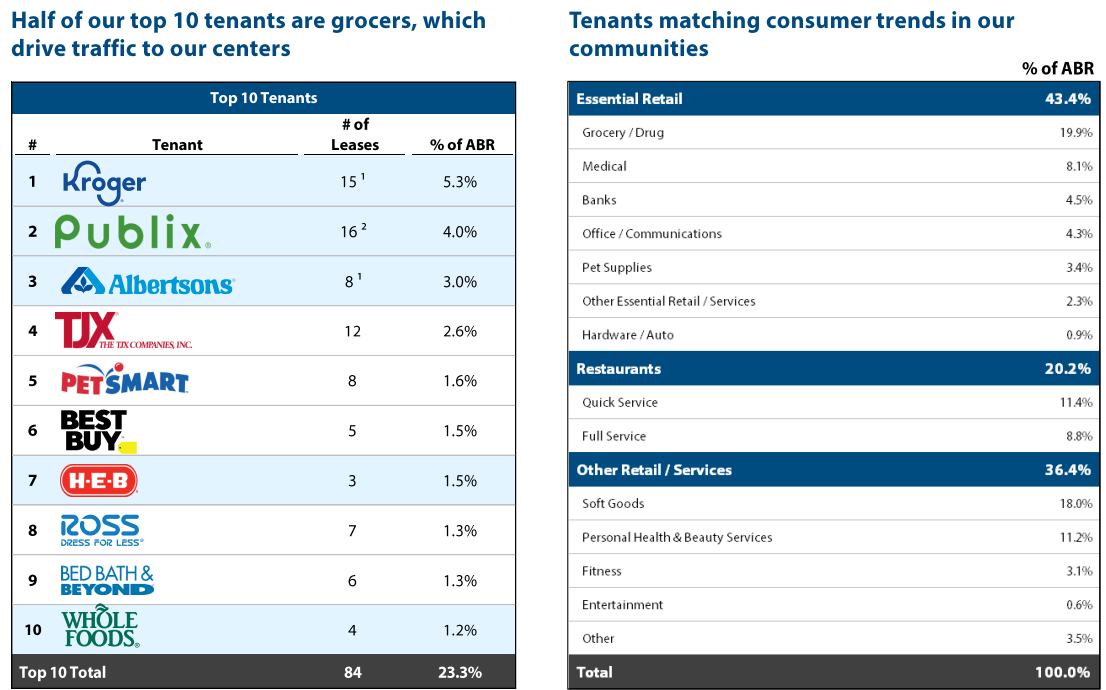
This emphasis on essential/necessity-based retail has proven a boon in the last few years, as more discretionary retail has been volatile.
The incredible stability of IVT’s portfolio can be seen in the fact that it continued to grow executed lease space in 2020, and it did so without letting rent rates fall.
IVT Q4 2021 Presentation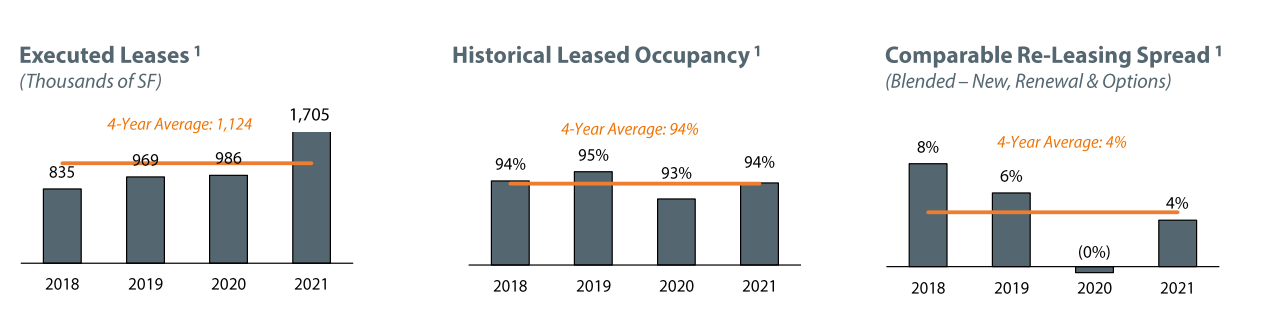
In 2021, same-property NOI grew 4.4% year-over-year. And management has issued 2022 guidance for same-property NOI growth of 2.75% to 4.75%.
Retail REITs more concentrated in coastal areas boasted SPNOI growth in the double-digits last year, but they also suffered far worse than IVT in 2020. While they were simply catching up to their previous levels, IVT continued its steady growth.
IVT’s core FFO per share tends to grow steadily from year to year. See, for, instance, the REIT’s performance over the last few years (and into 2022):
- 2020: $1.35
- 2021: $1.40
- 2022e: $1.53 (midpoint)
Core FFO per share rose 3.7% in 2021, and it is expected to rise around 9.3% (guidance range of 7-11%) this year.
Balance Sheet
By the company’s own leverage targets, IVT is underleveraged. Net leverage of 22% is below the target range of 25% to 35%, and net debt to EBITDA of 4.6x is below the target range of 5x to 6x. IVT also enjoys the lowest leverage ratio of all retail REITs.
IVT Q4 2021 Presentation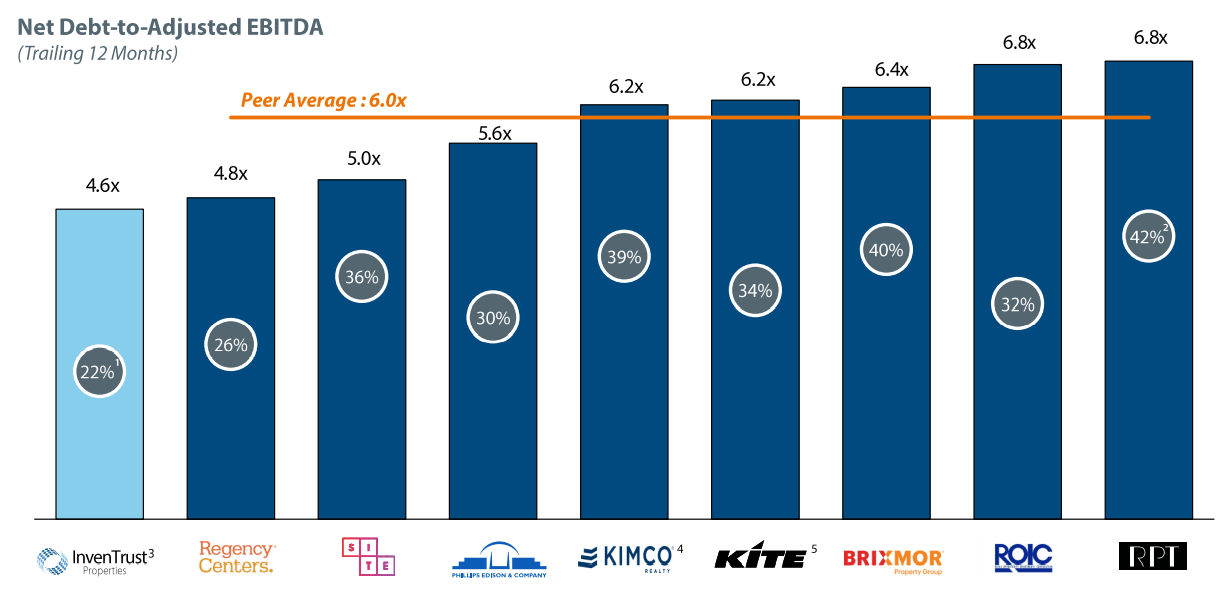
Though IVT does not have credit ratings as of now, its balance sheet has all the elements in place to earn investment grade ratings at some point. Historically, the REIT has been largely self-funded through a combination of asset recycling and ample retained cash flow. But when the time comes issue more unsecured debt, IVT should be able to secure strong credit ratings and low borrowing costs.
Fully three-fourths of total capitalization is in equity, and with a high equity valuation that will likely continue to be the case.
IVT Q4 2021 Presentation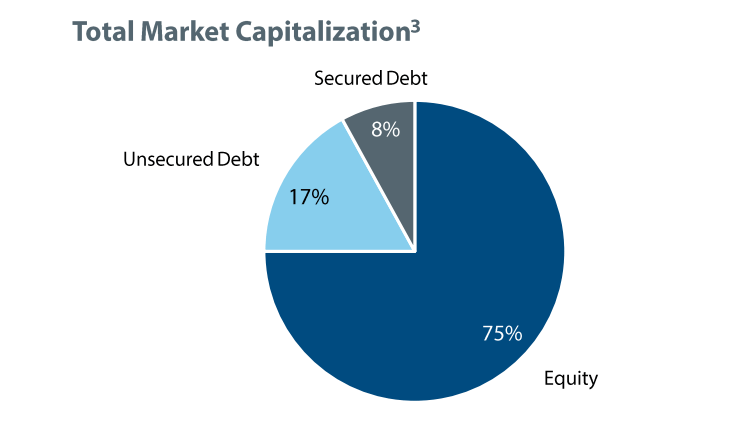
What’s more, all of IVT’s maturing debt in the next three years (aside from the line of credit) is secured.
IVT Q4 2021 Presentation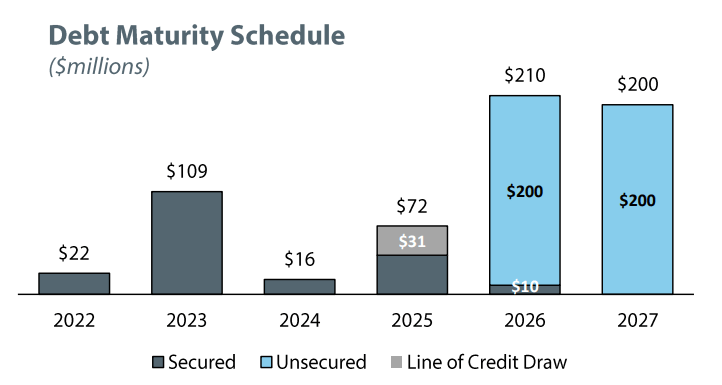
It would not be surprising to see IVT issue unsecured bonds in 2023 in order to roll over those secured loans into unsecured ones.
As of the end of 2021, IVT had a weighted average debt maturity of 4.3 years and a weighted average interest rate of 2.61%.
Bottom Line
I like IVT’s portfolio and financial management a lot, and I wish I owned more of the company. But as a dividend growth investor primarily interested in income growth, I simply don’t think buying IVT makes sense today as the REIT trades at a 2.8% dividend yield.
In recent years, annual dividend hikes have ranged from less than 3% up to 5%.
IVT Q4 2021 Presentation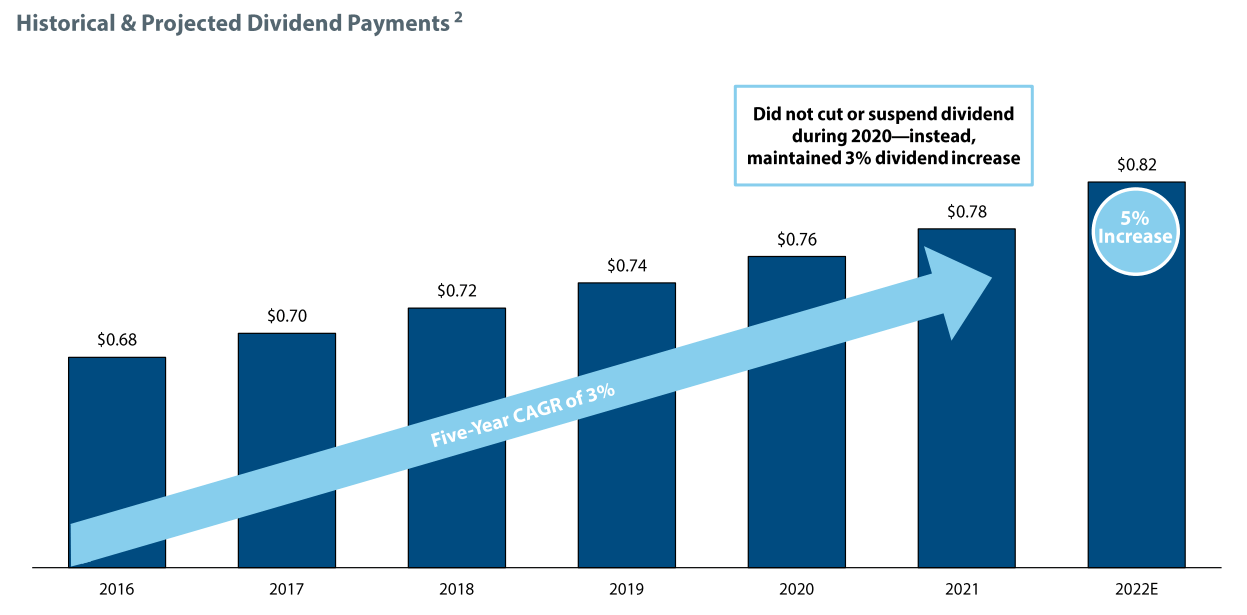
Will IVT’s dividend growth rate rise from here? Probably. I could see it rising to the 5-7% range.
Part of the reason I see dividend growth rising is IVT’s external growth plans.
Management has $190 million of net investment volume (acquisition value minus disposition value) planned for 2022. This may mark a turning point toward faster external growth, as IVT has had only two years in the last seven of positive net investment volume. One of those years was 2020, in which IVT engaged in very little investment activity on the buy or sell side, netting only $24 million of new properties.
The last seven years have been characterized by high portfolio turnover, which reduces reliance on equity issuance but also presents a headwind to growth. Perhaps with less asset recycling, higher core FFO and dividend growth rates will result.
For now, I’ll wait for a dip to accumulate more shares.
Be the first to comment