

Panuwat Dangsungnoen
Investment thesis
Intuitive Surgical Inc. (NASDAQ:ISRG) is a strong technology leader and has also been a long-term leader in terms of performance in its industry and sector. But the stock is suffering from a persistent downtrend since its ATH in December 2021, which has led the stock to lose 50% of its value. Although its capability to quickly retrace in a favorable market, the stock seems now heading towards the lows set in June 2022, and could even break under those levels, as it builds up significant weakness. If the June lows don’t hold, the most likely support levels are seen at $181 and 170.50, with a short-term worst-case scenario around $161. If the stock manages to rebound in the near term, investors should watch out for its strongest overhead resistance, now set by its EMA50, its EMA100, and the ceiling of the trend channel.
A quick look at the big picture
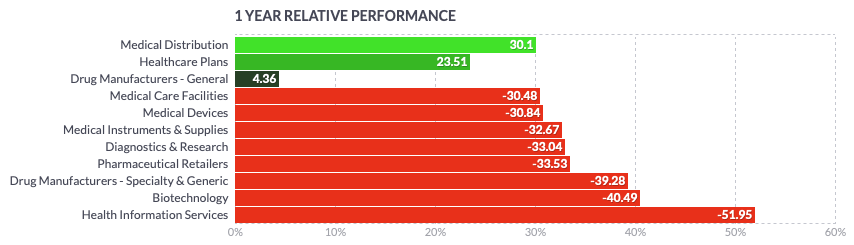
After showing some relative strength during the past year, the healthcare sector in the US has recently plunged again into negative territory led by pharmaceutical retailers, specialty and generic drug manufacturers, and companies providing health information services. Companies in the medical distribution industry, as well as those providing healthcare plans and medical care facilities, could keep up better in the group.
finviz finviz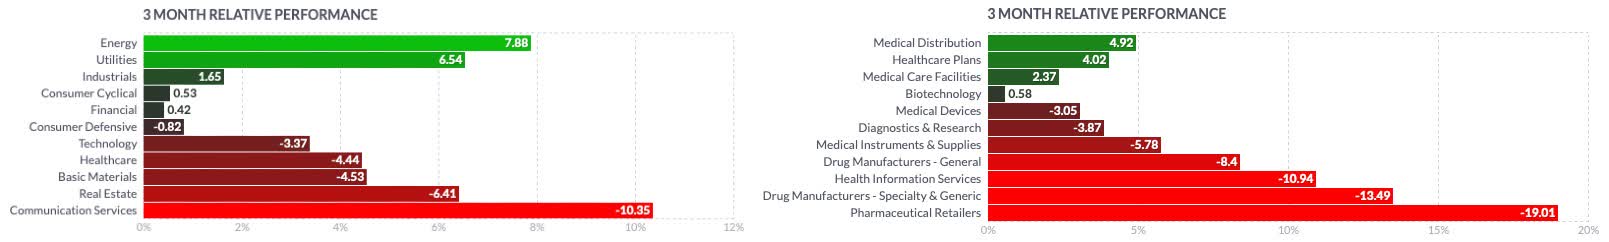
The iShares U.S. Medical Devices ETF (IHI) has substantially underperformed the broader Health Care Select Sector SPDR (XLV) since November 2021. The industry began to improve in July 2022 and showed some relative strength in August until mid-September, but has since lost momentum and has now fallen to the lows seen in June. The industry reference seems to struggle to overcome its long-term downtrend as it got rejected between its EMA100 and EMA200 and is now strongly negatively oriented, and priced under all its most important moving averages.
Author, using TradingView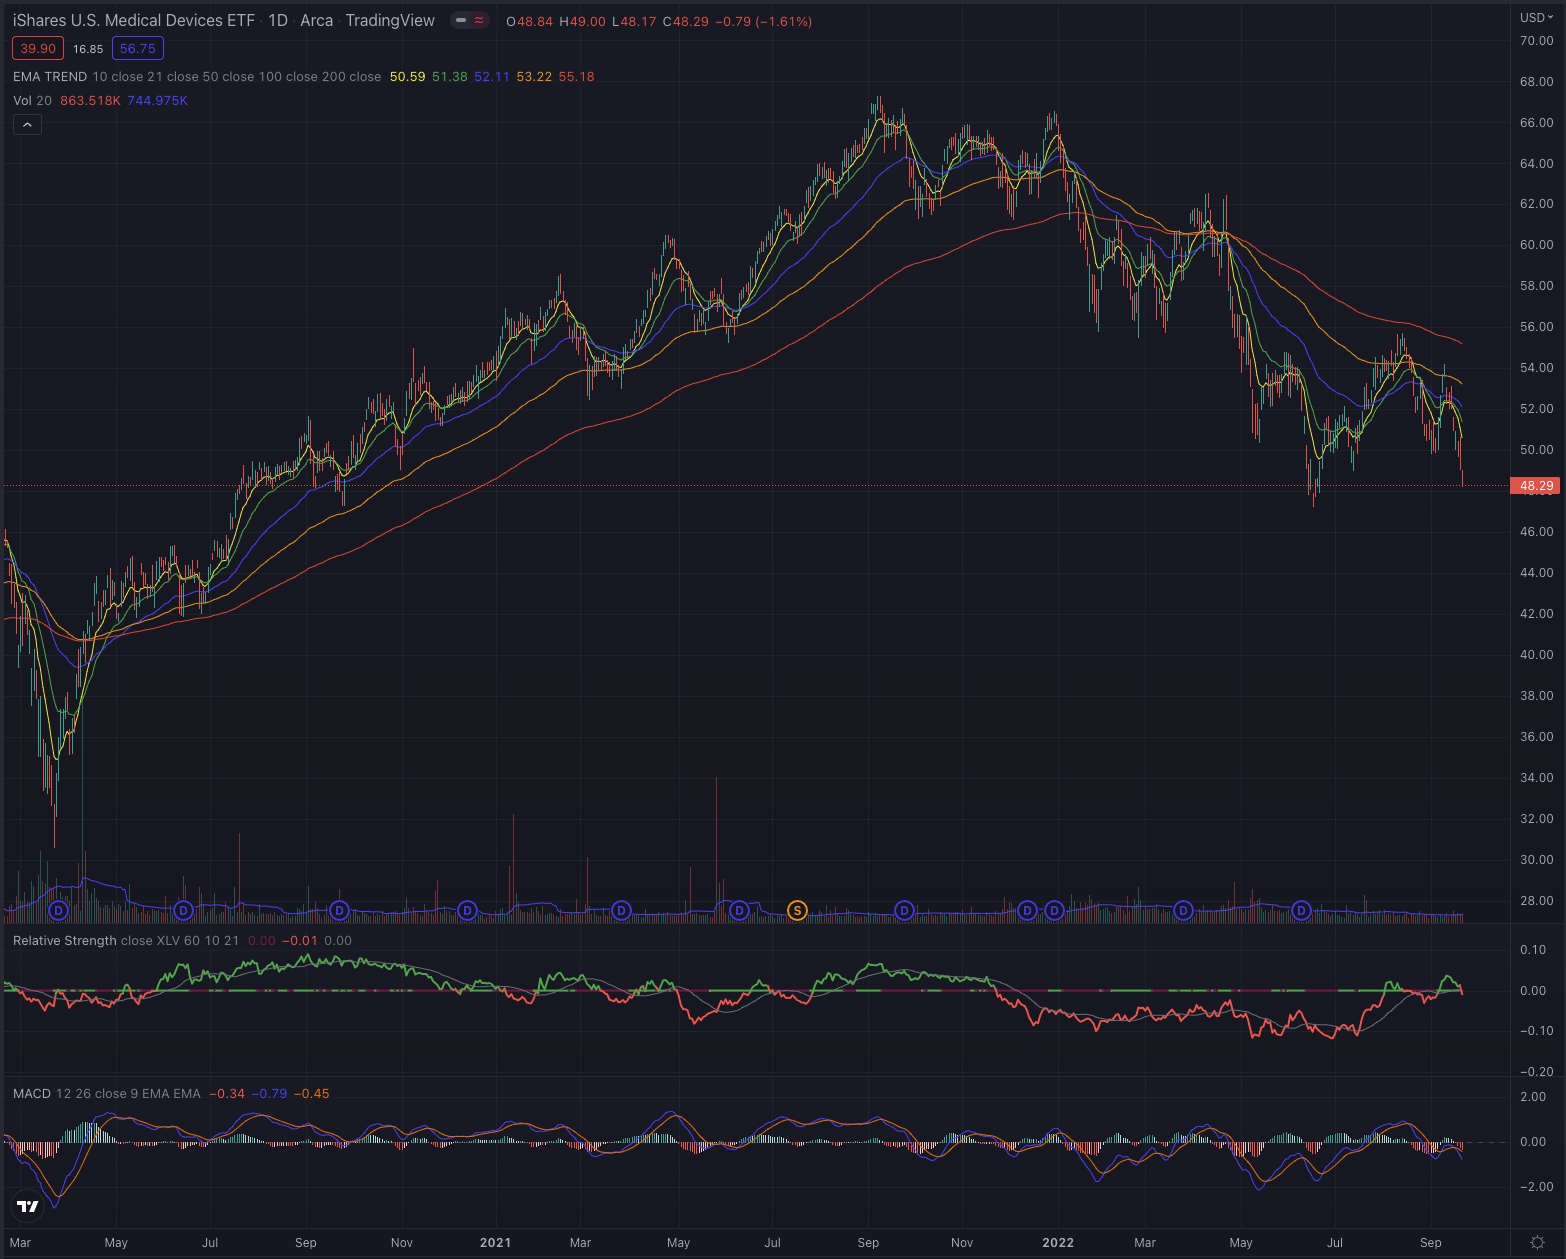
Looking back even further, Intuitive Surgical has outperformed its main sector reference and could, for most of the time in the past 5 years, establish itself significantly better in its industry, but has recently strongly corrected, resulting in 69.04% performance over the analyzed time, slightly worse than the iShares U.S. Medical Devices ETF (IHI) and almost 30% less than the broader technology market.
Author, using SeekingAlpha.com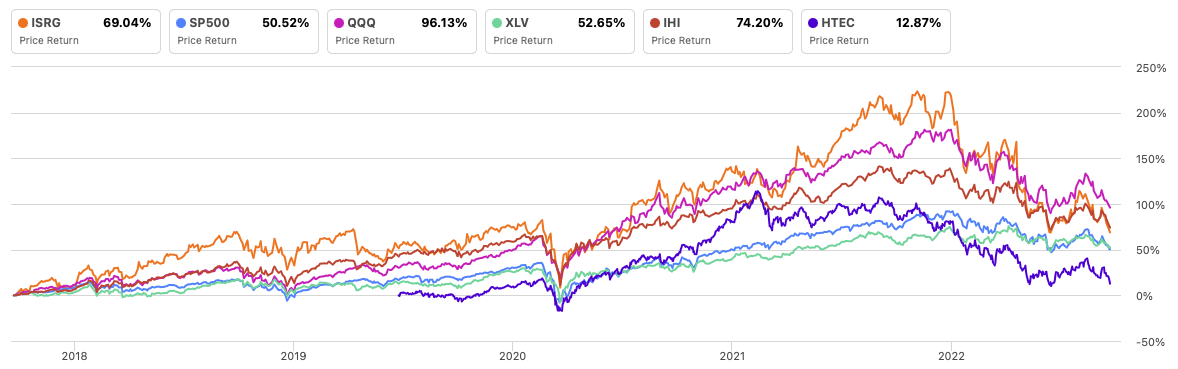
Where are we now?
Since my last article Intuitive Surgical Faces More Challenges published on May 10, 2022, where I suggested the stock was fundamentally fairly priced and may be in an unfavorable technical situation, the stock has lost over 14% and bottomed only on June 16, while instantly forming a strong rebound that led the stock 31% higher until the beginning of August. The recent retracement is characterized by substantial increasing sell volume and relative weakness, as the stock got rejected on its EMA50 breakout attempt, and is now close to the lows seen in June.
Author, using TradingView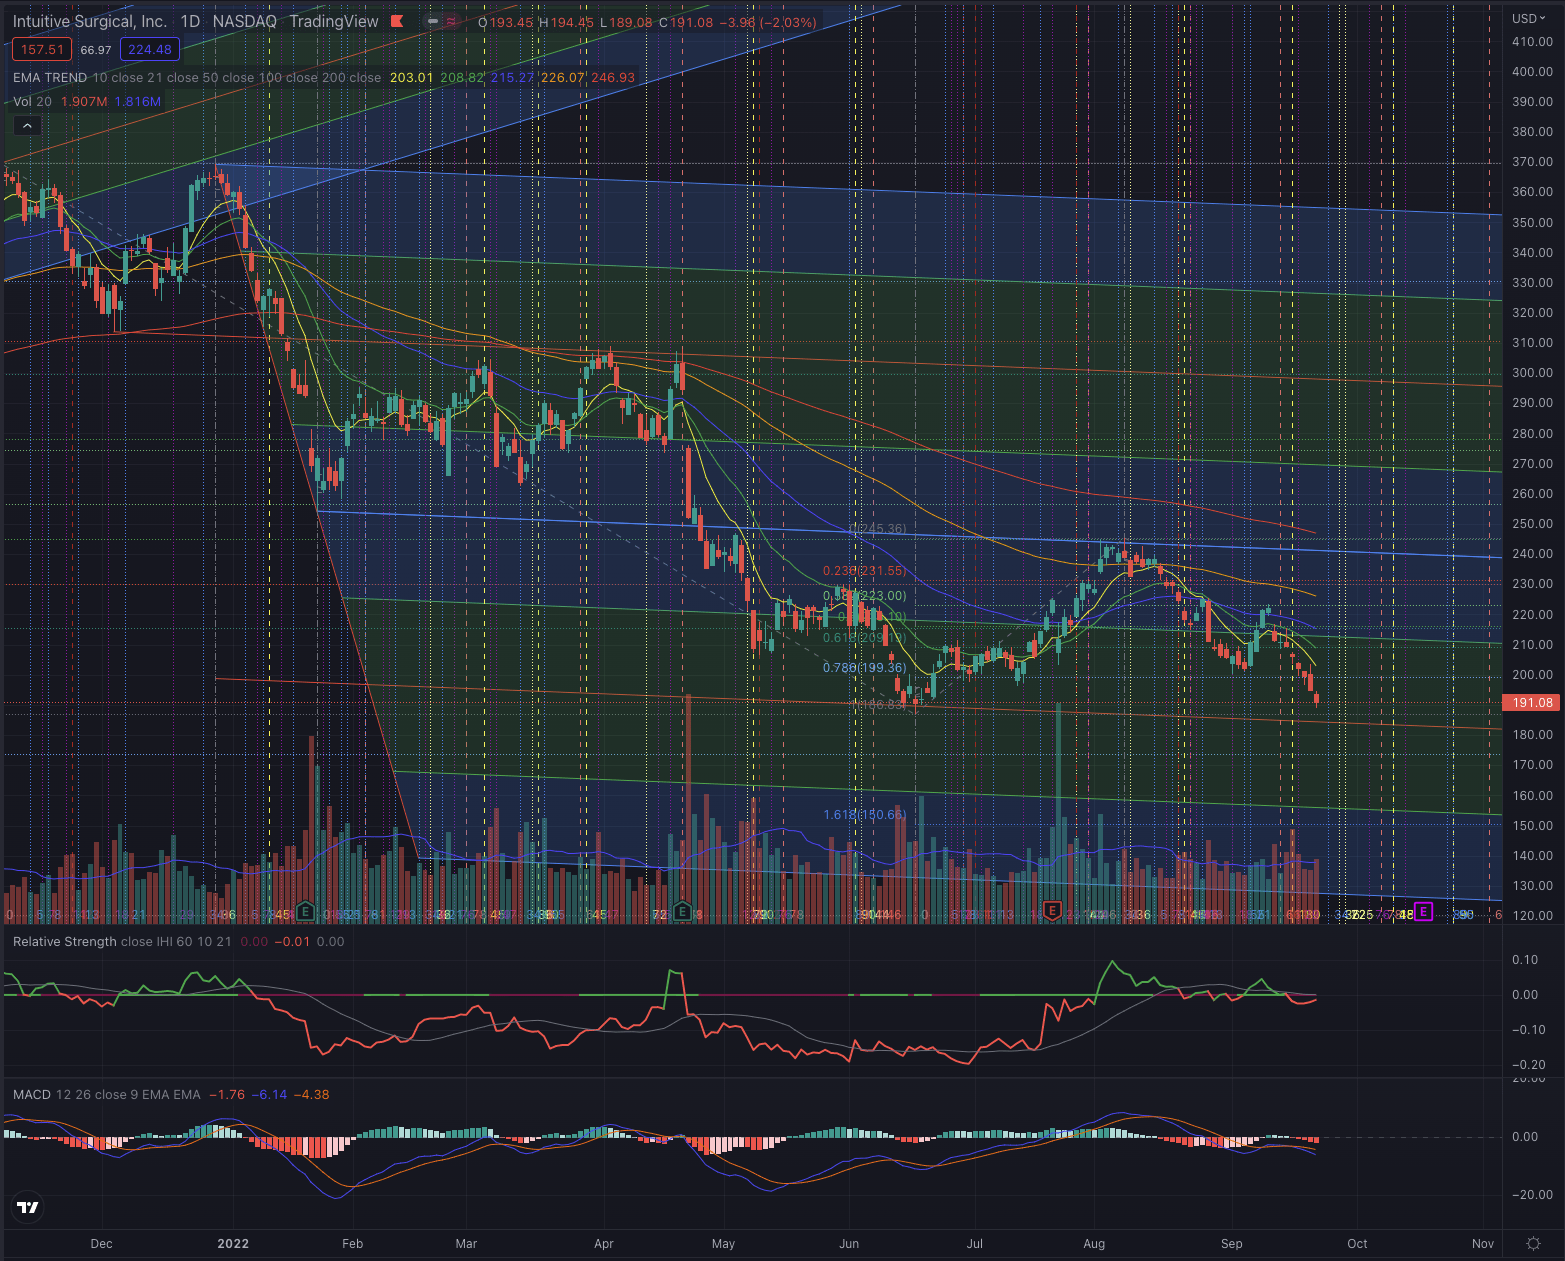
Although it’s still early to determine if a significant new downtrend is forming or if this pullback is all part of the bottoming process, it’s important to note that since topping in August at the overhead resistance formed by the trend-channel ceiling, the trading sessions were predominantly characterized by heavy sell-side volume, and more positive days could not convince in terms of volume. The stock is technically in a very unfavorable situation, and it’s worth it to estimate what the most likely outcomes could be, to be able to adjust the contingency plan.
What is coming next
Despite the stock still seemingly fundamentally fairly priced, technically it seems to be more likely to continue its short-term downtrend, while I expect the stock to slowly improve its performance in its industry in the near term, reporting sporadic relative strength. The levels close to the June lows, will show if the stock is trying to form a sound base, from which it would start its next attempt to break out, or if new lows will be achieved.
Author, using TradingView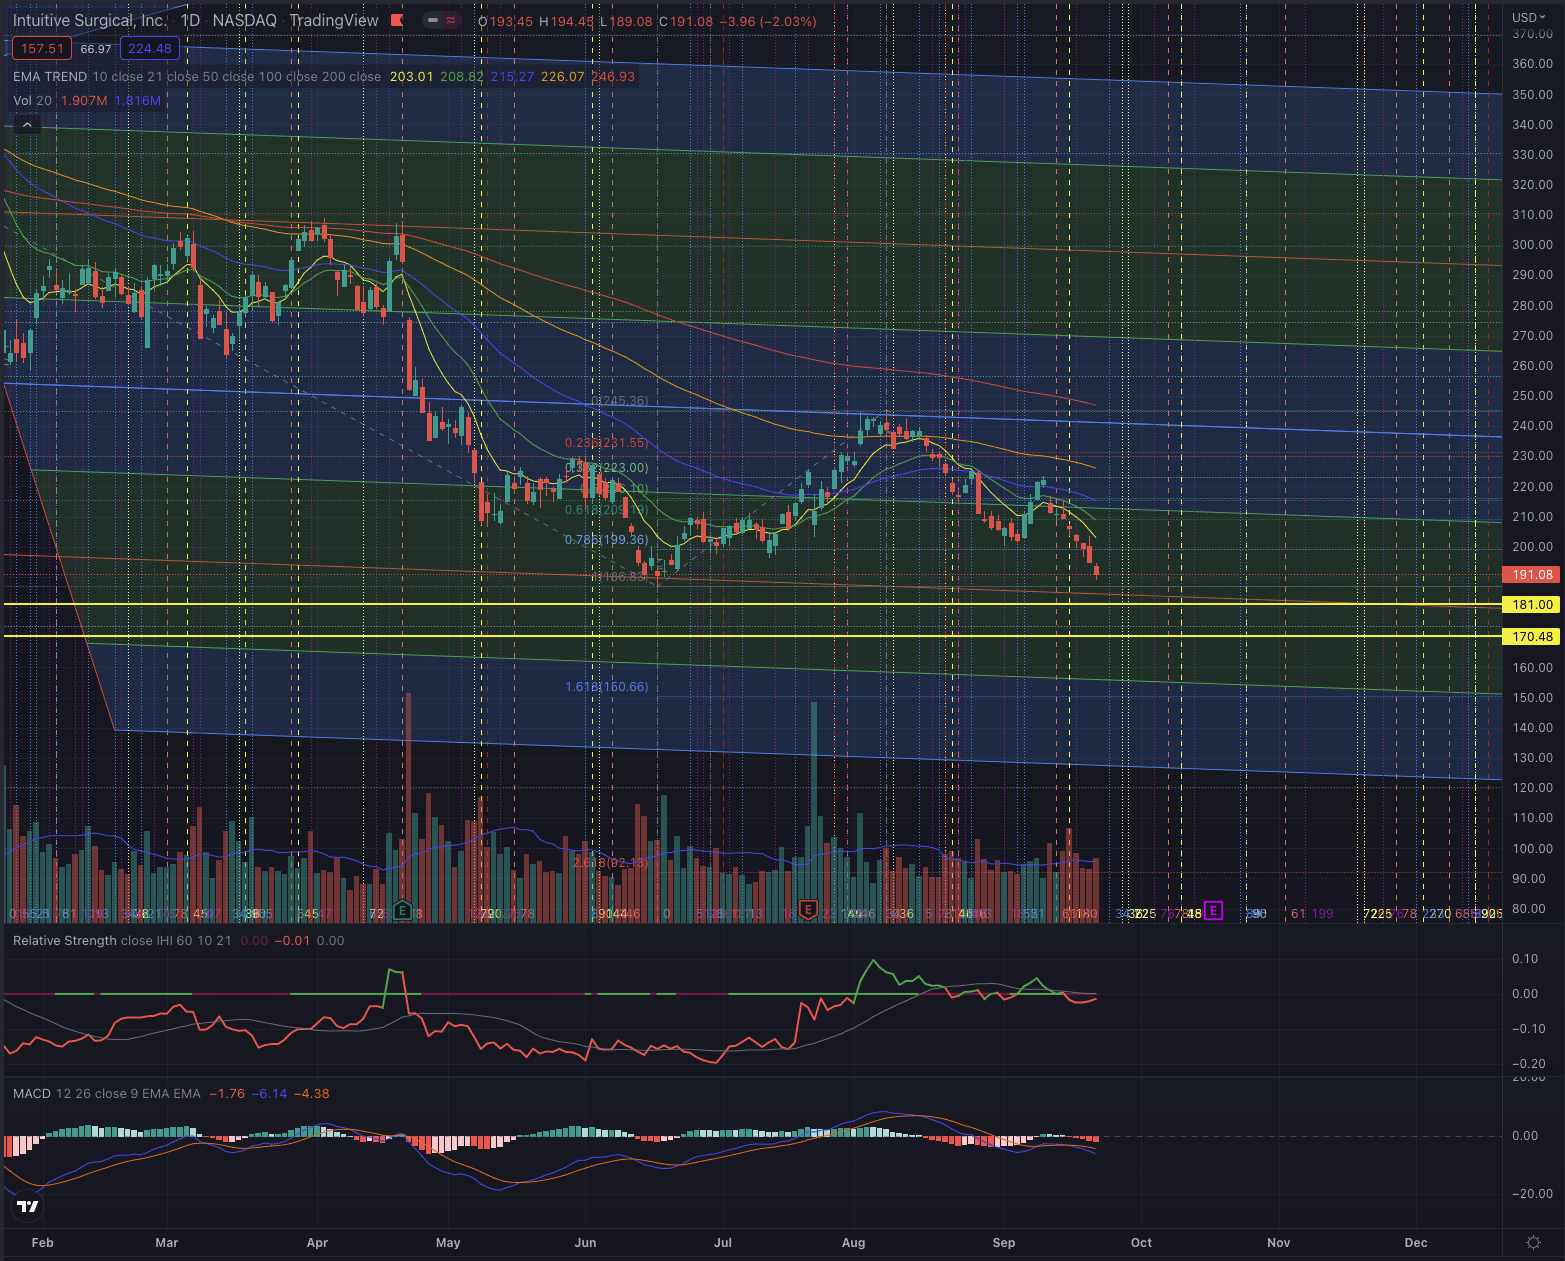
If the stock doesn’t rebound on its support around $187, my projections suggest the most likely short-term price target be set at $181, $170.50, and successively at 160.60. While I qualify the upside potential at around $210-240, with possible catalysts coming up next, the company will report its Q3 results towards mid-October.
Investors should closely observe the price action and how the stock behaves at the next support and resistance levels, and how an eventual attempt to break under its support is confirmed or rejected, by particularly observing the trading volume in both directions and the relative strength. The stock could continue by forming an extended downtrend and overcoming its low set on June 16, which would lead the stock to price levels not seen since the pandemic lows. If the stock instead rebounds, the next important resistance levels are set by its EMA50, the EMA100, and the ceiling of the trend channel. As the stock just made a gap down, I would put particular attention to the next sessions, and keep my stop-loss tight, to avoid being caught in a continuation of the downtrend.
The bottom line
Technical analysis is not an absolute instrument, but a way to increase investors’ success probabilities and a tool allowing them to be oriented in whatever security. One would not drive towards an unknown destination without consulting a map or using a GPS. I believe the same should be true when making investment decisions. I consider techniques based on the Elliott Wave Theory, as well as likely outcomes based on Fibonacci’s principles, by confirming the likelihood of an outcome contingent on time-based probabilities. The purpose of my technical analysis is to confirm or reject an entry point in the stock, by observing its sector and industry, and most of all its price action. I then analyze the situation of that stock and calculate likely outcomes based on the mentioned theories.
As described in my former article, Intuitive Surgical has greatly outperformed the market and its most important competitors in the past years, but its stock has recently severely corrected, and despite bottoming on June 16, the stock is likely heading for more weakness as it’s technically in a very unfavorable situation. While ISRG has shown to be able to quickly retrace from its losses, any breakout attempt was rejected until now, and stronger sell-side volume and negative momentum are building up.
Although a rebound could be possible leading up to the upcoming Q3 earnings release, the stock faces significant overhead resistance, as it would have to overcome not only all its most important trailing averages but also other significant retracement levels and the trend-channel, which has been a major resistance. The next sessions will give more clarity on the stock’s direction, as the downtrend could further be confirmed, by attempting to reach the low set in June, and further lead the stock to price levels between $170 and $181, or in the worst scenario, around $161. Although the stock could attempt to form a bottom as it is also fundamentally fairly priced, the downside risk still outweighs the upside potential, and I continue to qualify the stock as a hold position and would certainly closely manage the risk of more weakness.
Be the first to comment