

Andrei Berezovskii/iStock Editorial via Getty Images
Thesis
The chip market has this truism that there’s Intel (NASDAQ:INTC), there’s Advanced Micro Devices (NASDAQ:AMD), and then there’s everyone else. The AMD+INTC duopoly accounts for almost 100% of the chip market in 2021 as shown in the chart below. The chart shows the distribution of Intel and AMD x86 computer CPUs worldwide. As seen, AMD had been chipping away at Intel’s market share since 2017 Q1. INTC’s market share dropped by about 20%, from ~80% to the current ~60% level, while AMD’s market share gained about 20%, rising from about 20% to 40%. But overall, these two silicon titans enjoy undisputable dominance of the chip market, and INTC is still leading AMD by about 20% in terms of market share.
As such, our thesis is:
- Both INTC and AMD are good candidates to tap into the unstoppable trend of our digital future. Investors should not be too alarmed by the competition, especially not by the quarter-to-quarter fluctuations in their active users and margins. Both are well poised to deliver double-digit annual returns in the long run and the duopoly dominance will remain for the foreseeable future.
- There might be other players competing, but the good news is that the pie is getting bigger at the same time. Emerging technologies such as autonomous driving, artificial intelligence, and smart appliances create an almost insatiable demand for chips. The global market for Multi-Core Processors was estimated at $36.2 billion in the year 2020. It’s projected to reach $76.5 billion by 2026, growing at a CAGR of 13.3%.
- INTC and AMD do provide different growth scenarios, safety, and risk/reward profiles. There’s no bad choice here, but potential investors do need to understand the differences and pick one that suits their individual risk profile and timeframe.
- INTC is more of a value play and also a turnaround play compared to AMD. It spends more aggressively on R&D and aggressively invests in its fab initiative. Its recent acquisition of Tower Semiconductor accelerates this initiative and gives it direct access to a wafer foundry. AMD, on the other hand, is well poised for growth in its core product lines. AMD currently features the best product portfolio arguably in the industry. And the portfolio is getting even stronger considering its Ryzen processors with 3D V Cache TM technology and differentiated solutions for heterogeneous compute enabled by the Xilinx acquisition. The latter will help AMD to tap into the growing computing demand across data centers, communications, and embedded markets.
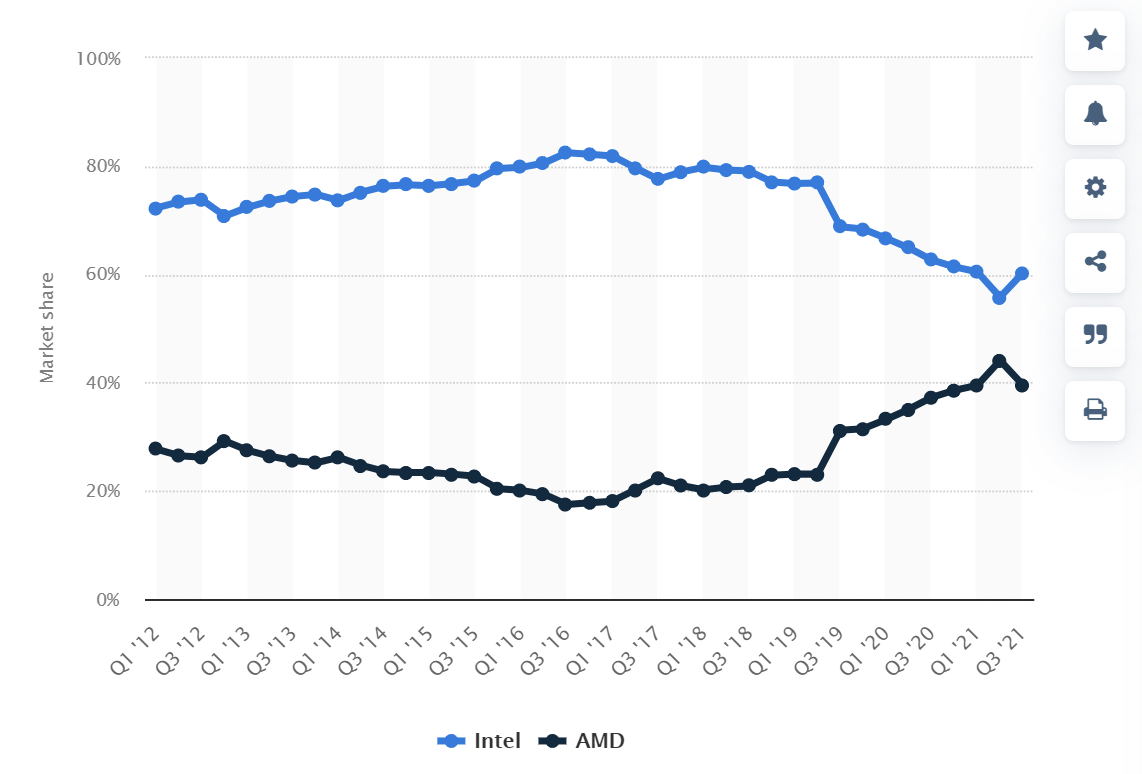
Source: Statista
INTC is investing more aggressively
As mentioned in our earlier writings, we do not invest in a given tech stock because we have high confidence in a certain product that they’re developing in the pipeline. Instead, we feel more comfortable betting on A) the recurring resources available to fund new R&D efforts sustainably, and B) the overall efficiency of the R&D process. I’ve studied many high-stake R&D cases in detail and have been involved firsthand in quite a few of them myself. There are a few key lessons that I’ve learned. First, the success or failure of a given project is largely a matter of chance and luck – no matter how much resources we throw at it and how high a priority management has assigned to it. Second, the successful cases are only made to appear as a planned success – after they become successful.
So let’s first see how well and sustainably INTC and AMD can fund their new R&D efforts. The short answer is: Extremely well. The next chart shows the R&D expenses of INTC and AMD over the past decade. As seen, both have been consistently investing heavily in R&D. AMD on average has been spending about 18% of its total revenue on R&D efforts in recent years. And INTC spends even more, on average 20%. To put things under perspective, these levels of investment are quite consistent and competitive in the high-tech space such as the FAAMG stocks.
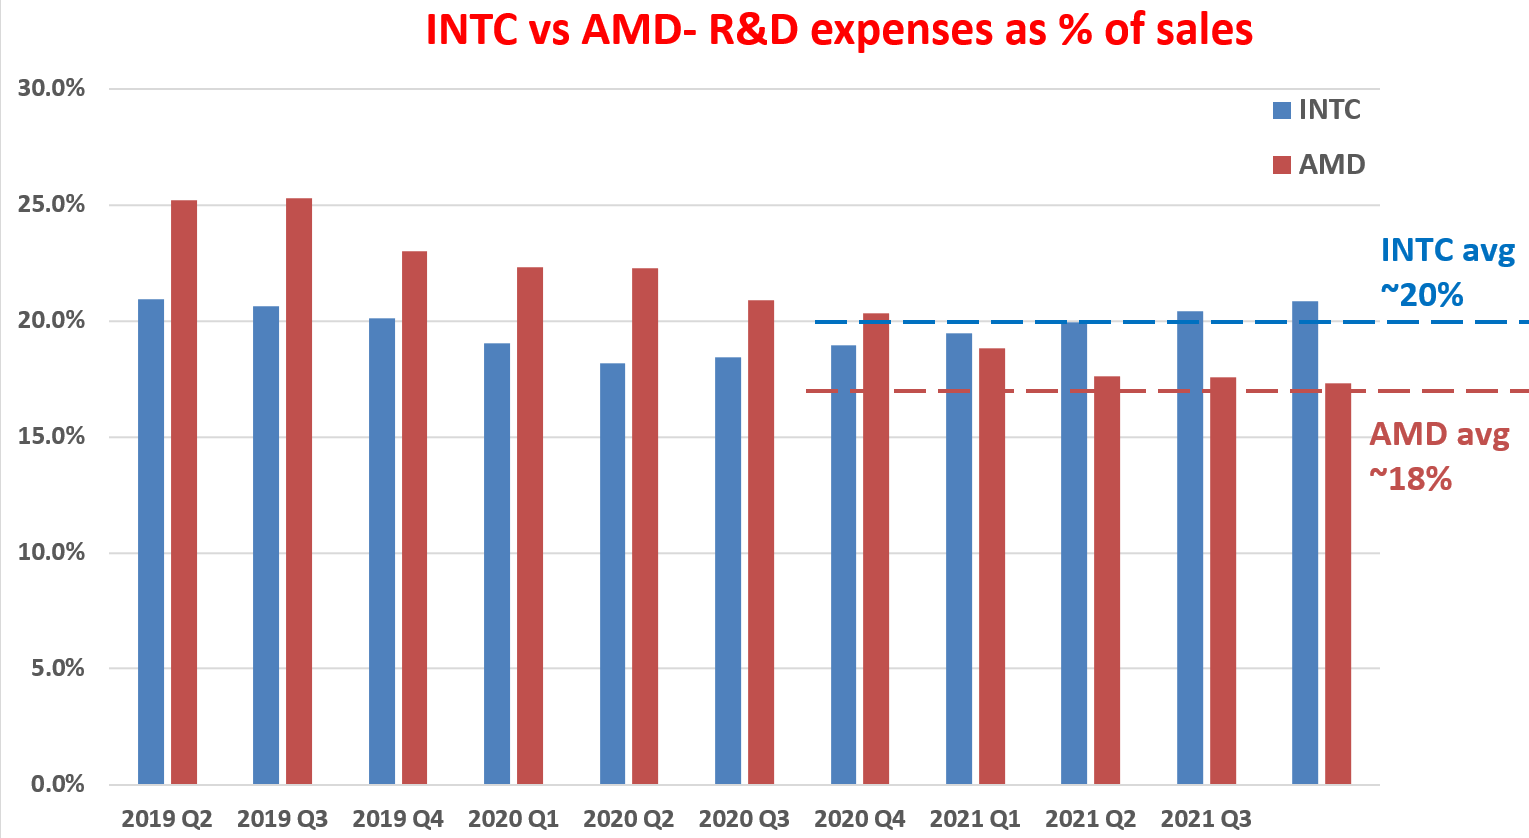
Author
Then the next question is, how effective is their R&D process? The short answer is again: Extremely effective. We ourselves like to use a variation of Buffett’s $1 test on R&D expenses. We do not only listen to CEOs’ pitches on their brilliant new ideas that will shake the earth (again). We also examine the financials to see if their words are corroborated by the numbers. And in INTC and AMD’s case, they are.
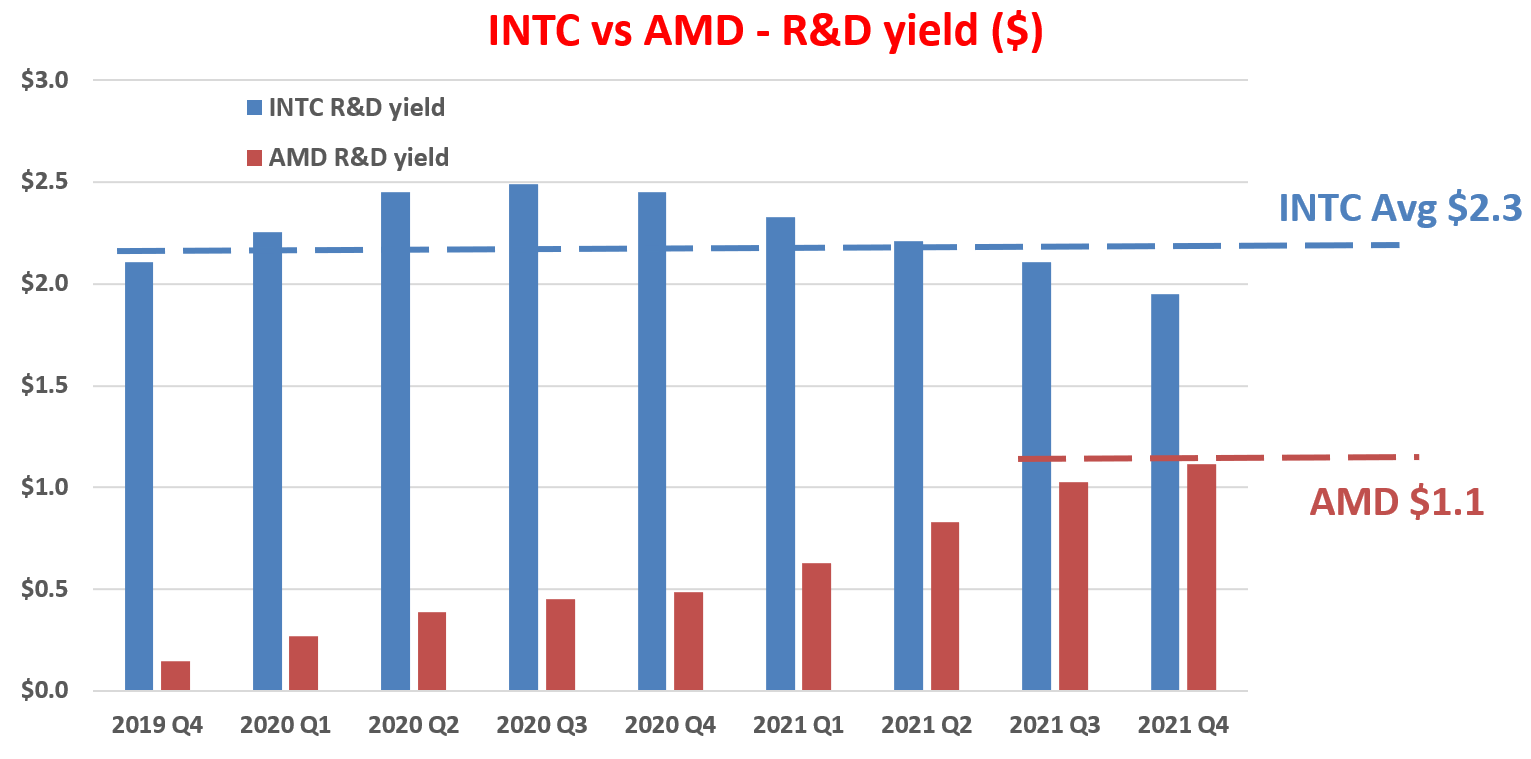
Now let’s apply the $1 test to quantify the yield of their R&D expenses. The purpose of any corporate R&D is obviously to generate profit. Therefore, it’s intuitive to quantify the yield by taking the ratio between profit and R&D expenditures. This way we can quantify how many dollars of profit has been generated per dollar of R&D expenses, as shown in the next chart. In this chart, I used the operating cash flow as the measure for profit. Also, most R&D investments do not produce any results in the same year. They typically have a lifetime of a few years. Therefore, this analysis assumes a three-year average investment cycle for R&D. And as a result, we use the three-year moving average of operating cash flow to represent this three-year cycle.
As you can see, the R&D yield for INTC has been remarkably consistent and has a long-term average of $2.3. This level of R&D yield is very competitive even among the overachieving FAAMG group (e.g., both Meta Platforms and Google generated about $2.2 of R&D yield in recent years). The only one that generates a significantly high R&D yield in this group is Apple (AAPL). AAPL is in its own category (like in several other aspects). It boasts an R&D yield of $4.7 of profit output from every $1 of R&D expenses.
On the other hand, AMD’s R&D yield is not that high yet, but it’s catching up very quickly. As you can see from the following chart, its R&D yield increases substantially quarter by quarter since 2019, after it successfully released a new CPU architecture and replaced its inferior Bulldozer architecture around 2017~2018. And the current yield is already about $1.1 already. I’m very optimistic that its R&D yield will catch up shortly given its rapidly expanding profitability as to be detailed next.
And as we will next, both INTC and AMD enjoy superb profitability to fuel their R&D efforts sustainably, which will lead to sustainable growth in turn.
Author
Both enjoy superb profitability and growth prospects
When we think of long-term growth (like in 10 years or more), the framework I use is the following. In the long term, the growth rate is “simply” the product of ROCE and reinvestment rate, i.e.,
Long-Term Growth Rate = ROCE * Reinvestment Rate
ROCE stands for the return on capital employed and is the most important metric for measuring profitability. Note that ROCE is different from the return on equity (and more fundamental and important in my view). ROCE considers the return of capital actually employed and therefore provides insight into how much additional capital a business needs to invest in order to earn a given extra amount of income – a key to estimating the long-term growth rate.
The analysis of ROCE has been detailed in my early articles and I will just directly quote the results below. In this analysis, I consider the following items capital actually employed A) Working capital (including payables, receivables, inventory), B) Gross Property, Plant, and Equipment, and C) Research and development expenses are also capitalized.
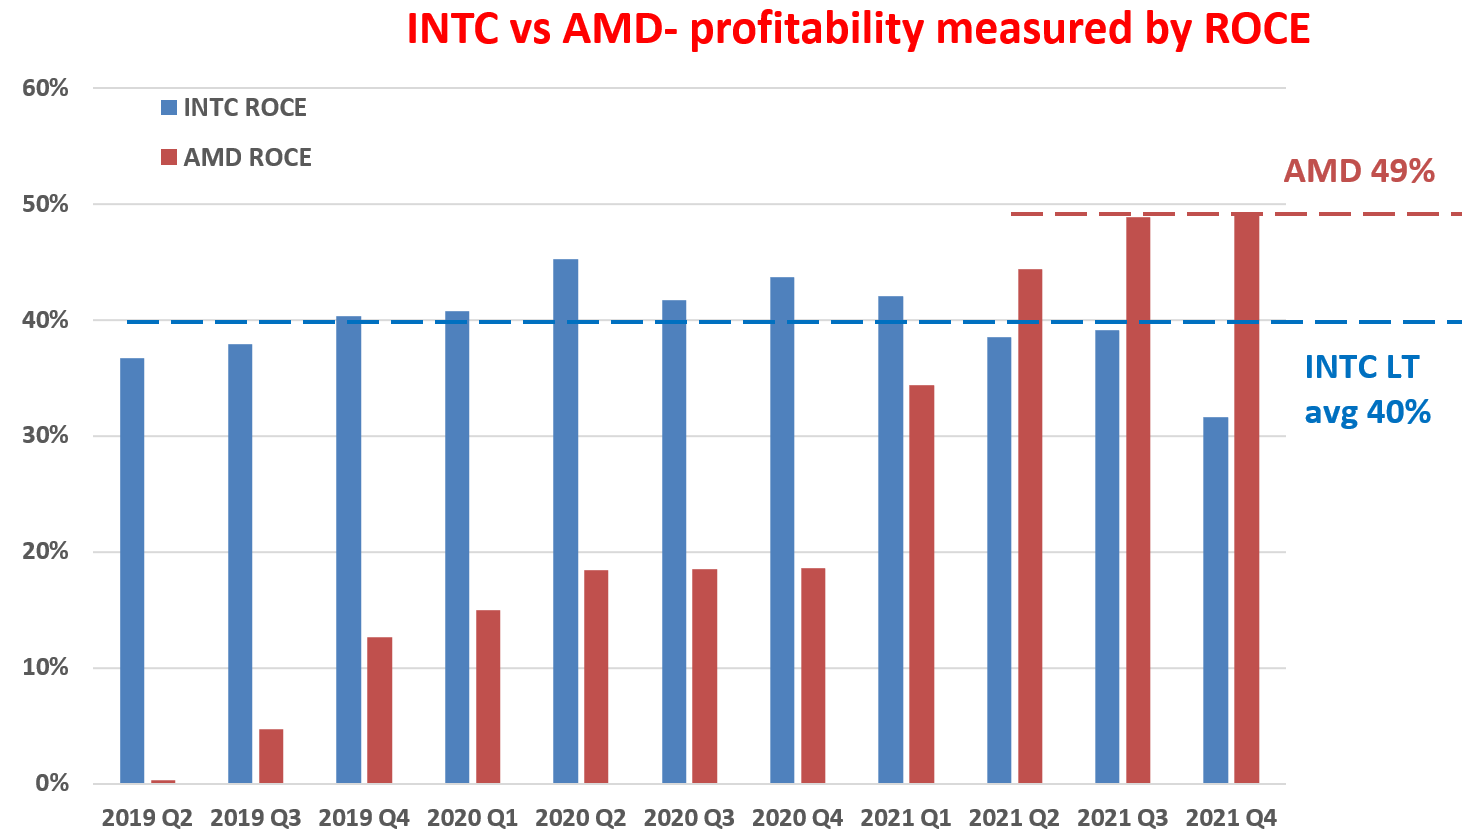
Based on the above considerations, the ROCE of INTC and AMD over the past decade is shown below. As seen, INTC was able to maintain a remarkably high ROCE over the past decade: On average about 40% in recent years. And AMD’s ROCE has been “relatively” low in the past till again 2019. Then it expanded rapidly since then and now has surpassed INTC. The keyword here is RELATIVELY – their current level of ROCE might be higher or lower than each other (or their own glorious past). But a ROCE of 40% to 50% is still a remarkable level high level even among overachievers like the FAANG pack as detailed in my other articles.
Author
In terms of reinvestment rate, both companies enjoy enviable capital allocation flexibility. The capital allocation picture is really simple for both companies here: Both earn a load of cash organically from their operations and enjoy terrific allocation flexibility.
Take INTC as an example here. In recent years, it generates about $30B of operating cash flow (“OPC”) per year in recent years. In the past, it has been using on average ~54% of its OPC to pay for maintenance capex and dividends. The capital allocation picture will change dramatically in the next few years as INTC doubles down on its foundry investment. Its capex will increase to $26.5 in 2022, a whopping 43% increase compared to 2021. However, even after such a large capex commitment, it will still maintain a positive free cash flow (expect to be about $4.5B in 2022). Furthermore, I won’t worry about the large capex investment too much for a range of other reasons too: Its strong cash generation capability, its strong balance sheet, the upcoming Mobileye IPO, and government support for the foundries.
AMD’s capital allocation picture is really similar. In 2021, it generated an OPC of about $3.5 billion, up 229% y/y, and a record free cash flow of $3.2 billion. At the same time, it boasts a strong balance sheet with $3.6 billion in cash or equivalents. Given its strong free cash flow and strong balance sheet, it was able to commit $1 billion in strategic investments in long-term supply chain capacity and at the same time also repurchased $1.8 billion of common stock. Even after such investments and share repurchases, it still has plenty of cash to reinvest and fuel future growth.
All told, my estimates are that INTC has been maintaining a reinvestment rate between 15% to 20% in recent years, and AMD about 10% to 15%. And we will see the implications of the investment rates next.
The final verdict
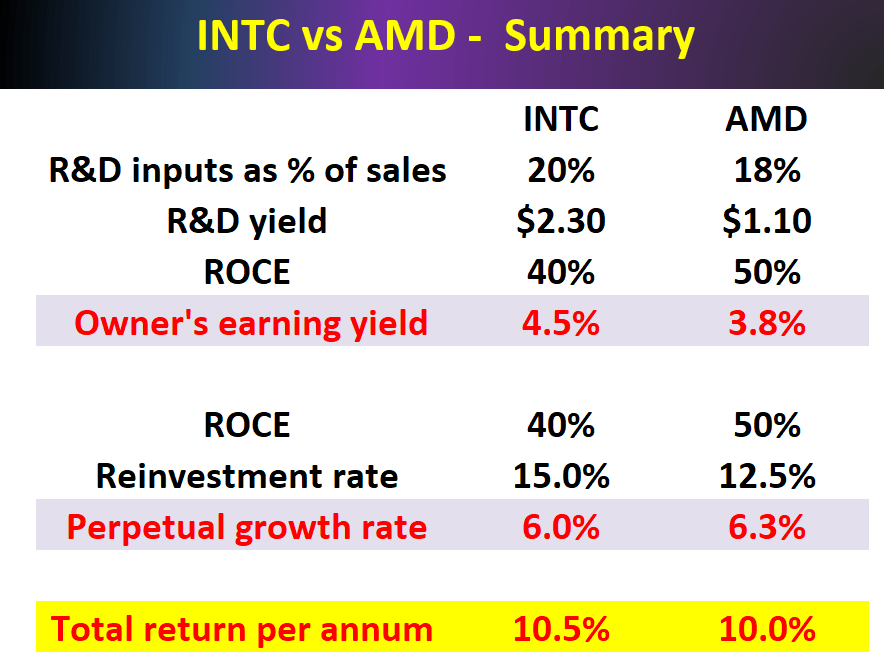
With the above business fundamentals, the following table summarizes the return potentials of both businesses. The comparison assumes we are business owners, not stock traders. In this case, our long-term ROI is simply determined by two things: A) the price paid to buy the business and B) the quality of the business. More specifically, part A is determined by the owner’s earning yield (“OEY”) when we purchased the business (the 4th row in the table), and Part B is determined by the organic growth rate or the perpetual growth rate of the business (which is the 7th row, and it equals ROCE*Reinvestment Rate as aforementioned).
I hope all of this is very intuitive. As business owners, our returns are completely determined by the price we pay and the quality of the business. And the most important things for the quality are the ROCE (which measures its profitability) and investment rates (which measures its capital allocation options).
Author
And as you can see:
- Both feature a healthy total return in the long term in the double-digit range. The total returns are a balanced combination of earning yield and growth rates for both companies.
- Furthermore, these projections are on the conservative side because of the conservative assumptions I made about the OEY. Here as a crude and conservative estimate, I used the free cash flow (“FCF”) as the owner’s earnings. It’s conservative in the sense that the owner’s earnings should be FCF plus the portion of capex that’s used to fuel the growth (i.e., the growth capex).
- In the case of INTC, I took 15% as the reinvestment rate even though it has been reinvesting more in recent years and will keep doing so in the next few years due to the foundry initiative. The rationale to use 15% here is that I expect the reinvestment rate to wind down after the foundry initiative is completed in a few years. And I assume 15% to be a more representative long-term average.
Although there are a few key differences that potential investors need to be aware of:
- INTC’s valuation is also significantly lower than AMD (PE ~12x for INTC vs ~25x for AMD).
When the valuation of one stock is lower than a peer by half, it usually means the market perceives the former as a “value” stock and the latter as a “growth” stock, which is consistent with my reading of many of the SA articles on these stocks.
- However, my thesis here disagrees with such a perception. As seen from the table above, I expect both to have about the same long-term growth rates and total returns given their ROCE, reinvestment rate, and the secular trend. In the short term, it’s indeed true that INTC’s initiative in the foundry business is more uncertain compared to AMD’s investments in its core product portfolios. Although there are a few tailwinds to support an optimistic view of the foundry business. The foundry sector is expected to enjoy strong secular growth. It’s expected to grow into a $100 billion market over the next five years from about $87 billion today. INTC’s investment in foundry also enjoys support from the U.S. government. And lastly, the short-term uncertainty has been fully baked into their valuation differences already (as reflected by the long-term total return projections).
Risks
Although, both businesses face some common and macroscopic risks and also risks unique to each one of them, as detailed below:
- Macroscopic risks. The Ukraine/Russian conflict is a big near-term uncertainty. The ripple effects (such as disruption to the supply chain) create further and higher-order risks. The duration and eventual outcomes of the conflict (as with any geopolitical conflict) are totally uncertain. It could generate substantial impacts on both the global overall financial markets and the energy stocks in unpredictable ways. Furthermore, the pace and degree of the post-COVID economy recovery also are uncertain.
- Specific to INTC, its investment in the fab business represents a large uncertainty as aforementioned. The success of the foundry business is just simply uncertain at this point. There are reasons to be optimistic. For example, the Biden administration had recently pledged $52 billion toward building out domestic production and supply of semiconductors and reestablishing America’s “chip supremacy” from Asia. But in the end, the outcome wouldn’t become clear until a few years later.
- Specific to AMD, its premium valuation, combined with the macroeconomic risks, could lead to short-term large price volatility risks. In the long term, AMD (and INTC too) competes with Nvidia (NVDA), Qualcomm (QCOM), et al, either directly or indirectly. The competition is not only limited to chip design but also extends to other areas such as manufacturing. AMD, for example, has a risk of losing its console business if Intel’s Foundry Services becomes online and successfully because the cost is a critical factor in the consoles business.
Summary and final thoughts
Recent corrections provided entry opportunities for both INTC and AMD. We see no bad choice here, just choices that investors need to customize to their own risk tolerance. Specifically:
- Even though the competition is intensifying, they currently still dominate the chip space and I expect the dominance to continue. At the same time, the pie is getting bigger. Emerging technologies such as autonomous driving, artificial intelligence, and smart appliances create an almost insatiable demand for chips.
- I do not see INTC as the “value” play and AMD as the “growth” play here. I expect both to have about the same long-term growth rates and total returns given their ROCE, reinvestment rate, and the secular trend.
- There’s really no wrong choice here, and there’s nothing wrong to hold both stocks. We ourselves hold INTC for several reasons. Firstly, our style is to hold a concentrated portfolio with about a dozen stocks. So we typically limit our exposure to one stock per sector. Secondly, we like the foundry initiative. As a general philosophy, we always welcome initiatives to create additional diversification of revenue sources.
Be the first to comment