

Androsov
In a recent article, I put forth Tourmaline Oil Corp. (OTCPK:TRMLF), a large-cap natural gas producer, as a preferred high-yield income idea due to its industry-leading cost structure, promising growth prospects, and the possibility of transportation debottlenecking in the near future.
Subsequent to the publication of that piece, I was asked to share my favorite Canadian natural gas producers outside of the large and mid-cap categories. There are several natural gas producers up north that fall under the sub-$1 billion market cap, such as Pipestone Energy Corp. (OTCPK:BKBEF), which I have previously mentioned; Kelt Exploration Ltd. (OTCPK:KELTF), Crew Energy Inc. (OTCQB:CWEGF), Kiwetinohk Energy Corp. (OTCPK:KWTEF), Coelacanth Energy Inc. (OTC:CEIEF), and Pine Cliff Energy Ltd. (OTCPK:PIFYF).
In the following, let’s take a closer look at Pine Cliff.
Pine Cliff overview
Pine Cliff Energy is a natural gas producer with operations in the western Canadian provinces of Alberta and Saskatchewan, as shown in Figure 1. Over the time period of 2013 to the third quarter of 2022, natural gas has constituted the vast majority of the company’s total production, ranging from 86.1% to 96.5%.
Fig. 1. Main operating areas of Pine Cliff Energy (left) and the natural gas markets it sells to (right) (Pine Cliff Energy)
Pine Cliff sells its natural gas to five markets, in part through the use of three self-owned pipelines, enabling the optimization of physical deliveries based on market pricing. While the company primarily sold natural gas at prices comparable to the Canadian benchmark AECO, it did capture a premium in, e.g., 2017-2019 and the third quarter of 2022, as illustrated in Figure 2. As a consequence, Pine Cliff has attained an average premium of 9.0% since 2013.
Fig. 2. A comparison of Pine Cliff realized natural gas price with Canadian benchmark AECO, after hedging in $/GJ (upper) and before hedging in percentage (lower) (Pine Cliff and Laurentian Research based on data sourced from financial filings of the company)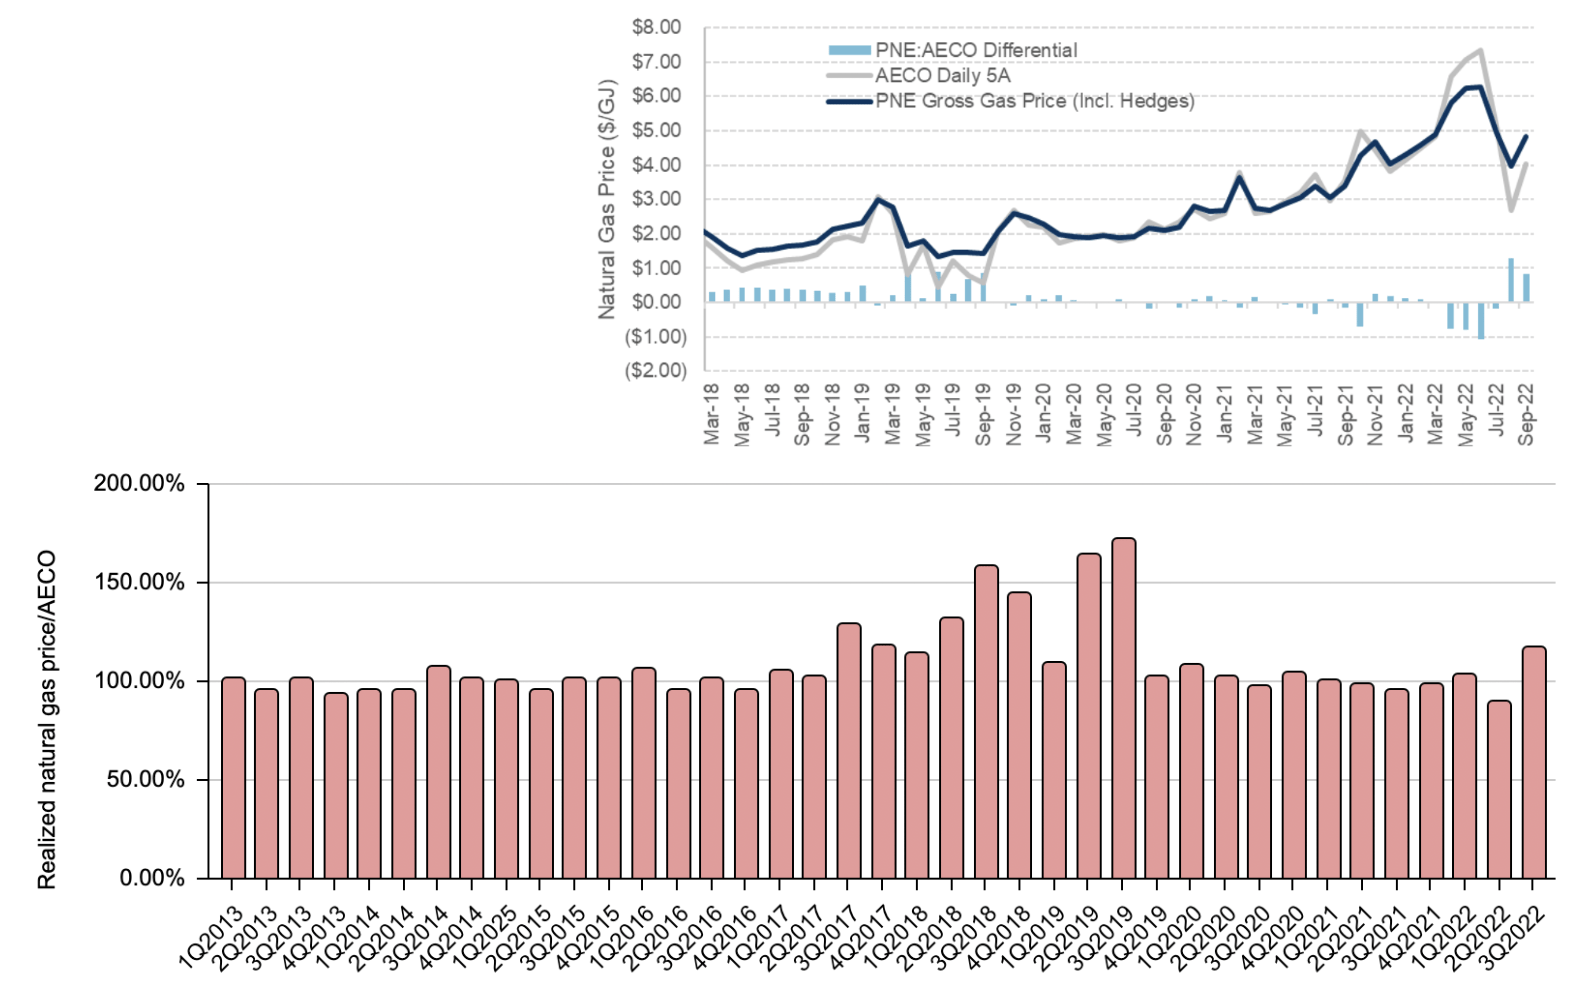
Production
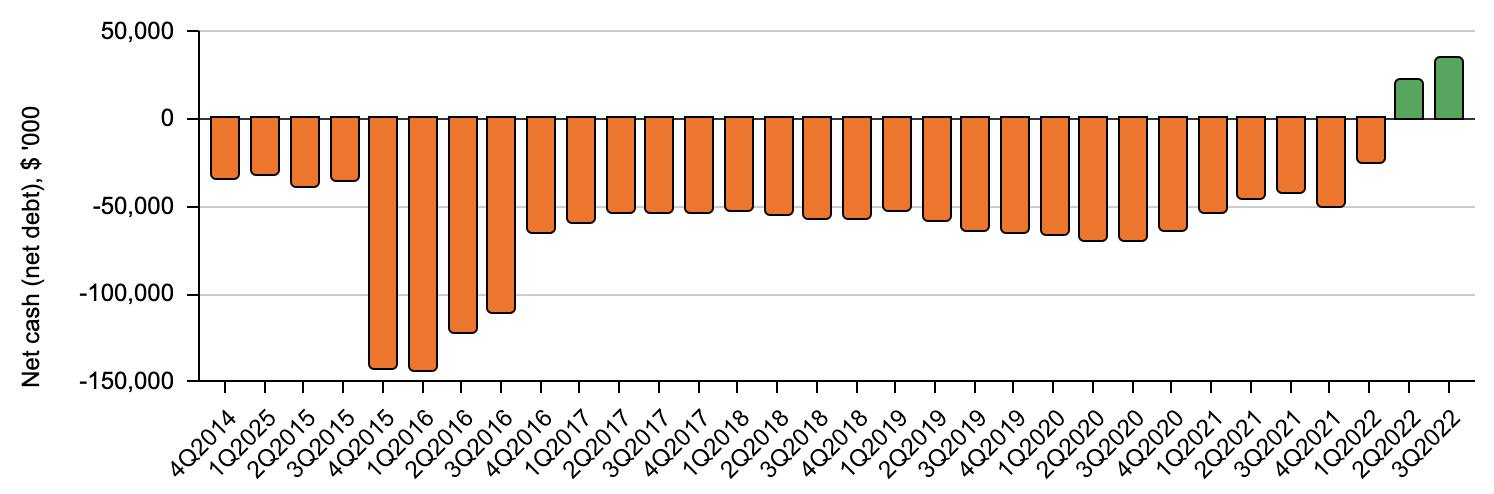
In December of 2011, George Fink and Phil Hodge assumed control of Pine Cliff, with Fink serving as Chairman and Hodge serving as CEO. Under their leadership, the company underwent multiple acquisitions from 2012 to 2015, which resulted in rapid production growth as seen in Figure 3, accompanied by a sharp rise in net debt, which reached over $140 million as depicted in Figure 4.
Fig. 3. Production profile of Pine Cliff Energy, 2013 to date (Laurentian Research based on data sourced from Seeking Alpha and Pine Cliff financial filings) Fig. 4. Net cash (net debt) position of Pine Cliff Energy (Laurentian Research based on Seeking Alpha and Pine Cliff financial filings)
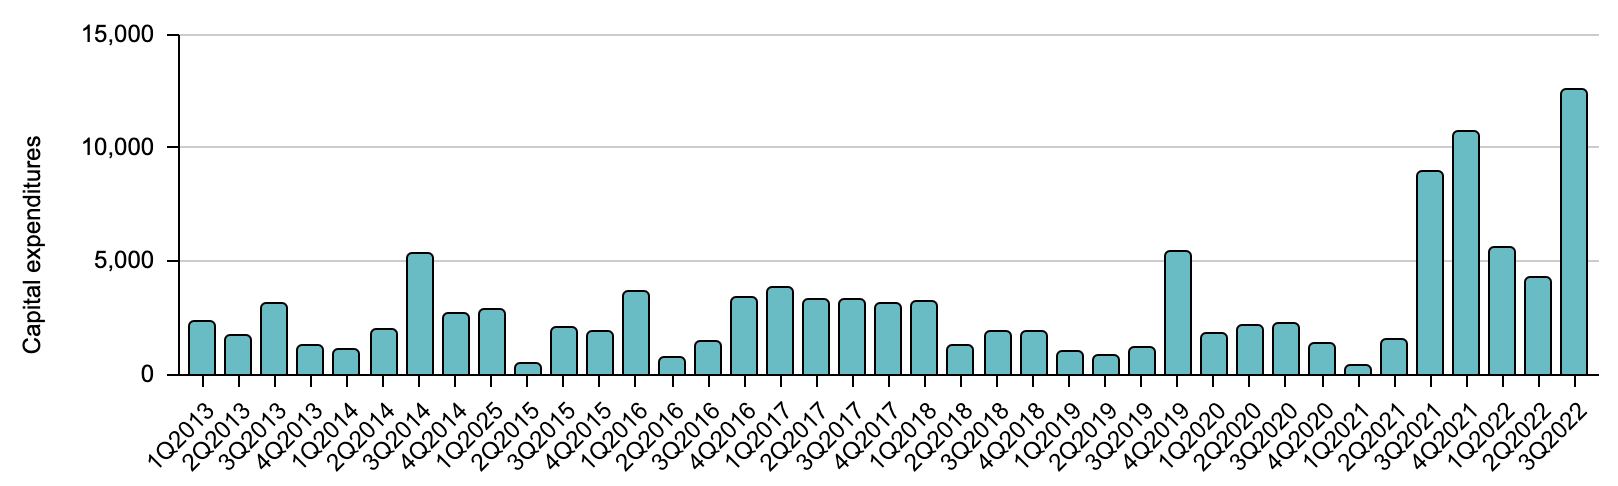
In response to persistent bear market conditions in the industry, Pine Cliff adopted a new strategy in 2016. Its assets have the lowest base decline rate among Canadian oil and gas producers, as illustrated in Figure 5. As a result, Pine Cliff was able to keep its capital expenditures at a low level until mid-2021, without experiencing a substantial decrease in production, as seen in Figures 6 and 3. When natural gas finally rebounded in the latter half of 2021, Pine Cliff increased its capital investments and started to expand production while simultaneously paying off its debt and reaching a zero balance.
Fig. 5. The base decline rate of publicly-listed Canadian E&P producers (Pine Cliff Energy) Fig. 6. Capital expenditures of Pine Cliff Energy (Laurentian Research based on data compiled from Seeking Alpha and Pine Cliff)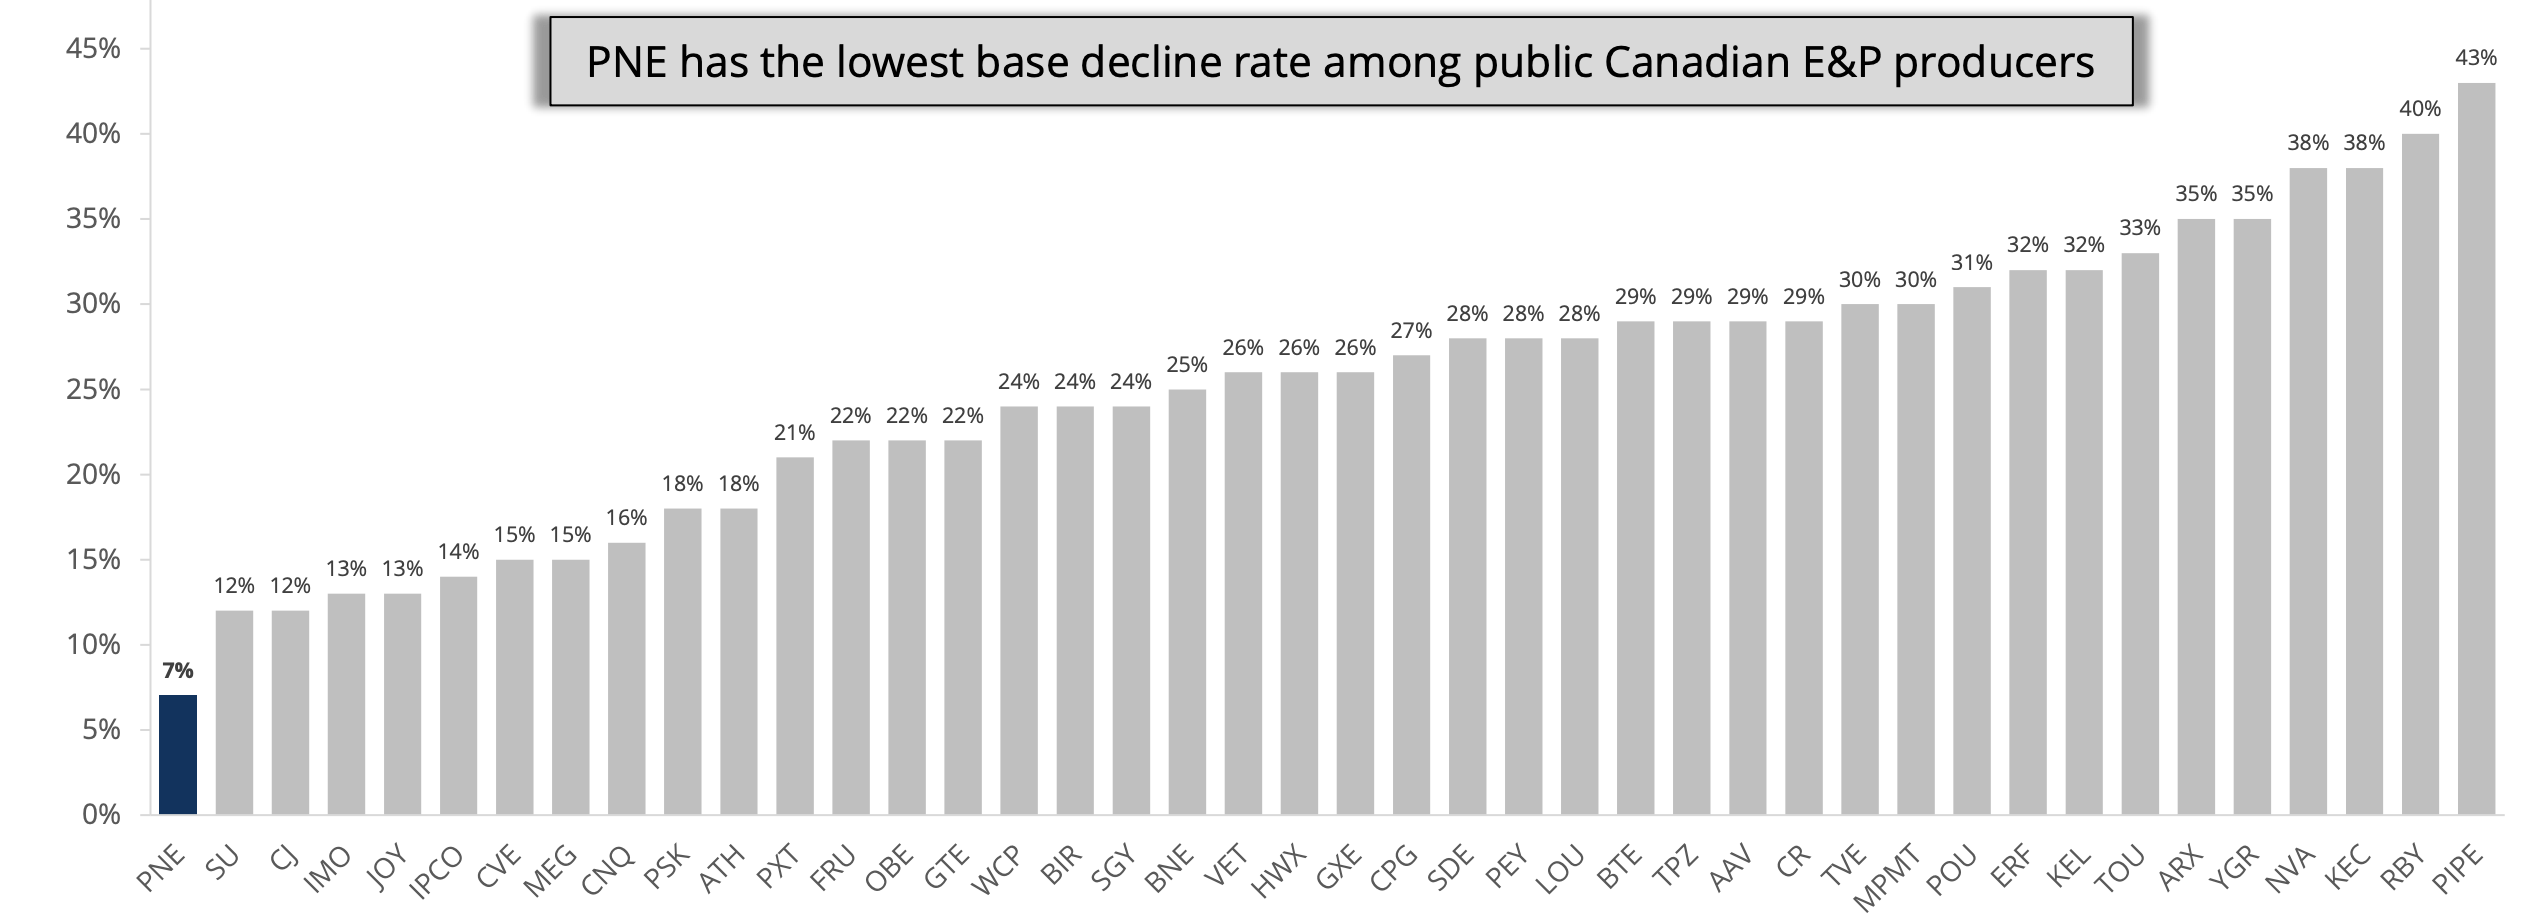
Financials
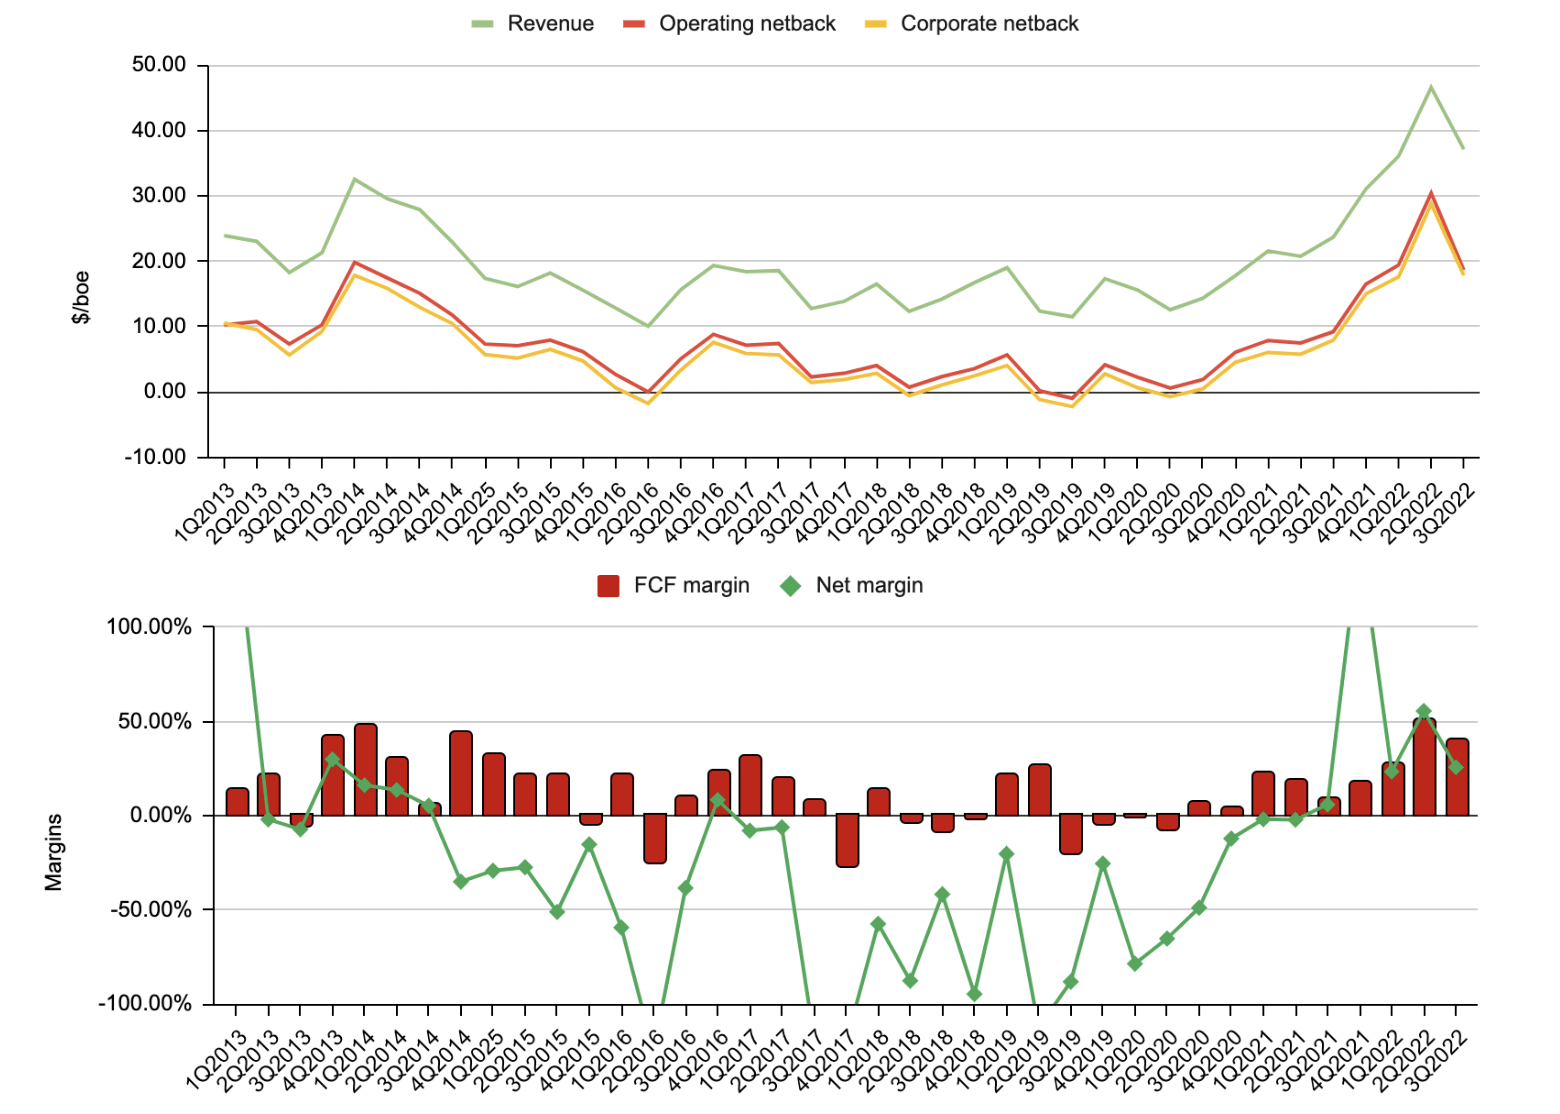
Since 2016, as production decreased, diseconomies of scale kicked in, resulting in a rise in unit cash costs, as illustrated in Figure 7. The operating netback and corporate netback per barrel of oil equivalent for Pine Cliff are mainly influenced by commodity prices, as depicted in Figure 8. It’s noteworthy that, similar to many other oil and gas producers, Pine Cliff’s free cash flow margin fluctuates less compared to its net margin. From 2013 to the third quarter of 2022, Pine Cliff incurred a cumulative loss of $148 million, however, it accumulated a total of $203 million in free cash flow. As of the third quarter of 2022, Pine Cliff’s tax pool stood at $271.9 million.
Fig. 7. Cash costs per boe of Pine Cliff Energy (Laurentian Research based on Seeking Alpha and Pine Cliff financial filings) Fig. 8. Operating netback and corporate netback per boe as compared with realized total price for Pine Cliff (upper); FCF and net margins (lower) (Laurentian Research based on Seeking Alpha and Pine Cliff financial filings)
Thanks to improvements in margins and, to a less extent, production growth, Pine Cliff Energy generated record net earnings and free cash flow, as illustrated in Figure 9.
Fig. 9. Revenue before royalties, adjusted funds flow, net earnings and FCF of Pine Cliff Energy (Laurentian Research based on Seeking Alpha and Pine Cliff financial filings)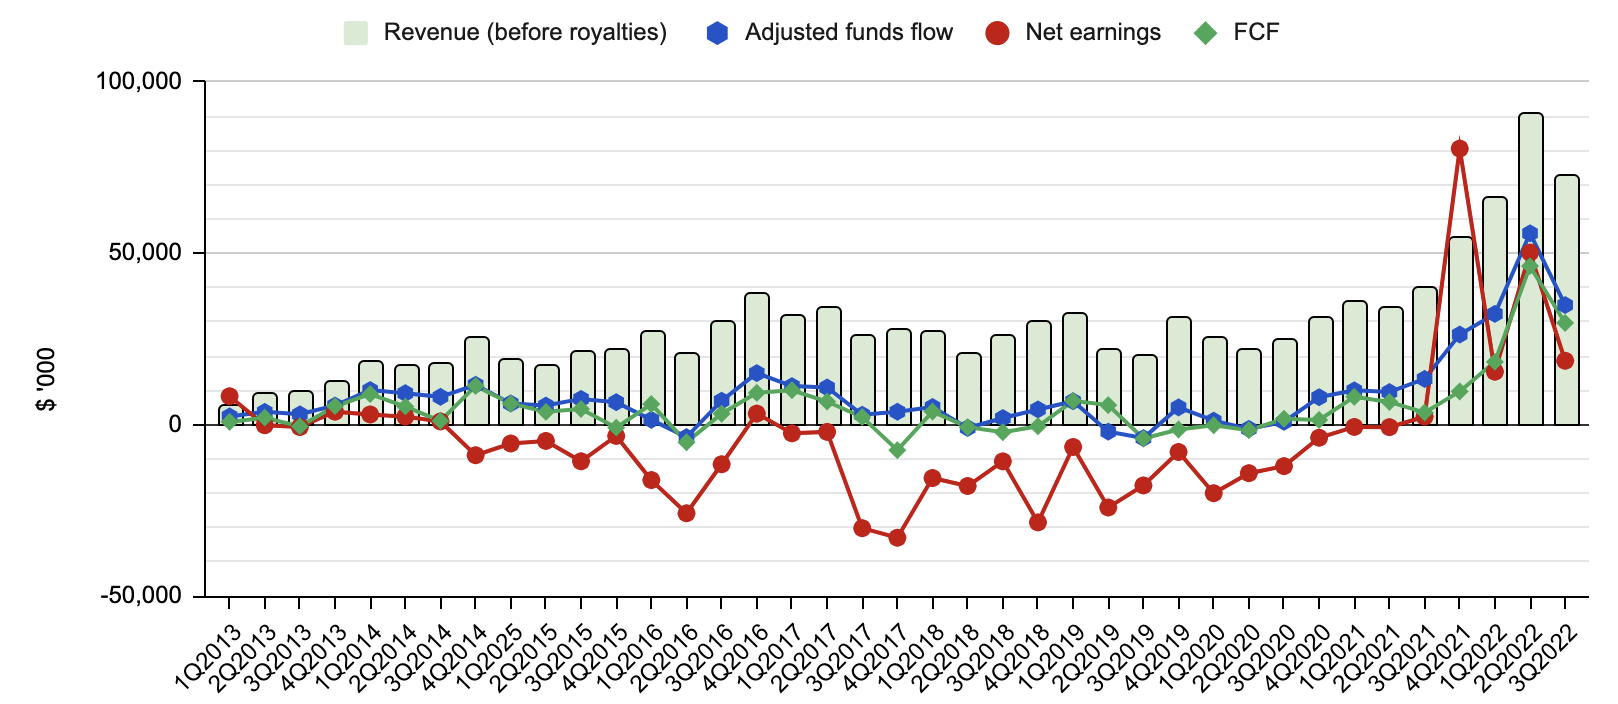
Dividends
With a strong cash flow, Pine Cliff initiated a monthly dividend in June 2022 as a way to return capital to its shareholders. The company has increased the dividend twice since then, and the current forward annual dividend stands at $0.13 per share, resulting in a dividend yield of 10.57%.
Pine Cliff allocates 1/3 of its free cash flow towards dividends, a payout that is lower than the average for Canadian oil and gas producers.
Pine Cliff considers its $0.01083 per share monthly dividend to be secure as long as the benchmark AECO remains above $2.62/Mcf. If AECO stays above that level, it is estimated that the funds flow will be sufficient to cover all cash expenses, capital expenditures, corporate taxes, and dividends, as depicted in Figure 10.
Fig. 10. Sensitivity of surplus cash after capex and dividends and 2023 free funds flow yield to the AECO gas price, under US$80/bo WTI (Pine Cliff Energy)
Valuation and risks
The increase in AFFO since 2021 makes Pine Cliff Energy Ltd. look underpriced compared to its historical EV/AFFO ratios, as shown in Figures 9 and 11. As of February 10, 2023, it was valued at 3.1 times the run-rate of 3Q2022 adjusted funds flow. It is worth noting, however, that some of its Canadian natural gas producing peers, e.g., Tourmaline Oil, have even lower valuation multiples.
Fig. 11. Enterprise value to funds flow multiple, from 2013 to date (Pine Cliff Energy)
Pine Cliff is currently trading at $8.71 per barrel of oil equivalent of proved reserves or $6.81/boe of proved and probable reserves. In terms of the price-to-net-asset-value (P/NAV) multiple, it is valued at 2.0 times for proved reserves or 1.6 times for proved and probable reserves. These multiples are based on the end-2021 reserve data as presented in Table 1. Having a higher percentage of reserves in the proved developed producing category (73.2% compared to 22.6% for Tourmaline Oil), Pine Cliff seems to be cheaper than Tourmaline Oil in terms of EV/1P reserves, but is more expensive with regards to EV/2P reserves as it has fewer probable reserves than Tourmaline Oil.
Table 1. Reserves (upper) and before-tax NPV-10 (lower) of Pine Cliff as of December 31, 2021 (Pine Cliff Energy)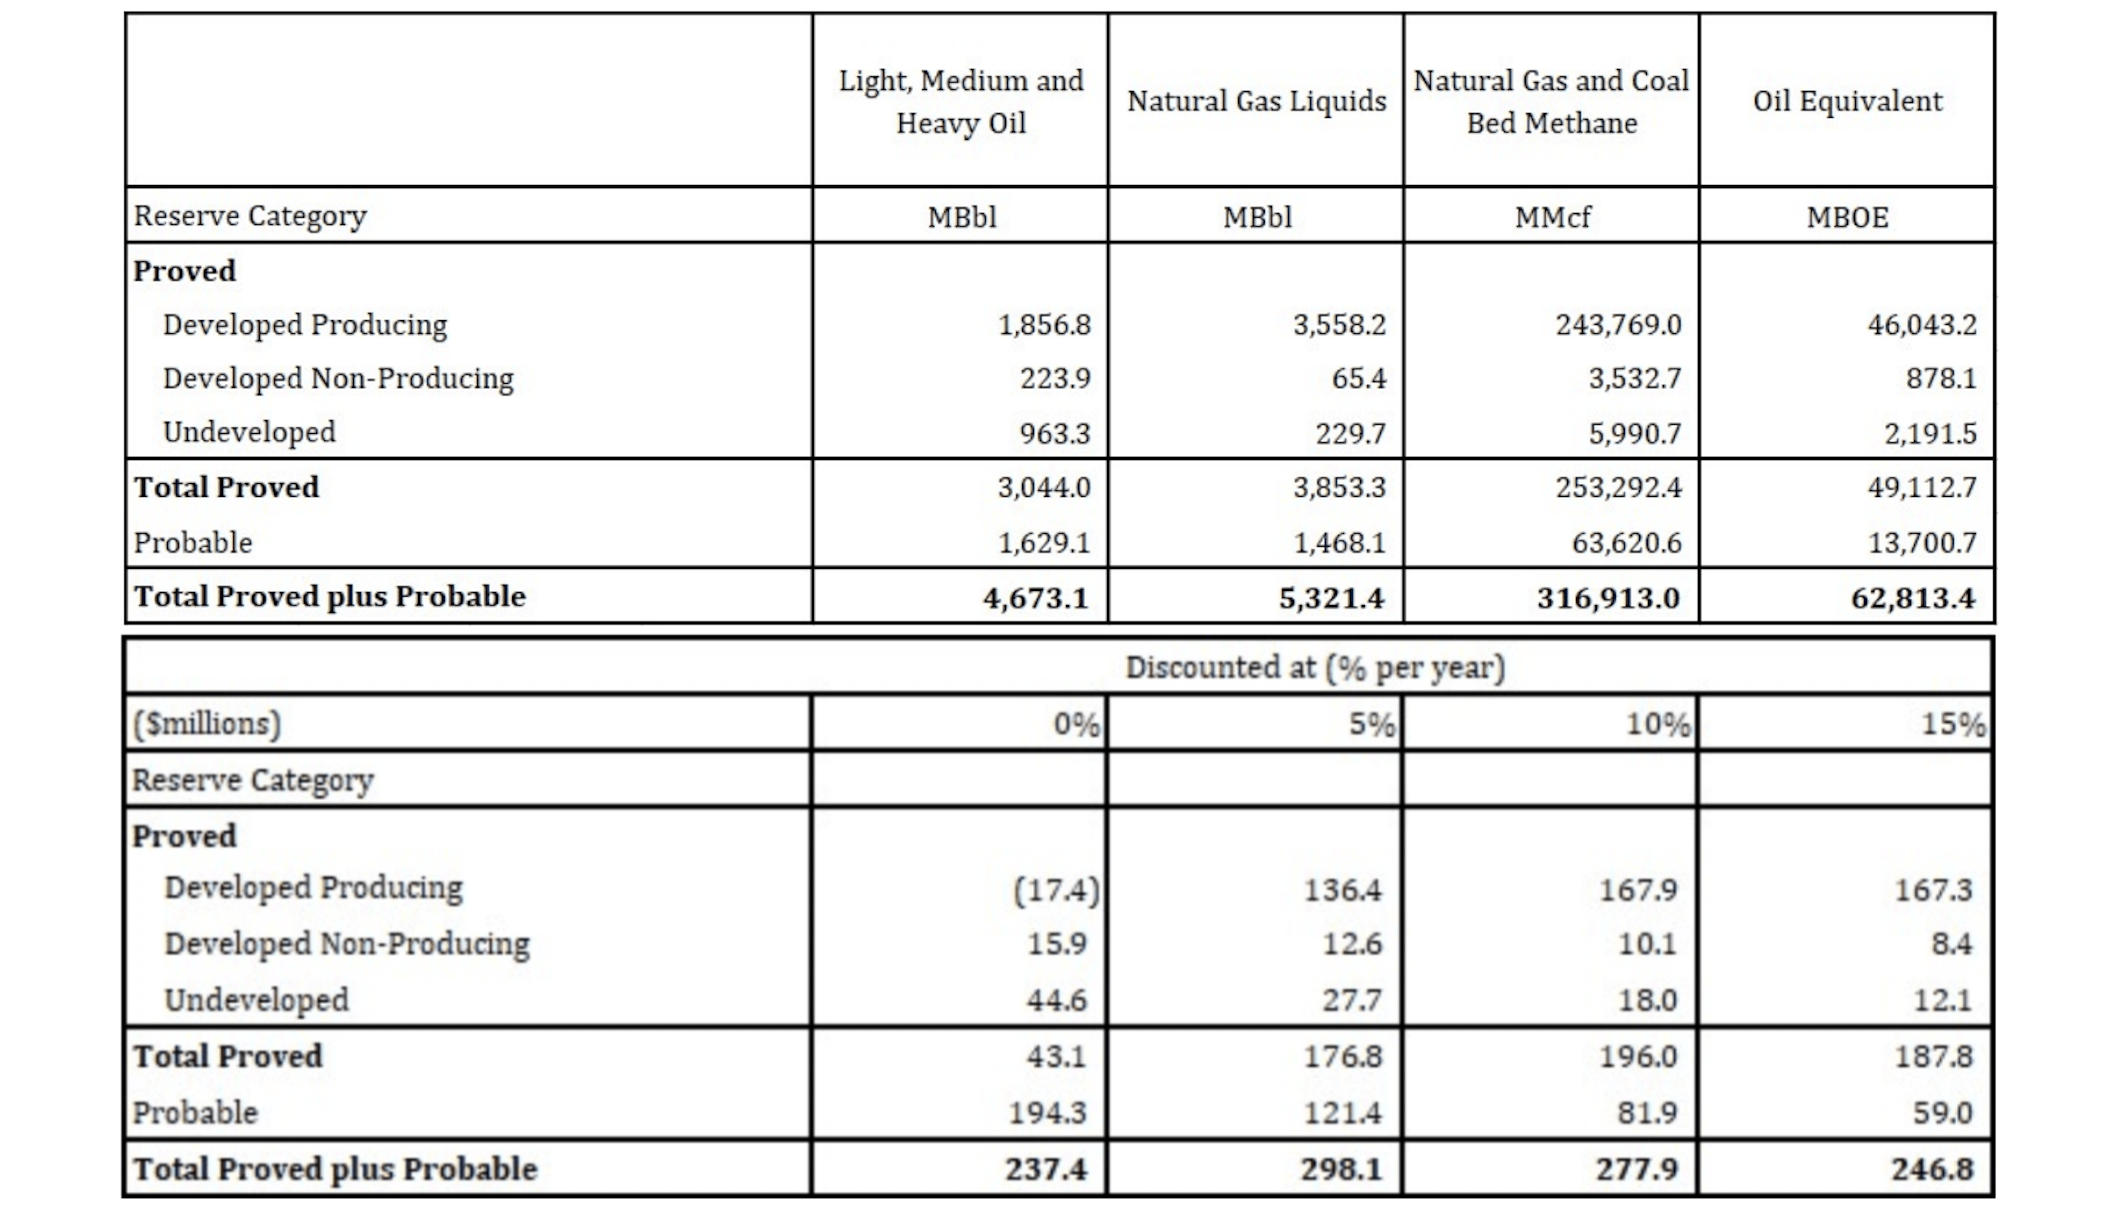
- It is anticipated that by March 2023 when the end-2022 reserve data are released, Pine Cliff will have significantly increased its reserves and corresponding NPV-10, which is expected to further highlight the stock is undervalued relative to its assets. Pine Cliff’s 2022 capital program of $31.5 million included the drilling of 11 wells, which is expected to result in reserve growth (Fig. 6). The 2021 reserves were based on average prices from three consultancies of $3.56/MMbtu for AECO natural gas and $72.83/barrel for WTI oil. However, it is now known that AECO averaged $5.55/MMbtu in 2022 and is projected to average $4.23/MMbtu in 2023 and $4.40/MMbtu in 2024, while WTI averaged $94.65/barrel in 2022 and is expected to average $80.33/barrel in 2023 and $78.50/barrel in 2024, which is expected to positively impact reserve booking.
Risks
The biggest threat to Pine Cliff shareholders likely comes from the highly unpredictable natural gas prices. There has been a significant decrease in natural gas prices since late 2022, and as of early February 2023, the AECO natural gas price is around $2.4 to $2.5 per thousand cubic feet (Mcf). If the AECO price remains below $2.62/Mcf for an extended duration, Pine Cliff may have to reduce its dividends despite its strong net cash position.
Pine Cliff boasts some of the lowest decline rates in the industry, which allows the company to reduce its capital expenditures during times of low natural gas prices, which along with its zero debt balance sheet provides stability for the business. However, its reserve life indices are relatively low, with a proved reserve life of 6.3 years and a proved and probable reserve life of 8.1 years, compared to the industry leader Tourmaline Oil’s proved reserve life of 10.6 years and proved and probable reserve life of 20.3 years. Due to its limited potential for organic reserve growth, with only 55.4 unbooked drilling locations as of the end of 2021, Pine Cliff may have to make asset acquisitions in the future to replenish its reserves, which may introduce uncertainties if commodity prices soar.
The unit cash costs trend higher due to stagnate production and resultant diseconomies of scale; however, this trend may be reversed as the company further expands its capital program and makes accretive acquisitions of assets in the future.
Pine Cliff management is led by President and CEO Philip B. Hodge and chairman George Fink. The board of directors and management collectively hold 11.0% of the outstanding shares, including Fink’s 7.36% and Hodge’s 2.73%. This significant investment by the management and board of directors aligns their interests with those of retail investors. Furthermore, insiders recently bought shares in the public market on February 1, 2023. The government of Alberta, a stable institutional investor, holds 36,056,954 shares of Pine Cliff through Alberta Investment Management Corp., which represents 10.29% of the total shares.
Investor takeaways
Pine Cliff Energy has emerged as a source of high-yield income since it initiated monthly dividends in June 2022, thanks to its industry-leading low decline rates and a debt-free balance sheet, which should help the company weather low commodity prices.
Fig. 12. Stock chart of Pine Cliff Energy, dividends back-adjusted, shown with dividend payments and 200 DMA (modified from Seeking Alpha and Barchart)
Pine Cliff’s stock has been experiencing a period of consolidation since mid-2022, likely due to the decrease in natural gas prices from its recent peak, as illustrated in Figure 12. With the AECO natural gas price hovering around $2.40-2.50/Mcf, it is unclear whether the company will defend the 10.57%-yielding dividends. Given this short-term uncertainty, it may be prudent for risk-averse income investors to hold off additional investing in this stock for now and monitor the natural gas market for a clearer indication.
Editor’s Note: This article discusses one or more securities that do not trade on a major U.S. exchange. Please be aware of the risks associated with these stocks.
Be the first to comment