

peterschreiber.media
Investment Summary
Following an extended period of downside Integra LifeSciences Holdings Corporation (NASDAQ:NASDAQ:IART) looks to have found a bottom with shares having bounced from 52-week lows last week. Despite its CereLink recall last month little of fundamental value has changed for IART, especially as it hasn’t drifted far from converting on its long-term pipeline.
Moreover, punishment it copped secondary to the news has created a pricing asymmetry with the potential for shares to re-rate to the upside in my estimation. We have been long IART since FY20 and have had to revisit the position with serious thought in FY22, although on this most recent inspection, the dislocation in market value to drivers of corporate value is too wide to ignore in this instance. I rate IART a buy on a $53 December 2022 price target.
CereLink recall remains key overhang
Around 1 month ago in August the company, along with the FDA and respective authorities outside of the US, initiated an “immediate voluntary global product removal of all CereLink intracranial pressure monitors”. The recall came as a result of user reports the device may display readings of patient intracranial pressure (“ICP”) that are out of range.
There are purportedly 105 global complaints associated with the recall [as of July 31] whereas the FDA says it is aware of approximately 68 medical device reports (“MDRs”) concerning the issue – including 1 death. Following the reports, Integra sent a letter to customers on 23 August to immediately stop using the CereLink ICP and switch to alternate monitoring systems for new patients. According to the FDA’s summarized report on the issue:
“The patient death reported in the MDR described a malfunctioning CereLink ICP Monitor during use in a critically injured patient, which was mitigated by replacing the ICP sensor. The cause of patient death was determined by Integra to be unrelated to the CereLink ICP Monitor malfunction.”
Integra echoed this sentiment in its response to the issue, stating the malfunction is likely due to the “external environment”, or similar. It noted:
“The Company believes that the out-of-range readings are principally caused by electrical interference from the external environment and/or interference from a component on the circuit board of the monitor.
These out-of-range readings have occurred at a low incidence rate and at a limited number of sites; however, out of an abundance of caution, the Company has decided to remove all CereLink monitors from the field.”
This is a stark contrast to language used on the Q2 earnings call back in July, where management were optimistic on the launch curve of the product. Three things we had noted from the call, regarding IART’s initiatives/expenses on the segment:
- IART had set out its “multi-year global growth trajectory for CereLink” by this point.
- It had expanded the salesforce with a new focus on new acquisition, ACell [acquired in Jan 2021].
- It added >200 new ACell users in Q2.
Therefore 1 from 3 of these initiatives is now presenting with a far higher execution risk than before.
Naturally, investors didn’t/haven’t take[n] kindly to the news, pushing the IART share price to its 52-week low by last week of trade. However, the reactivity and resulting price distribution was more a continuation of a downtrend that’s been in situ since September 2021. Hence why I estimate the stock found and then reversed off the 52-week in such relatively quick succession, as seen in Exhibit 1. Presume that IART has now in fact completed the entire run of this downside move, seen below – the question then turns to whether it can retrace [if any] a good percentage of the gains, and at what speed.
Shares have traded back up to the longer-term support level, and with respect to price action, the next price target on the fib is at $52, whereas 50% of the move is ~$61.50. We’d need to see a reversal in the trend indicators shown before as well [on balance volume and momentum] in order to somewhat validate the move, it were to surge towards these levels. There’s been heavy mean reversion activity across the period show, and the IART share price is currently retracing back towards the mean, as seen below. Exhibit 2 demonstrates that the current distribution of pricing is also a key zone for IART based on historical data.
Exhibit 1. IART 12-month price action – downside move has been in situ since Sep FY21′
- Investors priced in the CereLink news swiftly and the debate is now centred around the disconnect in fundamentals to share price
- Question is, is the entire move now completed? Or are we in a period of mean reversion?
- Long-term trend indicators must also be supportive to indicate a breakout above these levels
Note: Daily bars shown with momentum [14] & On balance volume [OBV]. Fibonacci retracement drawn from high of Sep FY21′ to low of Sep FY22′; approximately 12 months of price action. (Data: HB Insights; Refinitiv Eikon)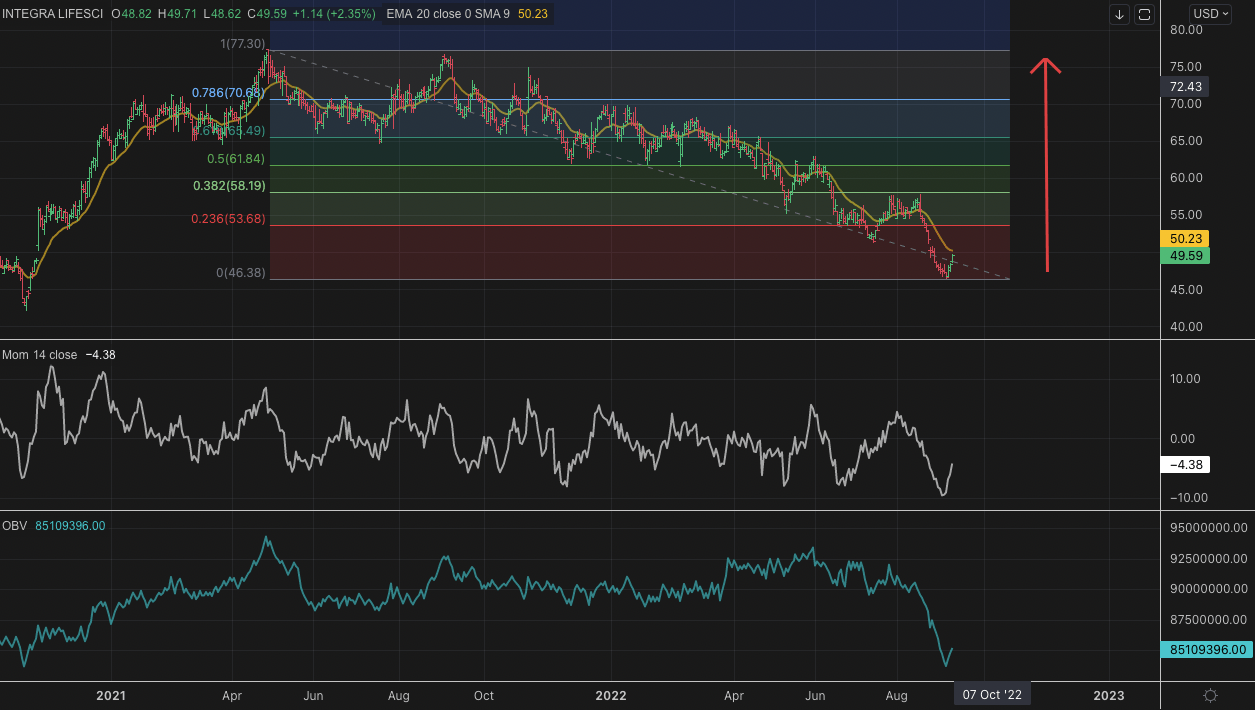
Exhibit 2. $49-$50 price levels also appear to be key long-term support levels for IART and it is currently testing this relationship with force at present
Data: Refinitiv Eikon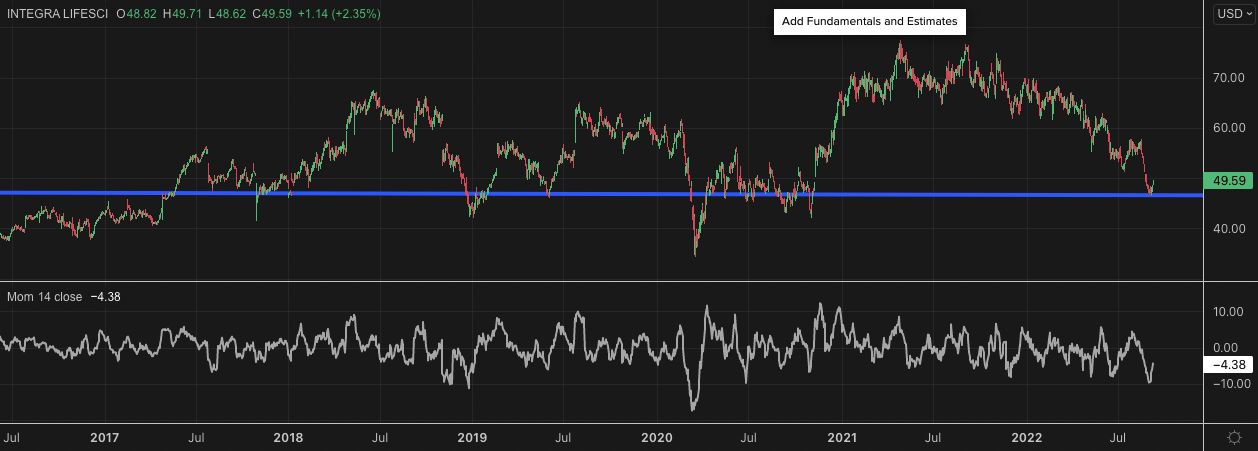
Nevertheless, the CereLink issue remains a key overhang for the IART share price looking ahead. The market isn’t playing ball any more with even a whisper of negative news being priced in to the downside swiftly and with deep effect.
Fundamentals remain unchanged
The investment opportunity remains at large in IART, I estimate, based on the fact fundamentals remain relatively unchanged following the decision. Whilst the market has done a good job at recognizing risk and pricing it in, there’s a firm case to suggest investors will also recognize the pricing asymmetry this has subsequently caused. The following series of charts helps display the key features in the investment debate with great effect.
Firstly, the impact to overall earnings is said to be minimal from management. As Exhibit 3 shows [taken from IART’s recent 8-K] it has assigned a provision of ~$9mm for Q3 FY22 and adjusted FY22 guidance accordingly, to accommodate for any potential impact.
Exhibit 3. IART Q3 provision and FY22 guidance adjustments following CereLink recall
Data: IART 8-K August 2022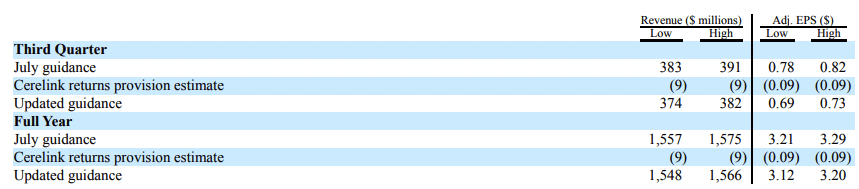
As seen in Exhibit 4, IART continues to deliver earnings growth vertically throughout the P&L on a sequential basis. It has done this since FY16 [ex-Covid impact] and investors have realized an impressive growth in free cash flow return on equity (“FCF ROE”) over this period to date. I like FCF ROE as a measure of investor profitability as it examines how much cash is behind the valuation and more importantly, the cash return owed to shareholders.
This is important, because the CereLink news makes no change to the growth trajectory of these trends. Therein lies the key downside risk to my investment thesis – that the CereLink outcome will have a worse-than-expected result.
Exhibit 4. Strong vertical growth trends for IART on a sequential basis since FY15
- Since FY20 free cash flow and profitability measures have remained buoyant.
- FCF ROE shifting upwards into weakening economic outlook = bullish indicator by my estimate.
- Cash earnings are strong and this is realized throughout the P&L, creating strong fundamental momentum looking ahead.
- Nothing about the CereLink recall changes the outlook for these long-term trends, by estimate.
Note: All figures in $mm or [%]. Free cash flow return on equity calculated as: FCF [NOPAT – investments] with no GAAP reconciliations, divided by shareholder equity on a quarterly basis. (Data: HB Insights; IART SEC Filings)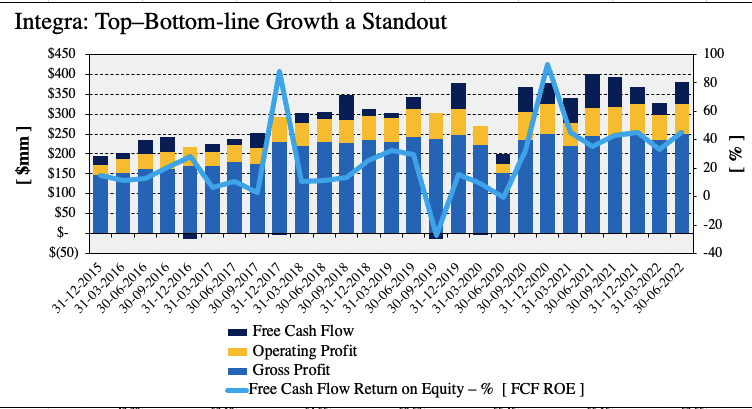
The following two charts [Exhibit 5 and Exhibit 6, respectively] further exemplify the dislocation in fundamentals to current market value. As seen in Exhibit 6, IART’s return on investment (“ROIC”) has remained cyclical and snaked upward over the 7-year period to date, alongside FCF yield. As is shown, we are now receiving stable, increasing ROIC whilst paying FY18 market capitalization(‘s) for IART creating a fundamental tailwind that I believe has yet to be recognized by the market. Meanwhile, debt levels have remained constant and contained across this time. This must be factored into the valuation debate.
Exhibit 5. ROIC continues to cycle higher despite recent consolidation in market capitalization
- Investors now pay FY18 market capitalization to receive robust trailing return on investment.
- The convergence of ROIC to market value is a bullish tailwind that investors may not have yet recognized, creating an alpha opportunity.
- The question that remains is how long this alpha will take to be recognized, and to what magnitude.
Note: All figures in $mm or [%]. Return on invested capital calculated as TTM NOPAT / Invested capital. FCF yield calculated as function of enterprise value on TTM basis at end of each period. Market capitalization taken at end of/date of each reporting period. (Date: HB Insights; IART SEC Filings)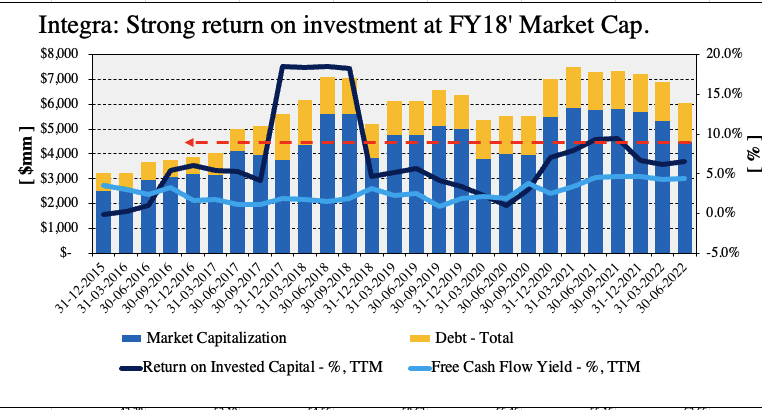
Perhaps Exhibit 6 displays the underlying trends in more clarity. As is seen, the cyclicality in IART’s CAPEX and capital budgeting cycle looks to front-run deviations in its market value, particularly to the upside. In the 3 separate upturns in ROIC noted below, each was preceded by a convergence of market cap to ROIC. Following each uptick, the company’s market cap has followed suit, as shown below on a quarterly basis. The dispersion of the relationship is quite wide [weak causal], but it is directionally strong. With investors punishing the stock heavily in August-September we’ll now get to test the validity of this relationship looking ahead.
Exhibit 6. Each major upturn in ROIC has led a subsequent upshift in market capitalization. Will this relationship hold?
Note: See: Exhibit 5. for calculations of each measurement. (Data: HB Insights, IART SEC Filings)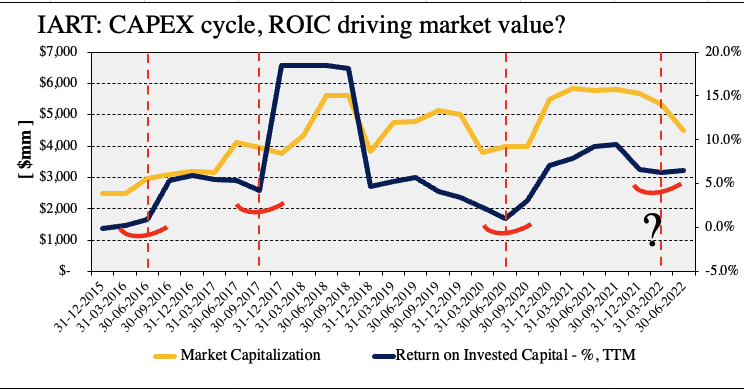
Valuation and conclusion
Shares are trading at a discount to peers from the GICS industry across all multiples used in this analysis. In particular, 17x forward earnings looks attractively priced on face value, especially given the earnings resiliency stated in the sections above. This adds further weight to the investment debate.
We are paying 2.5x book value for steady and growing ROIC and double digit FCF ROE – more than can be said for other names in the group trading at similar multiples. This represents compelling value from a tactical allocation perspective by my estimate as we’ve now narrowed down the opportunity cost decision at these discounted multiples. Consensus estimate have IART to print $3.17 in FY22 EPS and at 17x this figure a price objective of $53 looks appropriate to me for the time being.
Exhibit 7. Multiples and comps analysis
Data: HB Insights; Refinitiv Datastream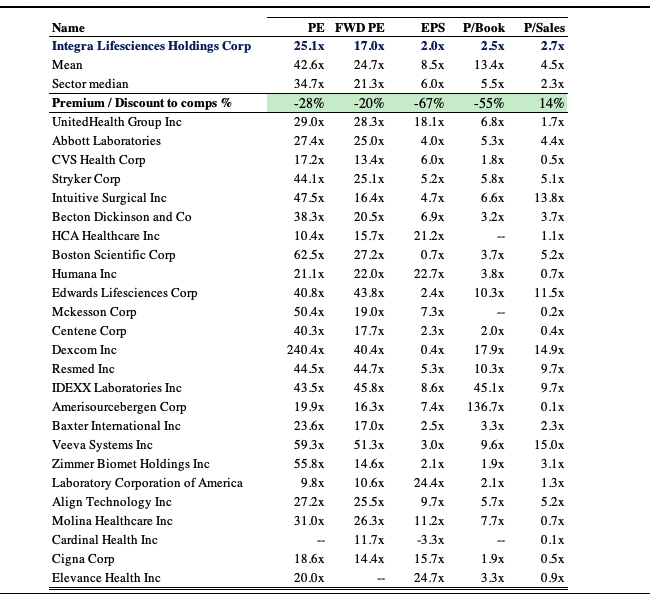
With the summation of these points in mind, our team has remained long IART and are ready to size up the position even further with price confirmation at the levels outlined in Exhibit 1. Shares are trading at a respectable discount to peers and to historical market value, based on historical fundamental data. I believe the market has unfairly punished IART and that there’s a good case to be made for shares to re-rate back to the upside. I rate IART a buy with a $53 December 2022 price target.
Be the first to comment