

Drew Angerer/Getty Images News
Thesis
It is no secret that the healthcare sector has been under pressure for years. Healthcare costs have been rising faster than overall inflation for decades and policymakers have been working on the issue for years. The long battle between the industry and lawmakers has culminated in the recent signing of the Inflation Reduction Act (“IRA”). The main components of the act are summarized below (readers are highly encouraged to read the entire pdf – it is only 1 page anyway). And the part relevant to today’s discussion is the prescription drug pricing reform, estimated to create a total of $265 billion impact on the drug sector. The impact will come in different phases. And the first phase starts next year when vaccines will be required to be free and pharmaceutical companies will be required to pay rebates if their drug prices rise faster than inflation. And further restrictions on price raises will kick in gradually. For example, in 2025, a cap of $2000 will be implemented for out-of-pocket spending on Part D drug costs. The healthcare sector and major drug stocks did not show large price movements (as you can see from the second chart below) because the effects have been fully anticipated by the market for a while.
Source: democrats.senate.gov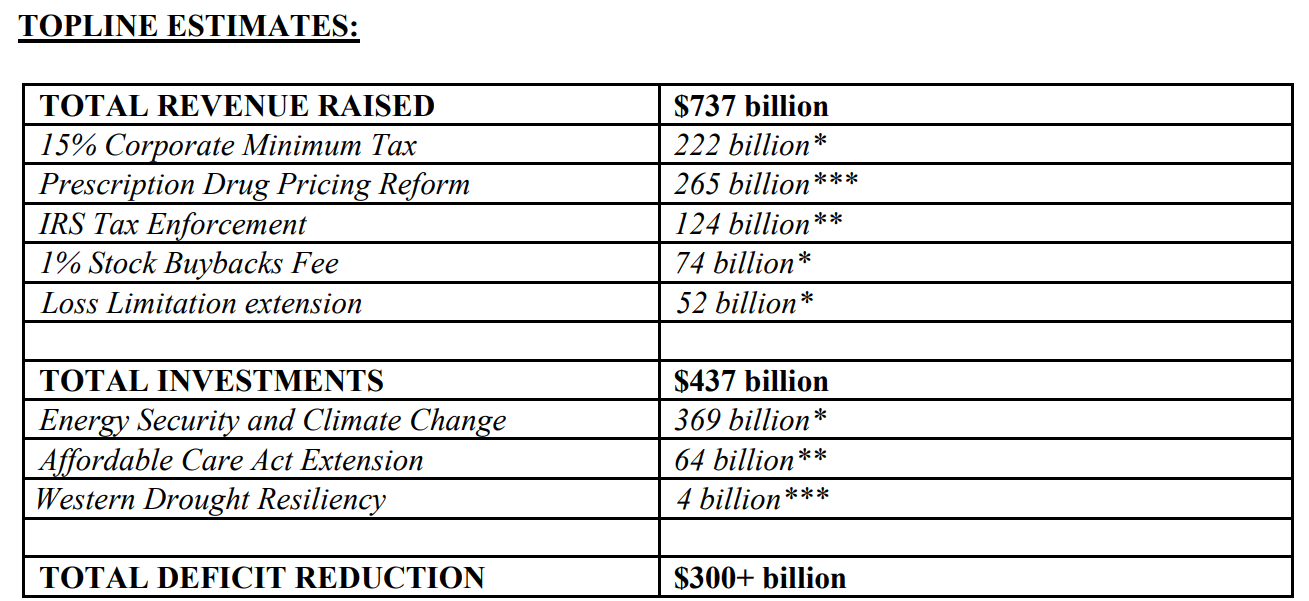
Against this background, the thesis here is that I do not take a bearish view of the healthcare sector because of the IRA. On the opposite, I view the sector, represented by the Vanguard Health Care ETF (NYSEARCA:VHT), actually providing a reasonably attractive risk/reward profile under the current conditions. The valuation pressure in recent years has already priced in much of the impact already. Especially, a leading stock in the sector, Amgen (NASDAQ:AMGN), provides an even more attractive profile given its superior profitability and appealing valuation. I view both the stock and the sector to keep enjoying secular support as our population ages and becomes more health conscious. Such support will keep maintaining their resilience over the long term. And the price actions below provide yet another demonstration of such resilience. As you can see, the overall market has suffered a roughly 13% total loss YTD. In contrast, despite the passing of the IRA and other market turmoil, VHT suffered a total loss of only 8.5%. And AMGN actually delivered a positive total return of more than 10%.
Next, you will see that both VHT and AMGN are also attractive when compared to other market sectors.
Seeking Alpha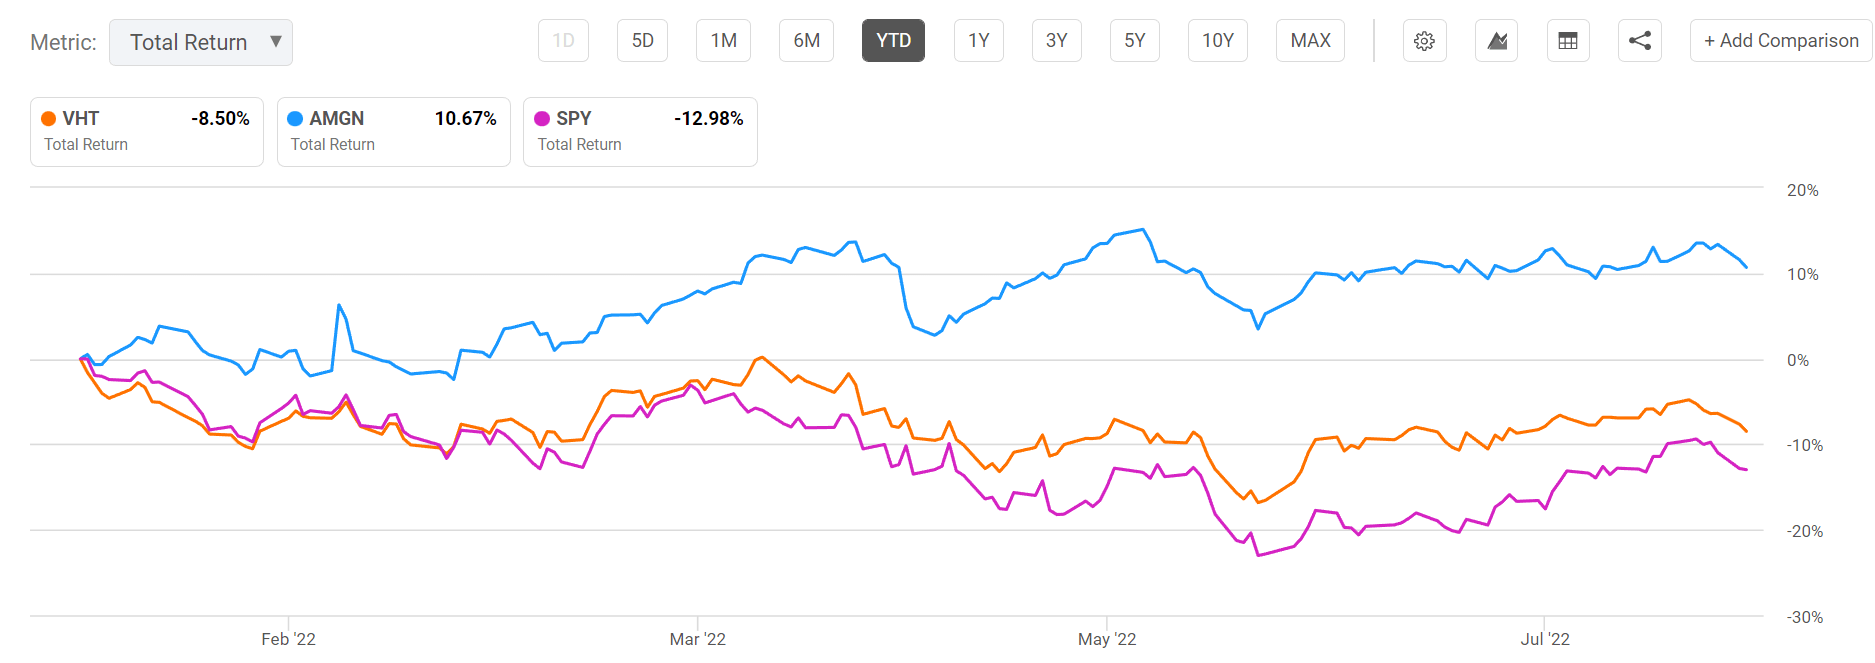
VHT and our market dashboard
As you can see from our following market dashboard (and you are welcome to download it here), the healthcare sector is currently one of the more attractive market sectors based on its dividend yield and the yield spread relative to the risk-free rates.
Ranked either by the yield spread relative to the risk-free rates or its dividend yield relative to its own historical yield, it is currently the 5th most attractive sector. Its current dividend yield is above its historical average by approximately 28% (as indicated in the positive dividend yield Z-score of 0.28). Although admittedly, its yield spread is below the historical average (as indicated in the negative dividend spread yield Z-score of -1.06). And we will elaborate on the implications later.
Finally, note that the above results are applicable to other healthcare sector funds such as the Health Care Select Sector SPDR (XLV) and iShares U.S. Healthcare ETF (IYH) due to their very similar indexing methods.
Author
As you can see from the next chart below, compared to the sector, AMGN is even more attractive. Note that the data in this chart are taken from Yahoo Finance and Seeking Alpha after the market close on August 23. These numbers might have changed a bit when you read this article. More specifically, AMGN provides superior profitability. Its return on capital employed (“ROCE”) is about 60%, more than 2x higher than the sector. It also provides better consistency and growth. It has been growing its dividend consecutively for 10 years at a CAGR of 11.2%, compared to VHT’s 10.3%. Yet its valuation is at a discount relative to VHT by about 26% in terms of price/cash flow multiple and by about 4% in terms of PE ratio.
And next, you will see that if we use dividends as an approximation for owners’ earning yield, AMGN’s valuation discount is even more than what is on the surface.
Author based on Yahoo and Seeking Alpha data.
VHT and AMGN: dividend yield comparison
Here we will compare their valuation using dividend yields and yield spread. Details of these concepts and approaches have been provided in our earlier article. Dividend yields and yield spread are what we first check before making any investment decisions. We’ve fortunately had very good success with this approach because of:
- The common PE or Price/cash flow multiples provide partial and even misleading information due to the differences between accounting earnings and owners’ earnings.
- Dividends provide a backdoor to quickly estimate the owners’ earnings. Dividends are the most reliable financial information and least open to interpretation. In investing, we always prefer a simpler method that relies on fewer and unambiguous data points rather than a more complicated method that depends on more ambiguous data points.
- The dividend yield spread (“YS”) is based on a timeless intuition. No matter how times change, the risk-free rate serves as the gravity on all asset valuations and consequently, the spread ALWAYS provides a measurement of the risk premium investors are paying relative to risk-free rates. And similarly, the yield spread between two securities always measures their risk premium relative to each other. A large spread provides a higher margin of safety and vice versa.
For these reasons, the short-term returns are closely correlated with the yield spread for funds or stocks that have demonstrated stable earning powers and dividends. And as an example, the correlation for VHT is shown in the chart below. This chart shows the two-year total return (including price appreciation and dividend) from VHT when the purchase was made under different yield spreads relative to 10-year treasury rates. You can see that there is a clear positive trend, and the Pearson correlation coefficient is quite strong at 0.68.
And as aforementioned, VHT’s current yield spread is below the historical average and the dividend spread yield Z-score is -1.06. Such a negative Z-score means that its current yield spread (which is -1.72%) is close to the thinnest end of the historical spectrum as you can easily confirm from the chart below. So, the risk premium relative to treasury rates is relatively higher. However, as you can see, the fund has never lost money in any 2-year period in terms of total return, again demonstrating the resilience of the healthcare sector.
Author based on Seeking Alpha data.
And the next two charts show the yield spread of AMGN relative to the 10-year treasury rates and also relative to VHT. Now, you can see why AMGN’s valuation discount is even more attractive than what is shown by the price/cash flow and PE ratios.
As can be seen from the first chart, the spread relative to 10-year treasury rates has been bounded and tractable most of the time. The spread has been in the range between about -1.0% and 1.25% the majority of the time during the past decade. And the average spread is about 0.25%. Currently, the yield spread is close to the historical mean, signaling a very manageable risk premium relative to risk-free interest rates.
As can be seen from the second chart, the spread relative to VHT itself is near a peak level in a decade, signaling AMGN’s very low risk premium relative to the average sector just even if we just consider valuation alone.
And next, we will see that AMGN not only provides much lower valuation risks but also far better profitability.
Author based on Seeking Alpha data. Author based on Seeking Alpha data.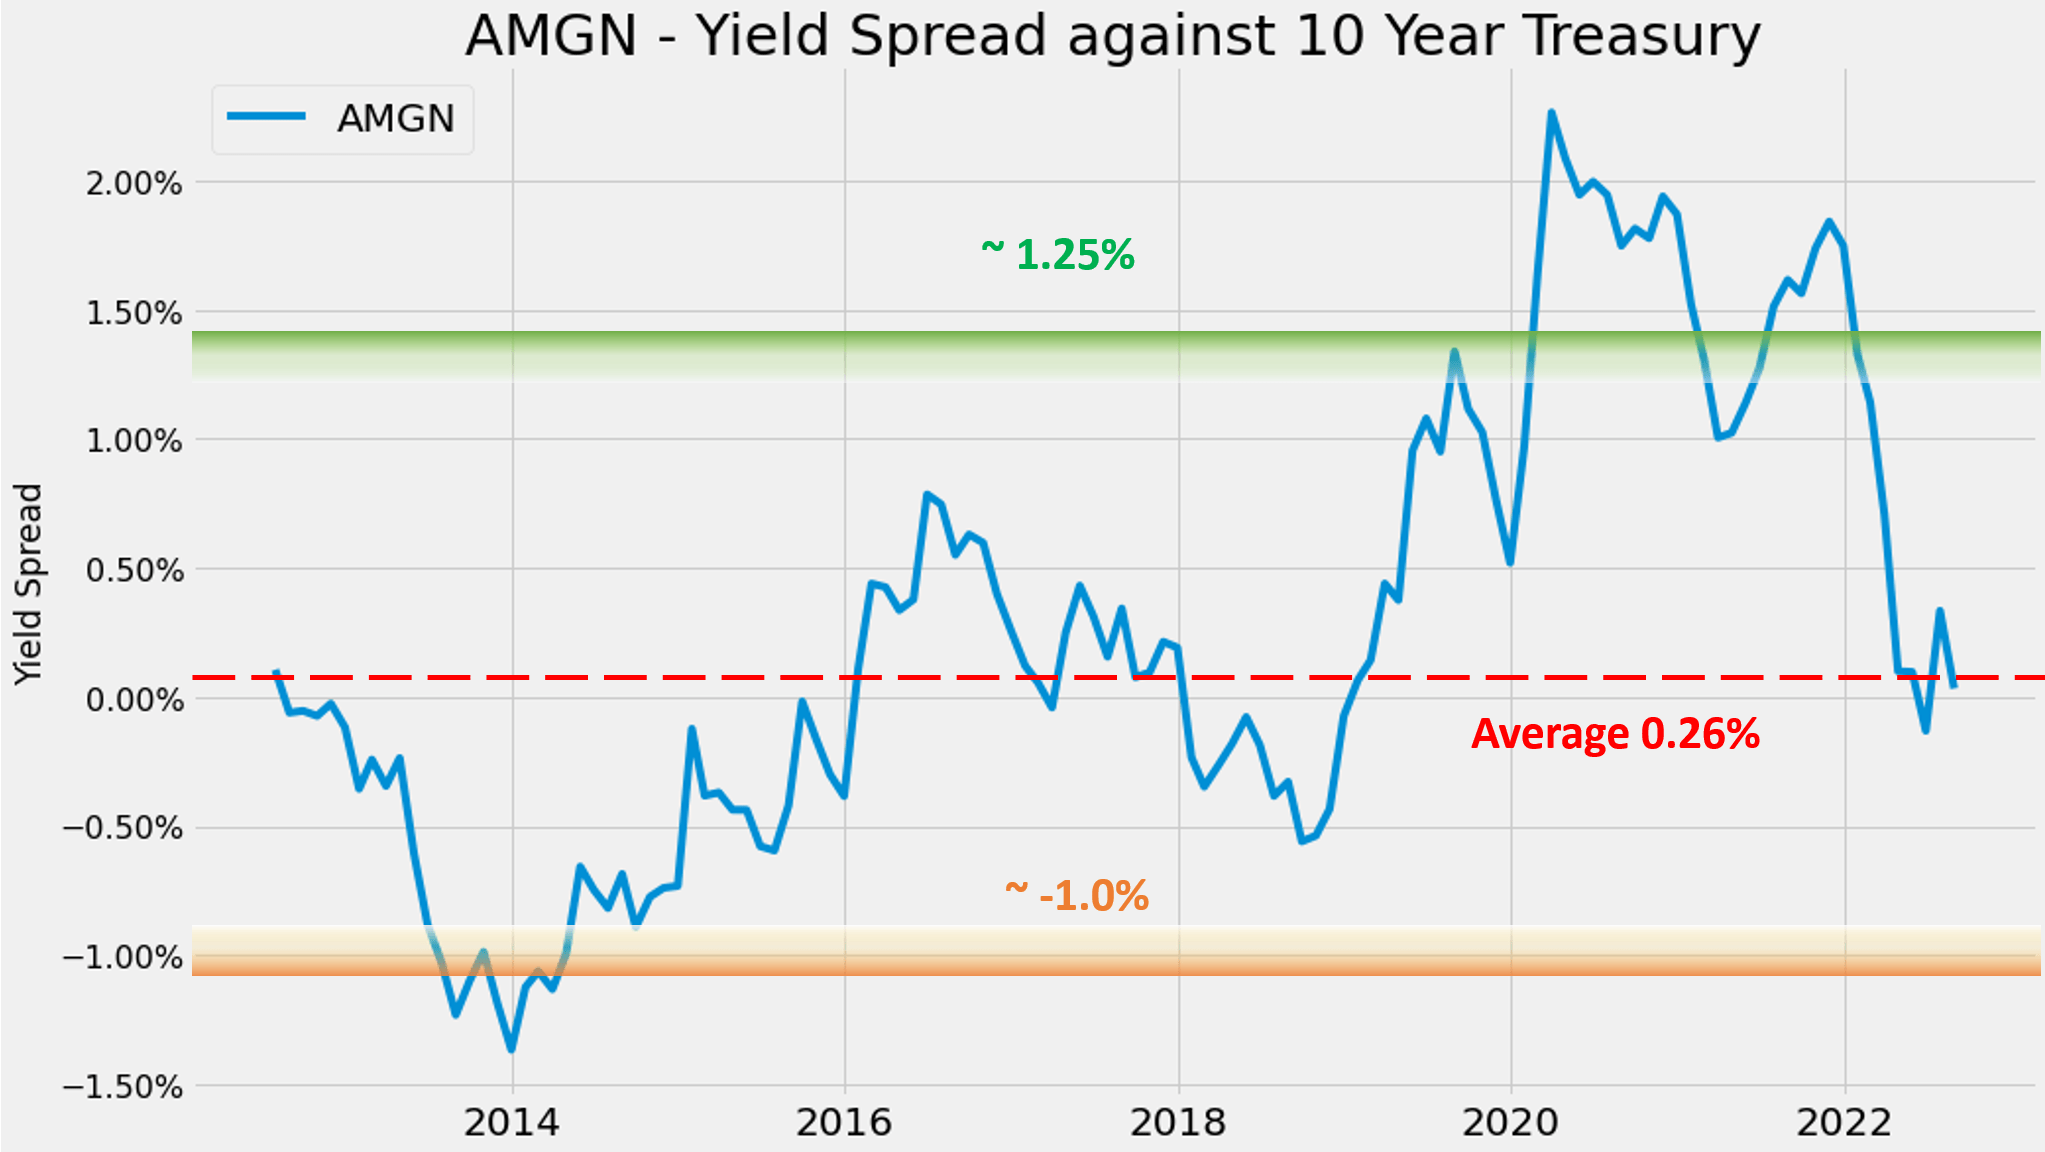

AMGN’s superior profitability
The following chart shows AMGN’s profitability in terms of ROCE (return on capital employed). The ROCE here is shown based on its quarterly TTM financials. In these calculations, I’ve included the following items as capital actually employed for AMGN 1) Working capital, including payables and receivables, 2) Net Property Plant and Equipment, and 3) research and development expenses are also capitalized to suit the nature of the drug business.
As can be seen, the ROCE of AMGN is on average about 60% over the past decade. And admittedly, its current ROCE of 53% is lower than the long-term average. But it is still far higher than the sector’s average of 24.2% (approximated by the sector’s average ROE). Furthermore, in terms of net profit margin, AMGN’s margin is currently about 24.7%, almost 3x higher than the sector average of about 8.8%.
Author based on Seeking Alpha data.
VHT and AMGN- past performance and future outlook
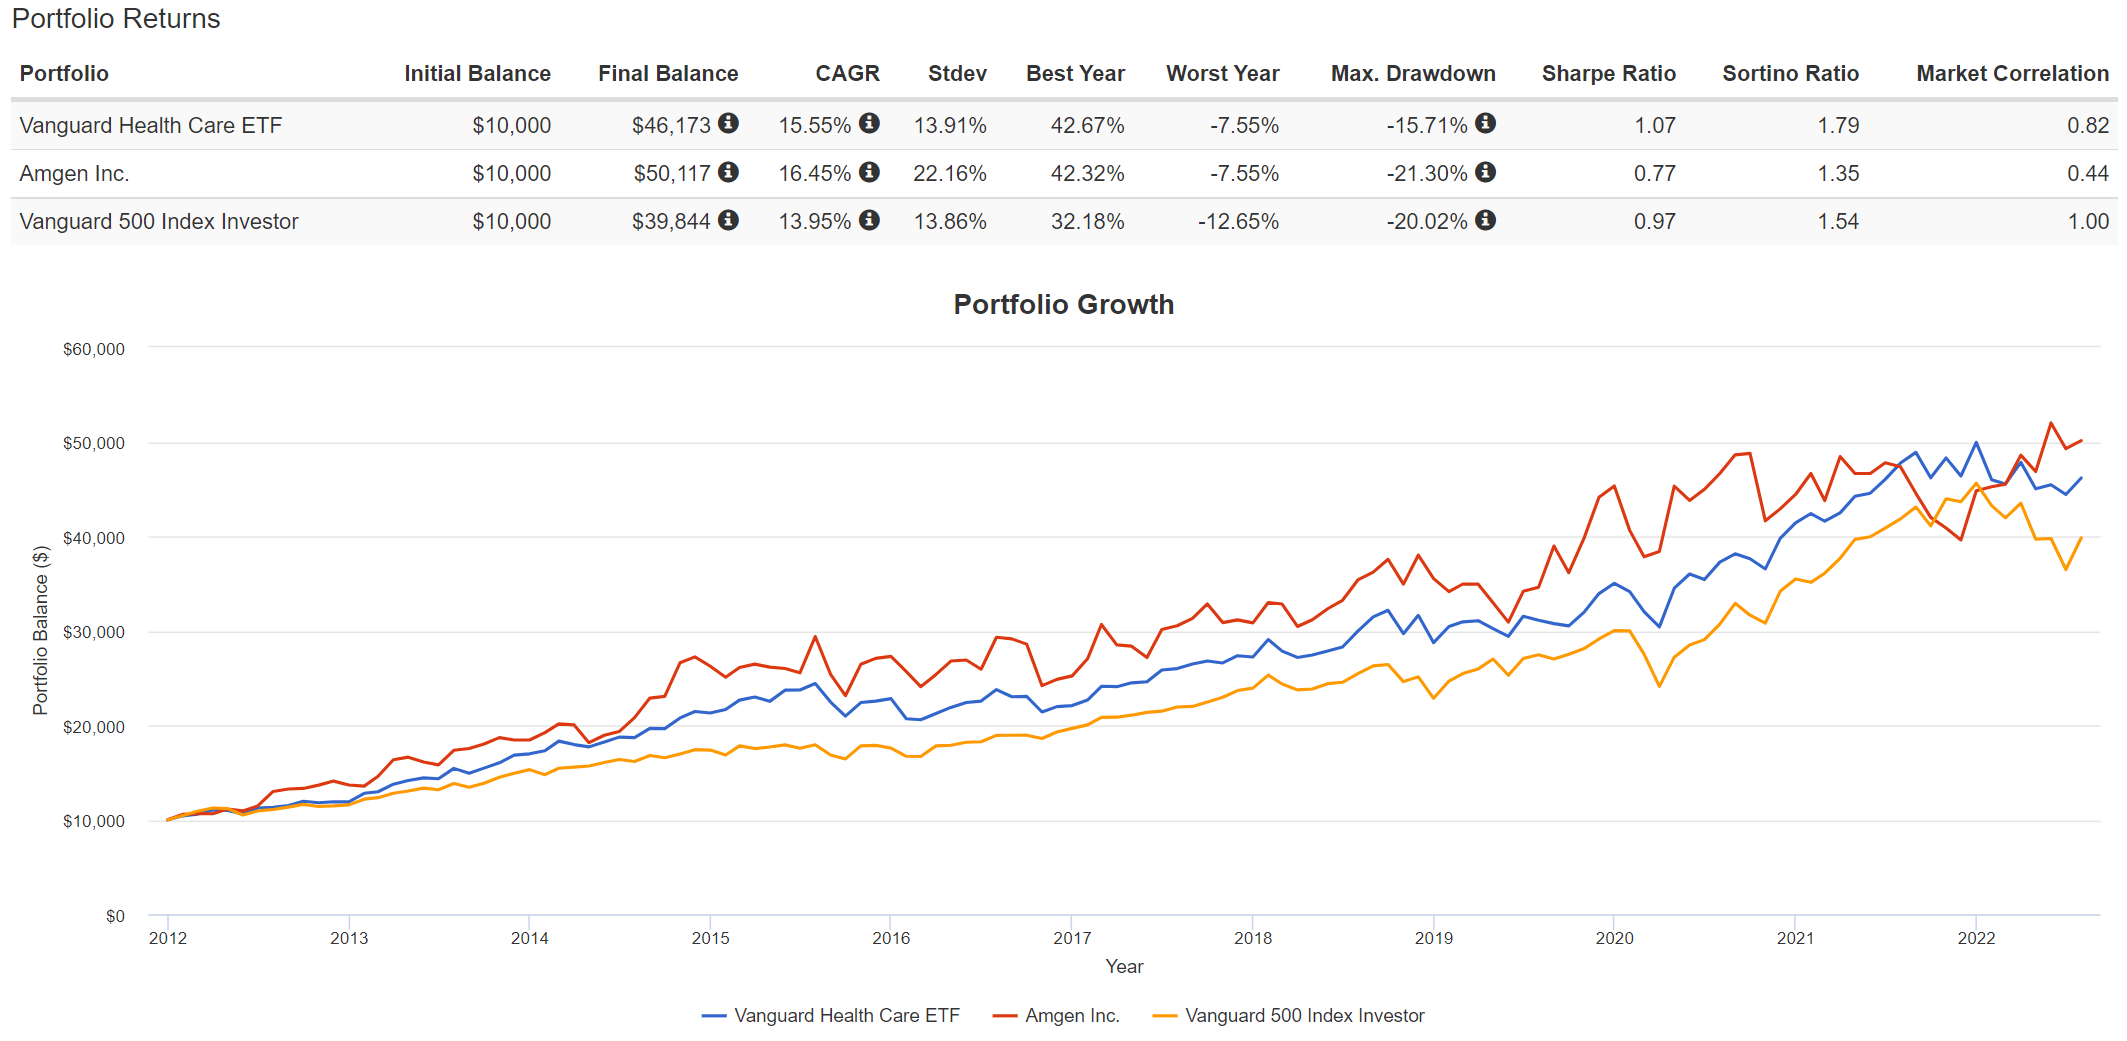
AMGN is the 11th largest holding in VHT as you can see from the chart below, representing about 2.38% of its total asset. And AMGN has outperformed VHT (and the overall market too) in the past 10 years. To wit, since 2012, AMGN has delivered a CAGR of 16.4% (with dividend reinvested), outperforming VHT’s 15.5% by about 0.9% per year and the overall market’s 14.0% by about 2.4% a year.
Although note that AMGN suffered a lower worst year loss than the overall market (-7.5% vs -12.6%), and its worst year loss is quite close to the whole sector (also -7.5%). Furthermore, AMGN’s worst drawdown in the past 10 years is also similar to the overall market (-21% vs -20%).
To me, these are clear demonstrations of AMGN’s resilience and wide moat. The addition of tens of hundreds of extra stocks in VHT and the S&P 500 index not only failed to boost performance, it did not even help to reduce price volatility compared to AMGN.
And looking forward, given the superior profitability and more attractive valuation analyzed above, I am optimistic that AMGN will keep outperforming the sector in the future.
YCharts Portfolio Visualizer
Summary and risks
To reiterate, I do not take a bearish view of the healthcare sector because of the recent passing of the Inflation Reduction Act. Quite the opposite, I view the sector (represented by VHT, XLV, or IYH) as quite attractive, and lead stocks such as AMGN even more so.
Admittedly, the IRA will create some headwinds. But it will take time and a good portion of the anticipated impacts have been priced in already. VHT is the 5th most attractively valued sector. Its yield spread admittedly is close to the thinnest level in a decade, but it has never lost money in any 2-year period, demonstrating the resilience of the healthcare sector. AMGN’s yield spread, in contrast, is close to the historical mean, signaling a much milder risk premium relative to risk-free rates. The spread relative to VHT is near a peak level in a decade, signaling AMGN’s very low risk premium relative to the sector. Besides lower valuation risk, AMGN also provides far superior profitability.
Finally, risks. Choosing one stock over a sector fund could reduce the diworsification risk, but it could increase concentration risks. As seen from the chart above, holding AMGN alone has increased the overall price volatility as measured by the standard deviation (22% compared to about 14% from both VHT and the S&P 500). Choosing one drug stock also increases the risk of the failure of one (or a few) blockbuster drugs and also the pipeline. AMGN’s recent results have been helped by a few key drugs such as Prolia (osteoporosis), Aimovig (migraines), and Repatha (cholesterol) and it has been suffering declining demand for its more mature products. These current drivers will one day become mature and face softening demand too, and there is no guarantee that ongoing research efforts and clinical trials can lead to successful replacement.
Be the first to comment