

Khanchit Khirisutchalual
Beyond any doubt, there is some confusion in the financial media about the state of inflation. Some narratives claim inflation has peaked. They are confusing inflation and its rate of change. It’s the rate of inflation that has peaked, hopefully. Consumers are paying much higher prices than they did two years ago. This is shown in the chart below.
Monthly CPI Chart, MoM and YoY Changes (Price Action Lab Blog – Norgate Data)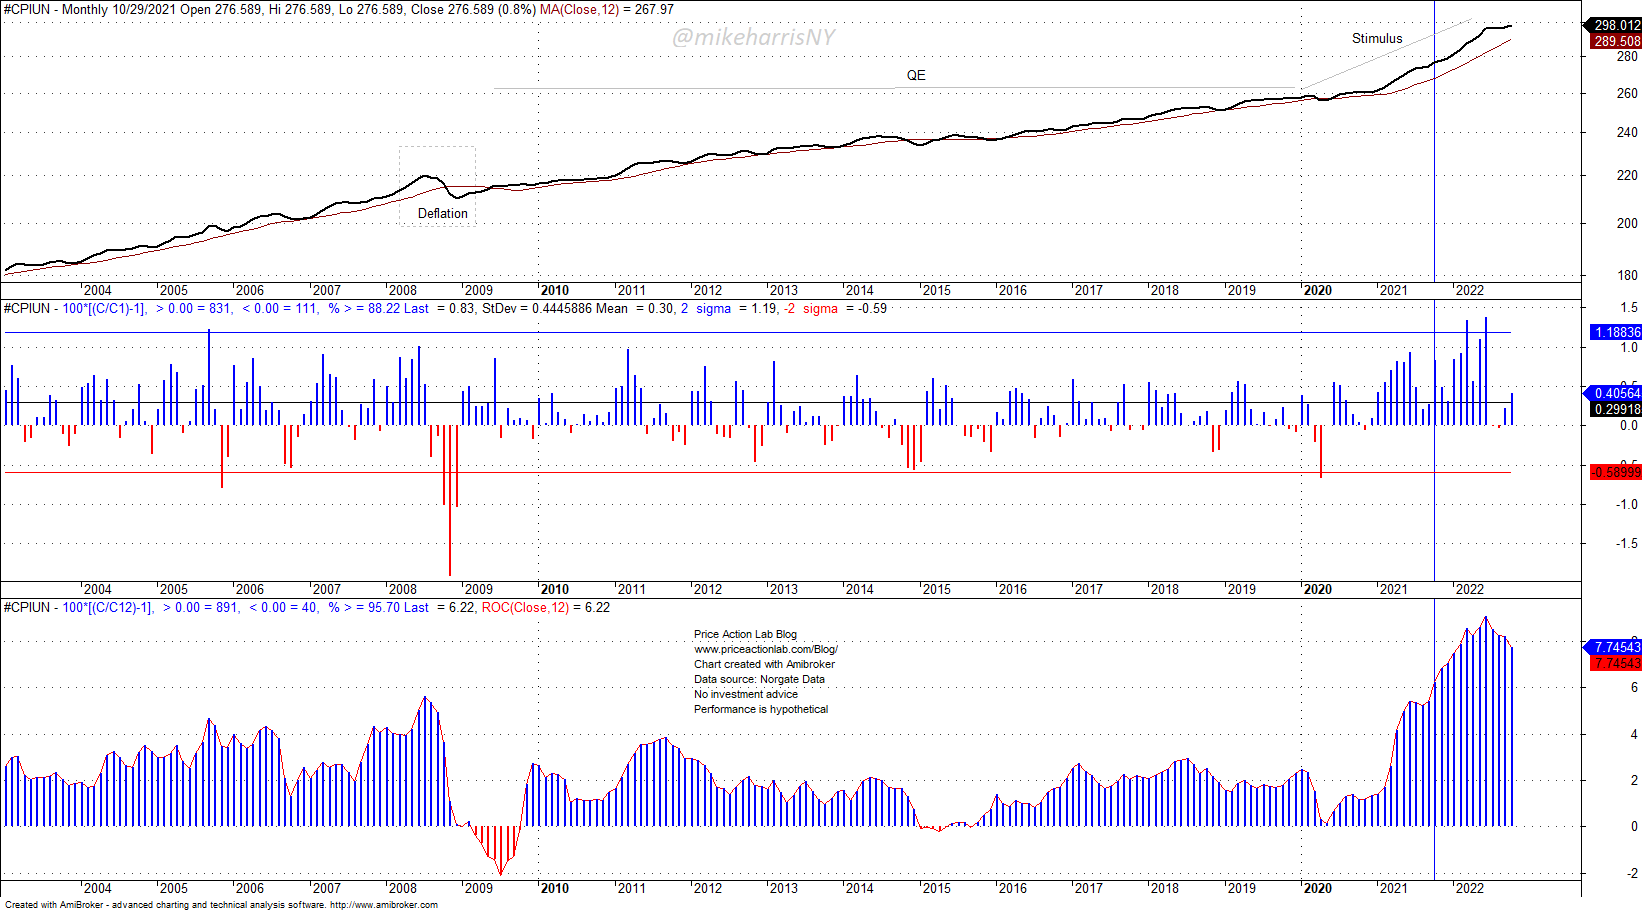
The top chart shows the CPI level (unadjusted). Since June of this year, the CPI level has remained virtually constant. This means that prices have not fallen at the index level. The only way for prices to fall is during a deflationary period, as in 2008. The Fed did everything in its power to avoid deflation and, at the same time, anchor inflation expectations at a low level. The uptrend in the CPI was smooth, and consumers did not “feel” the pressure from rising prices.
Then, the stimulus came due to the pandemic, and inflation started taking off in early 2021. Geopolitical conflicts fueled the inflationary trend, with consumer prices, rents, energy, and food costs skyrocketing.
Yesterday, we heard that “inflation has peaked.” As the chart above shows, nothing could be further from the truth. Not inflation, but the rate of change of inflation in the previous 12 months, peaked. In simple math, this is what happened:
The YoY CPI calculation removed a 0.83% rise in CPI for October 2021 (vertical blue marker on the chart) and added a 0.4% rise for October 2022.
The new YoY CPI was calculated as follows
(1+8.22/100)(1+0.4/100)/(1+0.83/100) = 1.077 or 7.7%.
Still, the process is multiplicative, just like equity market returns. The rate of change dropped by 0.2%, but the actual CPI level is at a new, all-time high level.
A deflation is required for the prices to fall, not even a recession, as we argued in another SA article. Inflation has risen too high and too fast for productivity increases to make up for the lost purchasing power of consumers. Prices must fall, and this is the inevitable path of deflation. This path can be engineered or enforced by reality, as in 2008 with bank failures. If the Fed fails to engineer a deflation, then market forces will take over to do the job for them, as in 2008.
As a result of misconceptions, hype, and also expectations of an overdue relief rally, as we pointed out in another SA article, the S&P 500 (SPX) surged 5.5% yesterday. This was the third attempt at recovery, as shown in the chart below.
Daily S&P 500 Chart with Drawdown Profile (Price Action Lab Blog – Norgate Data)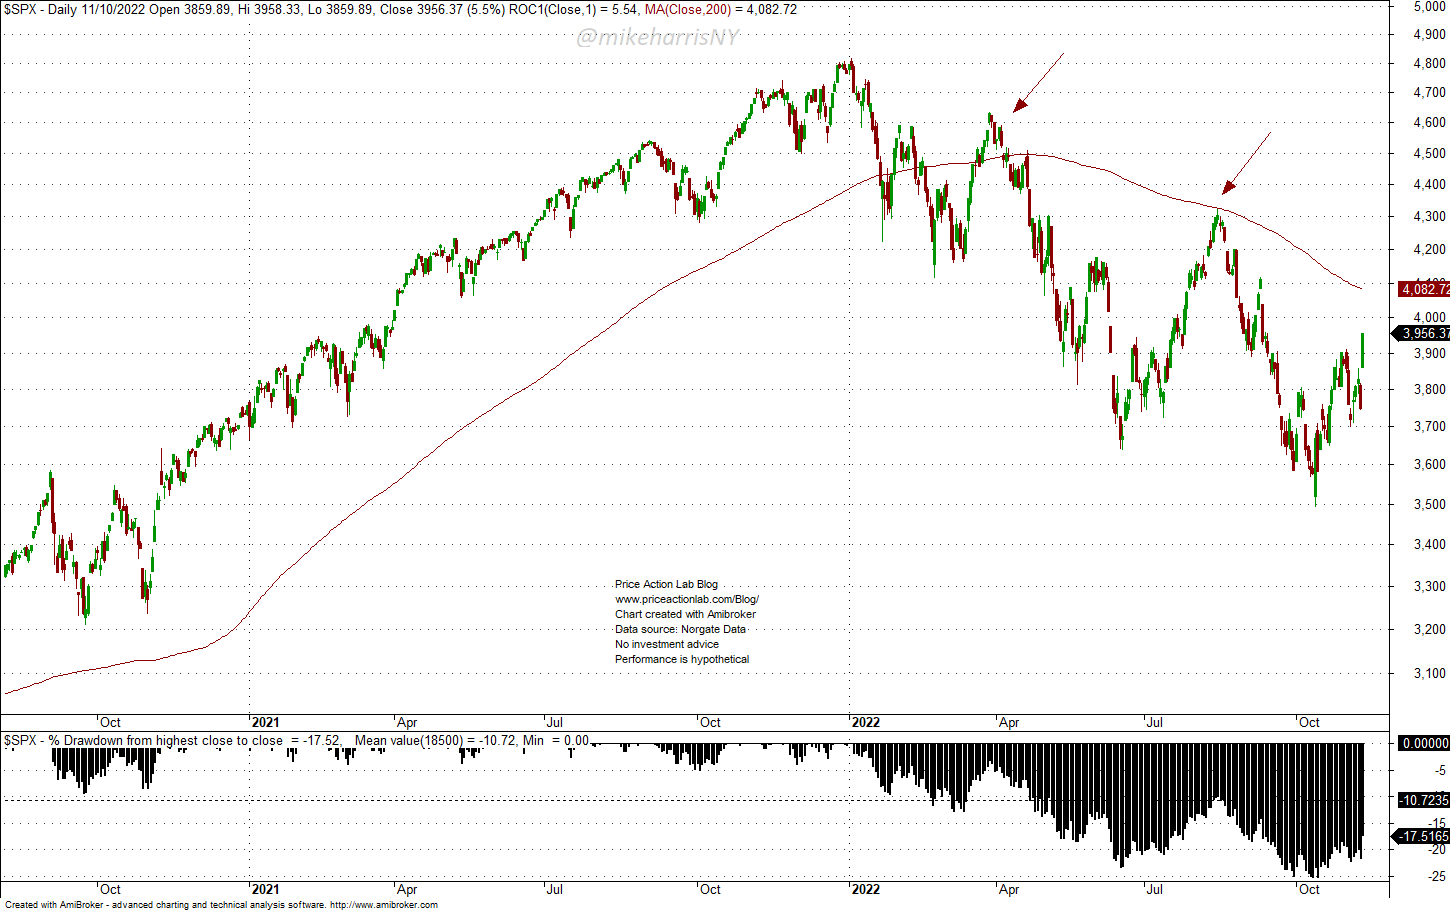
The drawdown from all-time highs was reduced from 21.9% to 17.5% as a result of the relief rally yesterday.
The question is: Is this a final bottom, or a bear market rally?
Below is a chart that shows all daily returns larger than 5.5% in the S&P 500 since 1943.
S&P 500 Chart with Daily Returns Larger than 5.5% (Price Action Lab Blog – Norgate Data)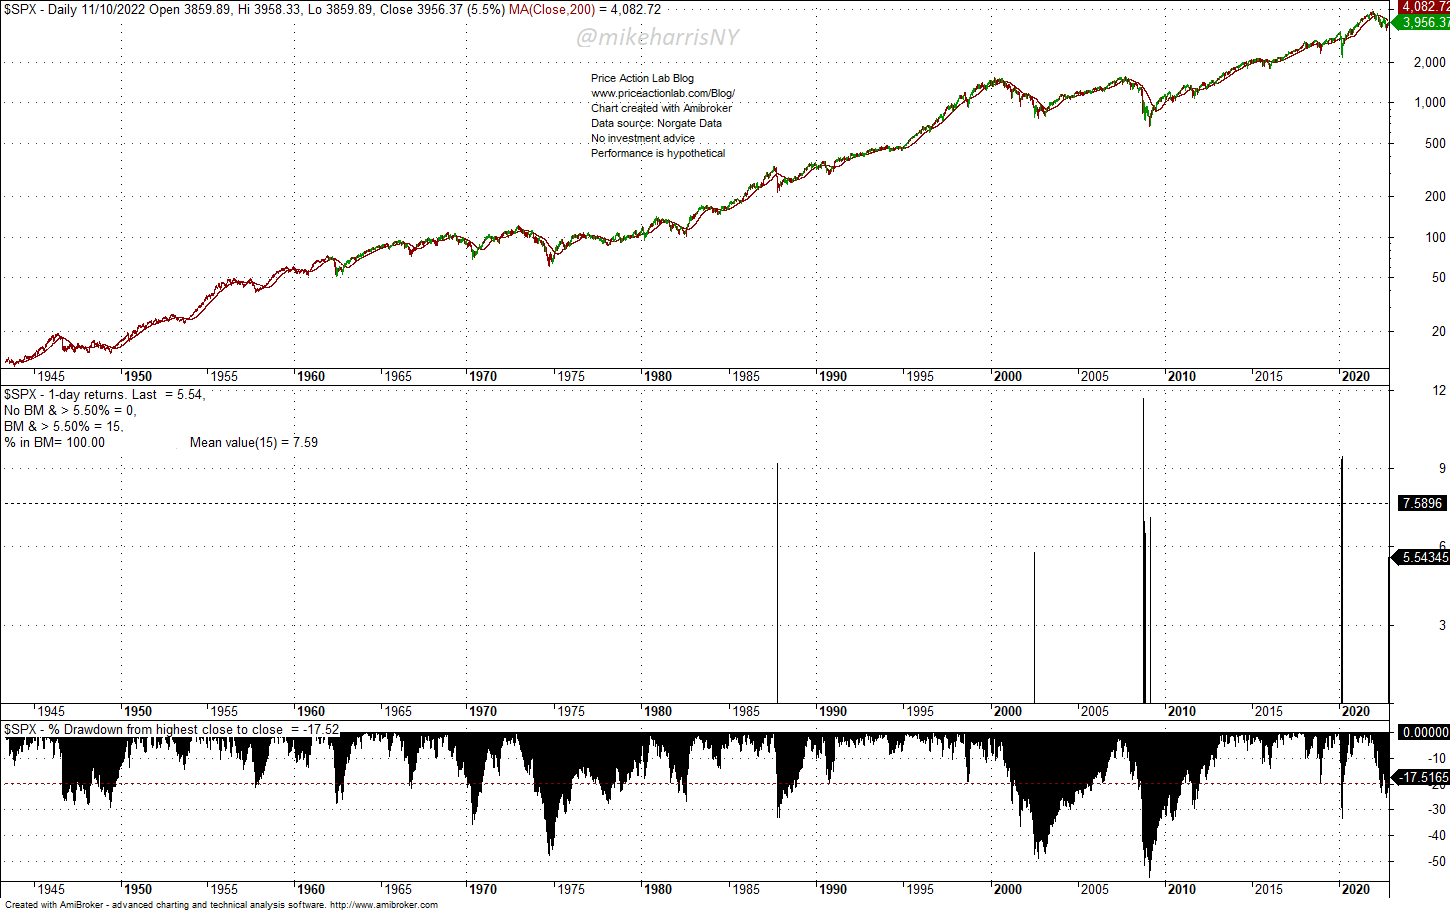
There have been 15 returns larger than 5.5% since 1943 in the S&P 500. The average of those returns is 7.6%. Some of those large returns came during bear market rallies, while others came near the bottom of a bear market. The table below shows the date, the returns, and the forward 10, 30, and 60-day returns.
S&P 500 Returns Larger Than 5.5% and Forward Returns (Price Action Lab Blog – Norgate Data)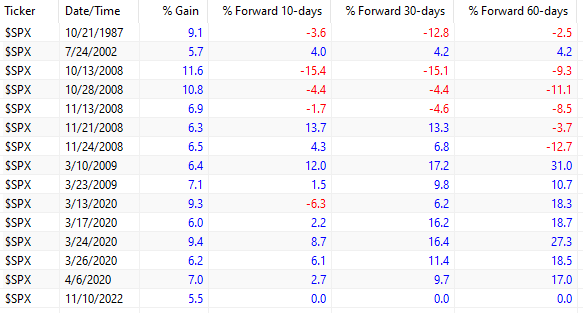
The worst period was in 2008: all returns greater than 5.5% were bear market rallies. The two instances in 2009 occurred after the bottom in March of that year. In 2020, the stimulus plan caused a V-bottom, and the first two strong rebounds that occurred during March, although they were bear market rallies, show positive forward returns.
The sample of these large rebounds in the S&P 500 index is too small for statistical analysis. These large returns come from the right tail of a power law distribution, and both the average and standard deviation are unknown, and may not even exist. We can only try to answer the question above with heuristics and based on experience, or in essence, guesses.
After all, knowing the answer to the above question is equivalent to owning a money printer. The market is unpredictable. But we could say with high (subjective) probability (subject to updating) that given the current state of high inflation, a coming winter, geopolitical uncertainty, and also political uncertainty, it is more likely that yesterday’s move was a bear market rally.
Conclusion
Inflation remains high, although its rate of change (momentum) has decreased. It is not possible to determine from the small sample of past large market rebounds whether yesterday’s rally was relief or a signal of a bottom. We could say, based on experience and a heuristics approach, that this rally was most likely a relief rally in a bear market, but we must be careful to update our subjective probabilities as new data comes in.
Be the first to comment