

Jonathan Kitchen
Let me begin by asking what should be an easy question: What is the forward multiple of REITs?
Unfortunately, there is no agreed upon answer. There can’t be an answer because there has never been an agreed upon methodology for calculating it.
If you ask the same question about the S&P 500, the answer can be found within a few seconds with a simple Google search.
For quite some time the index committee for the S&P and Dow indices has agreed upon a standardized methodology for the earnings multiple of the S&P index: It is the market cap weighted harmonic average of earnings multiples for the constituents of the index.
What does this mean?
Well, you sum all the earnings and divide that sum by the aggregate market cap of the companies in the index. That gets you the earnings yield and the inverse of that is the earnings multiple. So, the S&P has an earnings yield of 5.05%.
multpl.com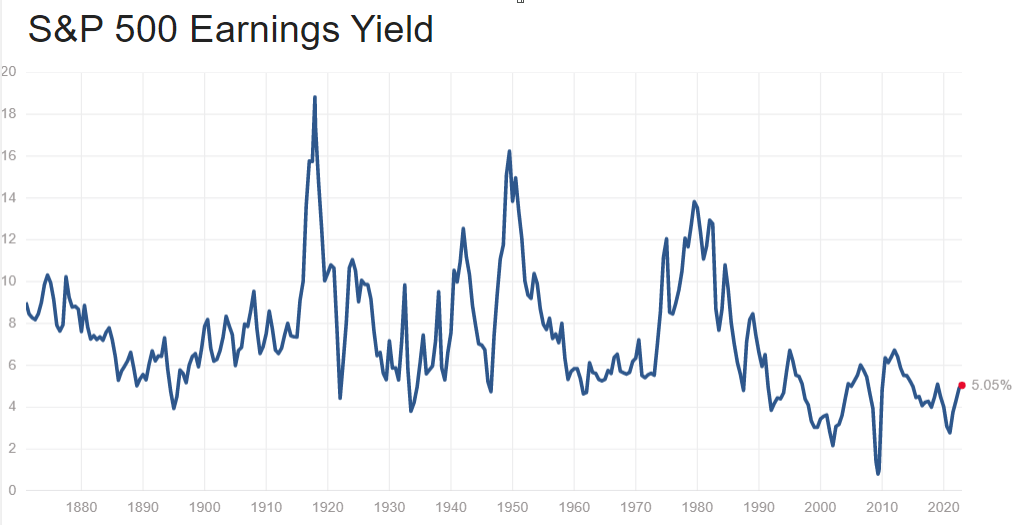
The inverse of that is 19.8 (100/5.05 = 19.8) which would be the earnings multiple.
multpl.com
It can be difficult to discern whether REITs are a good deal relative to the S&P as there is no agreed upon multiple at which REITs trade.
Making matters even more challenging is the fact that REITs have their own jargon, their own earnings metrics and their own index.
As such there is no clear way to discern whether REITs or the broader market is a better value.
I propose the following solution:
Standardize the REIT index using the same methodology for calculating earnings multiples. Here is the information we need:
- Market cap of each REIT
- Price per share of each REIT
- 2023 FFO numbers for each REIT (consensus estimates)
There are 144 REITs that have consensus FFO estimates for 2023. Each can be found in the table below.
|
COMPANY_NAME |
TICKER |
Price |
Market Cap $ in millions |
2023 FFO contribution ($ in millions) |
P/FFO |
|
Acadia Realty Trust |
(AKR) |
$13.97 |
$1,326.55 |
$118.70 |
11.176 |
|
Agree Realty Corporation |
(ADC) |
$70.30 |
$6,226.70 |
$355.18 |
17.53117207 |
|
Alexander & Baldwin, Inc. |
(ALEX) |
$19.05 |
$1,381.12 |
$78.30 |
17.63888889 |
|
Alexander’s, Inc. |
(ALX) |
$224.87 |
$1,148.48 |
$72.98 |
15.73617915 |
|
Alexandria Real Estate Equities, Inc. |
(ARE) |
$144.11 |
$23,646.62 |
$1,468.58 |
16.10167598 |
|
Alpine Income Property Trust, Inc. |
(PINE) |
$18.83 |
$224.37 |
$19.42 |
11.55214724 |
|
American Assets Trust, Inc. |
(AAT) |
$26.30 |
$1,591.89 |
$142.85 |
11.1440678 |
|
American Homes 4 Rent |
(AMH) |
$30.31 |
$10,712.91 |
$593.79 |
18.04166667 |
|
American Tower Corporation |
(AMT) |
$209.62 |
$97,600.24 |
$5,093.73 |
19.16087751 |
|
Americold Realty Trust, Inc. |
(COLD) |
$28.13 |
$7,599.75 |
$264.76 |
28.70408163 |
|
Apartment Income REIT Corp. |
(AIRC) |
$34.60 |
$5,187.52 |
$368.82 |
14.06504065 |
|
Apple Hospitality REIT, Inc. |
(APLE) |
$16.11 |
$3,685.20 |
$391.17 |
9.421052632 |
|
Armada Hoffler Properties, Inc. |
(AHH) |
$11.67 |
$1,030.94 |
$104.24 |
9.889830508 |
|
Ashford Hospitality Trust, Inc. |
(AHT) |
$5.15 |
$177.67 |
$35.88 |
4.951923077 |
|
AvalonBay Communities, Inc. |
(AVB) |
$162.22 |
$22,694.14 |
$1,477.32 |
15.36174242 |
|
Boston Properties, Inc. |
(BXP) |
$66.52 |
$10,427.32 |
$1,133.34 |
9.20055325 |
|
Braemar Hotels & Resorts Inc. |
(BHR) |
$3.96 |
$282.97 |
$67.17 |
4.212765957 |
|
Brandywine Realty Trust |
(BDN) |
$6.18 |
$1,060.30 |
$212.75 |
4.983870968 |
|
Brixmor Property Group Inc. |
(BRX) |
$21.95 |
$6,583.09 |
$605.82 |
10.86633663 |
|
Broadstone Net Lease, Inc. |
(BNL) |
$16.48 |
$2,852.93 |
$264.87 |
10.77124183 |
|
Camden Property Trust |
(CPT) |
$110.39 |
$11,759.63 |
$763.81 |
15.39609484 |
|
CareTrust REIT, Inc. |
(CTRE) |
$19.12 |
$1,855.19 |
$147.48 |
12.57894737 |
|
Centerspace |
(CSR) |
$60.16 |
$906.55 |
$69.17 |
13.10675381 |
|
Chatham Lodging Trust |
(CLDT) |
$12.96 |
$632.55 |
$66.87 |
9.459854015 |
|
City Office REIT, Inc. |
(CIO) |
$8.81 |
$349.92 |
$57.59 |
6.075862069 |
|
Clipper Realty Inc. |
(CLPR) |
$6.63 |
$106.50 |
$7.23 |
14.73333333 |
|
Community Healthcare Trust Incorporated |
(CHCT) |
$34.67 |
$877.12 |
$62.24 |
14.09349593 |
|
Corporate Office Properties Trust |
(OFC) |
$25.41 |
$2,856.67 |
$272.06 |
10.5 |
|
Cousins Properties Incorporated |
(CUZ) |
$24.76 |
$3,749.51 |
$401.30 |
9.343396226 |
|
Creative Media & Community Trust Corporation |
(CMCT) |
$5.25 |
$119.55 |
$9.79 |
12.20930233 |
|
Crown Castle Inc. |
(CCI) |
$133.21 |
$57,686.33 |
$3,347.46 |
17.23285899 |
|
CTO Realty Growth, Inc. |
(CTO) |
$18.29 |
$409.53 |
$40.30 |
10.16111111 |
|
CubeSmart |
(CUBE) |
$39.66 |
$8,906.63 |
$606.35 |
14.68888889 |
|
DiamondRock Hospitality Company |
(DRH) |
$8.51 |
$1,781.78 |
$217.75 |
8.182692308 |
|
Digital Realty Trust, Inc. |
(DLR) |
$99.39 |
$28,576.83 |
$1,989.65 |
14.36271676 |
|
Douglas Emmett, Inc. |
(DEI) |
$15.53 |
$2,730.00 |
$353.34 |
7.726368159 |
|
Easterly Government Properties, Inc. |
(DEA) |
$13.98 |
$1,269.58 |
$107.16 |
11.84745763 |
|
EastGroup Properties, Inc. |
(EGP) |
$146.58 |
$6,387.08 |
$322.45 |
19.80810811 |
|
Elme Communities |
(ELME) |
$18.04 |
$1,578.82 |
$86.64 |
18.22222222 |
|
Empire State Realty Trust, Inc. |
(ESRT) |
$6.79 |
$1,096.05 |
$132.37 |
8.280487805 |
|
EPR Properties |
(EPR) |
$39.51 |
$2,964.08 |
$360.85 |
8.214137214 |
|
Equinix, Inc. |
(EQIX) |
$658.19 |
$60,907.67 |
$2,003.45 |
30.40138568 |
|
Equity Commonwealth |
(EQC) |
$25.22 |
$2,759.78 |
$58.00 |
47.58490566 |
|
Equity LifeStyle Properties, Inc. |
(ELS) |
$63.49 |
$11,816.18 |
$522.97 |
22.59430605 |
|
Equity Residential |
(EQR) |
$59.65 |
$22,542.86 |
$1,428.53 |
15.78042328 |
|
Essential Properties Realty Trust, Inc. |
(EPRT) |
$22.84 |
$3,251.90 |
$234.92 |
13.84242424 |
|
Essex Property Trust, Inc. |
(ESS) |
$208.57 |
$13,505.70 |
$990.09 |
13.64094179 |
|
Extra Space Storage Inc. |
(EXR) |
$146.71 |
$19,647.62 |
$1,181.19 |
16.63378685 |
|
Farmland Partners Inc. |
(FPI) |
$11.83 |
$645.73 |
$18.01 |
35.84848485 |
|
Federal Realty Investment Trust |
(FRT) |
$101.35 |
$8,230.58 |
$518.12 |
15.88557994 |
|
First Industrial Realty Trust, Inc. |
(FR) |
$48.17 |
$6,364.95 |
$313.16 |
20.32489451 |
|
Four Corners Property Trust, Inc. |
(FCPT) |
$26.02 |
$2,182.75 |
$139.25 |
15.6746988 |
|
Franklin Street Properties Corp. |
(FSP) |
$2.76 |
$284.93 |
$28.91 |
9.857142857 |
|
Gaming and Leisure Properties, Inc. |
(GLPI) |
$51.72 |
$13,318.78 |
$932.21 |
14.28729282 |
|
Generation Income Properties, Inc. |
(GIPR) |
$5.08 |
$12.68 |
$0.80 |
15.875 |
|
Getty Realty Corp. |
(GTY) |
$34.49 |
$1,611.86 |
$96.74 |
16.66183575 |
|
Gladstone Commercial Corporation |
(GOOD) |
$18.54 |
$784.51 |
$66.86 |
11.73417722 |
|
Gladstone Land Corporation |
(LAND) |
$18.44 |
$639.94 |
$27.42 |
23.34177215 |
|
Global Medical REIT Inc. |
(GMRE) |
$9.45 |
$619.15 |
$62.90 |
9.84375 |
|
Global Net Lease, Inc. |
(GNL) |
$13.06 |
$1,355.57 |
$166.07 |
8.1625 |
|
Global Self Storage, Inc. |
(SELF) |
$4.91 |
$54.47 |
$4.77 |
11.41860465 |
|
Healthcare Realty Trust Incorporated |
(HR) |
$18.48 |
$7,032.97 |
$643.17 |
10.93491124 |
|
Healthpeak Properties, Inc. |
(PEAK) |
$24.90 |
$13,384.74 |
$956.82 |
13.98876404 |
|
Hersha Hospitality Trust |
(HT) |
$9.32 |
$369.52 |
$50.75 |
7.28125 |
|
Highwoods Properties, Inc. |
(HIW) |
$27.44 |
$2,886.62 |
$408.17 |
7.072164948 |
|
Host Hotels & Resorts, Inc. |
(HST) |
$16.78 |
$11,998.16 |
$1,358.55 |
8.831578947 |
|
Hudson Pacific Properties, Inc. |
(HPP) |
$9.66 |
$1,361.32 |
$274.80 |
4.953846154 |
|
Independence Realty Trust, Inc. |
(IRT) |
$17.01 |
$3,811.50 |
$259.93 |
14.6637931 |
|
INDUS Realty Trust, Inc. |
(INDT) |
$63.78 |
$650.07 |
$21.71 |
29.94366197 |
|
Industrial Logistics Properties Trust |
(ILPT) |
$3.49 |
$228.83 |
$68.85 |
3.323809524 |
|
Innovative Industrial Properties, Inc. |
(IIPR) |
$106.36 |
$2,975.20 |
$227.70 |
13.06633907 |
|
InvenTrust Properties Corp. |
(IVT) |
$22.75 |
$1,533.98 |
$109.91 |
13.95705521 |
|
Invitation Homes Inc. |
(INVH) |
$29.75 |
$18,189.44 |
$1,106.65 |
16.43646409 |
|
Iron Mountain Incorporated |
(IRM) |
$50.21 |
$14,596.75 |
$880.86 |
16.5709571 |
|
JBG SMITH Properties |
(JBGS) |
$19.11 |
$2,174.49 |
$142.23 |
15.288 |
|
Kilroy Realty Corporation |
(KRC) |
$38.34 |
$4,481.08 |
$549.32 |
8.157446809 |
|
Kimco Realty Corporation |
(KIM) |
$20.98 |
$12,975.30 |
$995.72 |
13.0310559 |
|
Kite Realty Group Trust |
(KRG) |
$20.84 |
$4,566.02 |
$420.67 |
10.85416667 |
|
Life Storage, Inc. |
(LSI) |
$99.25 |
$8,436.01 |
$586.48 |
14.38405797 |
|
LTC Properties, Inc. |
(LTC) |
$36.96 |
$1,497.06 |
$112.20 |
13.34296029 |
|
LXP Industrial Trust |
(LXP) |
$10.14 |
$2,795.83 |
$190.25 |
14.69565217 |
|
Medalist Diversified REIT, Inc. |
(MDRR) |
$0.69 |
$12.03 |
$1.39 |
8.625 |
|
Medical Properties Trust, Inc. |
(MPW) |
$10.93 |
$6,546.88 |
$1,078.17 |
6.072222222 |
|
Mid-America Apartment Communities, Inc. |
(MAA) |
$155.31 |
$17,934.73 |
$1,060.08 |
16.91830065 |
|
National Health Investors, Inc. |
(NHI) |
$55.04 |
$2,388.12 |
$195.25 |
12.23111111 |
|
National Retail Properties, Inc. |
(NNN) |
$45.18 |
$8,075.14 |
$571.94 |
14.11875 |
|
National Storage Affiliates Trust |
(NSA) |
$35.81 |
$3,253.89 |
$267.14 |
12.18027211 |
|
NETSTREIT Corp. |
(NTST) |
$18.97 |
$1,041.00 |
$62.56 |
16.64035088 |
|
NewLake Capital Partners, Inc. |
$16.92 |
$362.15 |
$40.88 |
8.858638743 |
|
|
NexPoint Residential Trust, Inc. |
(NXRT) |
$43.39 |
$1,108.58 |
$83.80 |
13.22865854 |
|
NYC REIT |
(NYC) |
$2.00 |
$29.78 |
-$12.36 |
-2.409638554 |
|
Office Properties Income Trust |
(OPI) |
$13.53 |
$657.10 |
$220.98 |
2.973626374 |
|
Omega Healthcare Investors, Inc. |
(OHI) |
$28.01 |
$6,559.46 |
$702.55 |
9.336666667 |
|
One Liberty Properties, Inc. |
(OLP) |
$22.09 |
$465.52 |
$37.09 |
12.55113636 |
|
Orion Office REIT Inc. |
(ONL) |
$8.71 |
$493.29 |
$89.48 |
5.512658228 |
|
Paramount Group, Inc. |
(PGRE) |
$5.81 |
$1,277.18 |
$208.83 |
6.115789474 |
|
Park Hotels & Resorts Inc. |
(PK) |
$11.92 |
$2,680.13 |
$415.96 |
6.443243243 |
|
Pebblebrook Hotel Trust |
(PEB) |
$14.62 |
$1,922.13 |
$287.92 |
6.675799087 |
|
Phillips Edison & Company, Inc. |
(PECO) |
$31.59 |
$3,699.19 |
$266.99 |
13.85526316 |
|
Physicians Realty Trust |
(DOC) |
$14.57 |
$3,325.76 |
$244.24 |
13.61682243 |
|
Piedmont Office Realty Trust, Inc. |
(PDM) |
$8.83 |
$1,089.58 |
$238.15 |
4.575129534 |
|
Plymouth Industrial REIT, Inc. |
(PLYM) |
$19.49 |
$835.14 |
$79.27 |
10.53513514 |
|
Postal Realty Trust, Inc. |
(PSTL) |
$14.43 |
$274.77 |
$18.09 |
15.18947368 |
|
Power REIT |
(PW) |
$4.37 |
$14.81 |
$14.88 |
0.9954441913 |
|
Presidio Property Trust, Inc. |
(SQFT) |
$1.00 |
$12.21 |
$0.24 |
50 |
|
Prologis, Inc. |
(PLD) |
$112.07 |
$103,449.37 |
$5,160.01 |
20.04830054 |
|
Public Storage |
(PSA) |
$284.43 |
$49,956.80 |
$2,940.19 |
16.99103943 |
|
Realty Income Corporation |
(O) |
$63.54 |
$39,849.36 |
$2,577.60 |
15.45985401 |
|
Regency Centers Corporation |
(REG) |
$62.33 |
$10,666.08 |
$693.05 |
15.39012346 |
|
Retail Opportunity Investments Corp. |
(ROIC) |
$14.82 |
$1,845.70 |
$137.00 |
13.47272727 |
|
Rexford Industrial Realty, Inc. |
(REXR) |
$53.24 |
$10,381.38 |
$421.18 |
24.64814815 |
|
RLJ Lodging Trust |
(RLJ) |
$10.86 |
$1,759.91 |
$290.08 |
6.067039106 |
|
RPT Realty |
(RPT) |
$10.03 |
$855.05 |
$88.66 |
9.644230769 |
|
Ryman Hospitality Properties, Inc. |
(RHP) |
$85.30 |
$4,705.43 |
$384.49 |
12.23816356 |
|
Sabra Health Care REIT, Inc. |
(SBRA) |
$12.22 |
$2,822.53 |
$334.92 |
8.427586207 |
|
Safehold Inc. |
(SAFE) |
$29.27 |
$1,820.23 |
$106.96 |
17.01744186 |
|
Saul Centers, Inc. |
(BFS) |
$40.17 |
$959.87 |
$73.84 |
13 |
|
SBA Communications Corporation |
(SBAC) |
$277.46 |
$29,956.11 |
$1,278.31 |
23.43412162 |
|
Service Properties Trust |
(SVC) |
$7.25 |
$1,199.54 |
$279.62 |
4.289940828 |
|
Simon Property Group, Inc. |
(SPG) |
$115.62 |
$39,647.65 |
$4,159.54 |
9.531739489 |
|
SITE Centers Corp. |
(SITC) |
$13.04 |
$2,771.16 |
$246.51 |
11.24137931 |
|
SL Green Realty Corp. |
(SLG) |
$33.15 |
$2,132.08 |
$367.89 |
5.795454545 |
|
Spirit Realty Capital, Inc. |
(SRC) |
$40.44 |
$5,647.86 |
$520.93 |
10.84182306 |
|
STAG Industrial, Inc. |
(STAG) |
$32.35 |
$5,797.65 |
$403.24 |
14.37777778 |
|
STORE Capital Corporation |
(STOR) |
$31.96 |
$9,034.64 |
$644.52 |
14.01754386 |
|
Summit Hotel Properties, Inc. |
(INN) |
$7.48 |
$799.58 |
$120.79 |
6.619469027 |
|
Sun Communities, Inc. |
(SUI) |
$140.47 |
$17,402.86 |
$939.09 |
18.53166227 |
|
Sunstone Hotel Investors, Inc. |
(SHO) |
$9.87 |
$2,076.64 |
$187.26 |
11.08988764 |
|
Tanger Factory Outlet Centers, Inc. |
(SKT) |
$18.12 |
$1,890.77 |
$190.95 |
9.901639344 |
|
Terreno Realty Corporation |
(TRNO) |
$55.40 |
$4,214.10 |
$163.54 |
25.76744186 |
|
The Macerich Company |
(MAC) |
$11.63 |
$2,497.95 |
$397.35 |
6.286486486 |
|
The Necessity Retail REIT, Inc. |
(RTL) |
$5.94 |
$821.45 |
$139.67 |
5.881188119 |
|
UDR, Inc. |
(UDR) |
$38.45 |
$12,517.07 |
$820.36 |
15.25793651 |
|
UMH Properties, Inc. |
(UMH) |
$16.10 |
$897.34 |
$55.18 |
16.26262626 |
|
Uniti Group Inc. |
(UNIT) |
$5.49 |
$1,302.23 |
$384.26 |
3.388888889 |
|
Urban Edge Properties |
(UE) |
$14.15 |
$1,661.75 |
$135.05 |
12.30434783 |
|
Urstadt Biddle Properties Inc. |
(UBA) |
$18.64 |
$749.44 |
$62.32 |
12.02580645 |
|
Ventas, Inc. |
(VTR) |
$44.55 |
$17,807.44 |
$1,231.13 |
14.46428571 |
|
Veris Residential, Inc. |
(VRE) |
$16.20 |
$1,476.46 |
$51.04 |
28.92857143 |
|
VICI Properties Inc. |
(VICI) |
$33.08 |
$32,993.08 |
$2,363.77 |
13.95780591 |
|
Vornado Realty Trust |
(VNO) |
$21.31 |
$4,086.73 |
$535.05 |
7.637992832 |
|
W. P. Carey Inc. |
(WPC) |
$80.02 |
$16,646.78 |
$1,075.53 |
15.47775629 |
|
Welltower Inc. |
(WELL) |
$63.70 |
$30,099.61 |
$1,729.43 |
17.40437158 |
|
Whitestone REIT |
(WSR) |
$9.57 |
$472.62 |
$50.37 |
9.382352941 |
|
Xenia Hotels & Resorts, Inc. |
(XHR) |
$13.68 |
$1,557.44 |
$177.60 |
8.769230769 |
|
$1,169,811.42 |
$78,542.44 |
14.89400351 |
From this information we can find 4 different FFO multiples for the REIT index depending on calculation methodology. In particular I think it is valuable to look at both cap weighted and equal weighted as well as straight averages versus harmonic averages.
A REIT ETF like the Vanguard Real Estate ETF (VNQ) is market cap weighted so it would have an average multiple of 16.7X. In contrast, an equal weighted REIT portfolio would have an average multiple of 13.29X.
However, if you use either of these multiples you are substantially underrepresenting the value REITs present relative to the S&P.
Since the S&P uses a harmonic average in calculating its PE multiple, we should do the same for REITs. This gets a harmonic multiple of 14.89x when market cap weighted or 10.3X when equal weighted.
The results of our analysis are summarized in the table below.
2MC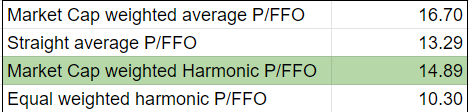
The market cap weighted harmonic average P/FFO is highlighted in green because that is the methodology most comparable to the S&P.
It is this 14.89X REIT multiple that we can compare to the 19X of the S&P. Consensus estimates range from roughly 200 to 230 for 2023 S&P earnings so at current pricing you get the following multiples.
2MC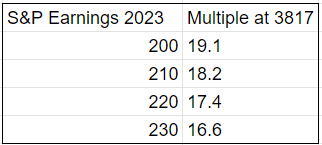
FFO Versus Earnings
In comparing REITs to the S&P one must also understand the difference between Funds From Operations (FFO) and earnings.
FFO is defined by the National Association of Real Estate Investment Trusts (NAREIT). It is a standardized set of adjustments from GAAP net income that are designed to make FFO closer to runrate earnings. Below are the main adjustments
NAREIT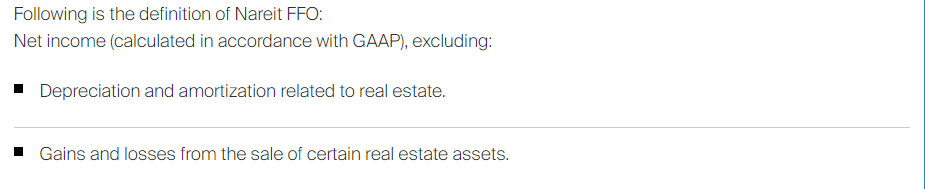
The challenge with real estate in GAAP accounting is that the earnings profile is extremely lumpy which contrasts with the experience of the owner in which the cashflow stream is quite steady.
Consider a building with 30 years of contractual rent. The cashflow is straight line, but over those 30 years GAAP depreciates the building to $0 so GAAP earnings will be exceedingly low. However, once that building is sold it will be sold against the $0 cost basis causing an enormous GAAP gain.
This makes earnings hard to track because in no period do they reflect the actual cashflows and actual profits. To clean up the reporting, REITs add back that depreciation and do not record the gain on sale for FFO.
FFO is not intended to be higher or lower than GAAP earnings. It is just smoother and more in line with cashflows. Whether FFO is higher or lower than GAAP will be case specific depending on whether the magnitude of gain on sale is greater than or less than depreciation.
As a quick example we can look at City Office REIT (CIO) which sold a large portion of its property portfolio. Looking at GAAP income, depreciation eats up most of it but in 4Q21 they gained $433 million, most of which came from gain on sale of property.
S&P Global Market Intelligence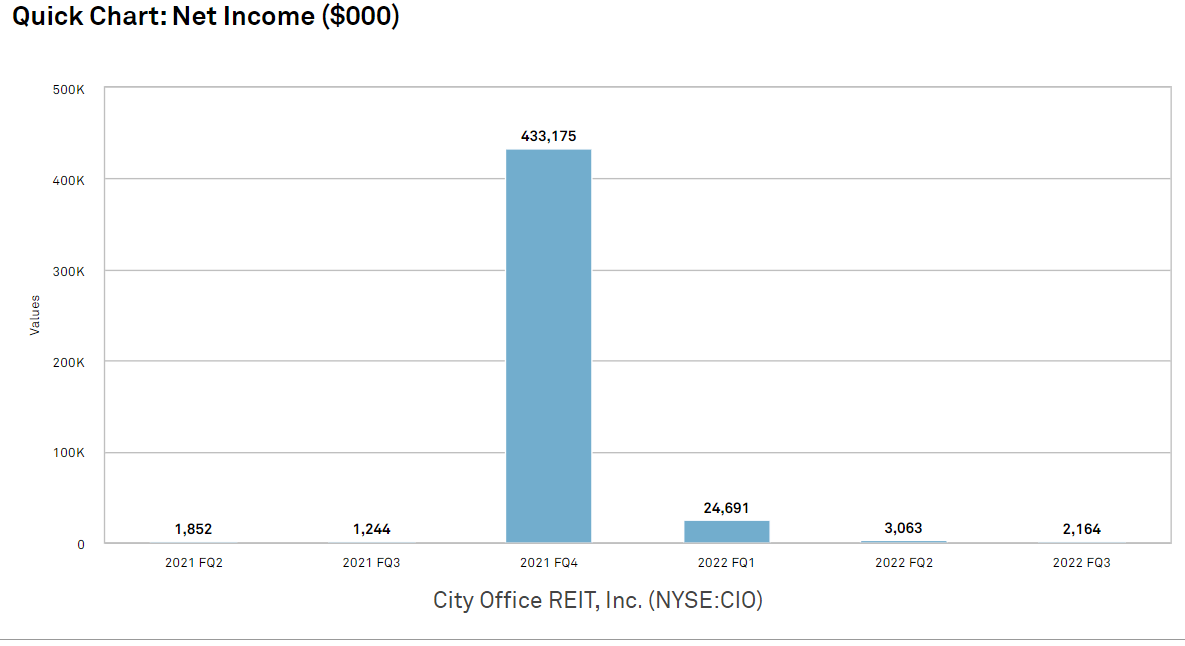
FFO was much smoother at about $13 million to $15 million per quarter.
S&P Global Market Intelligence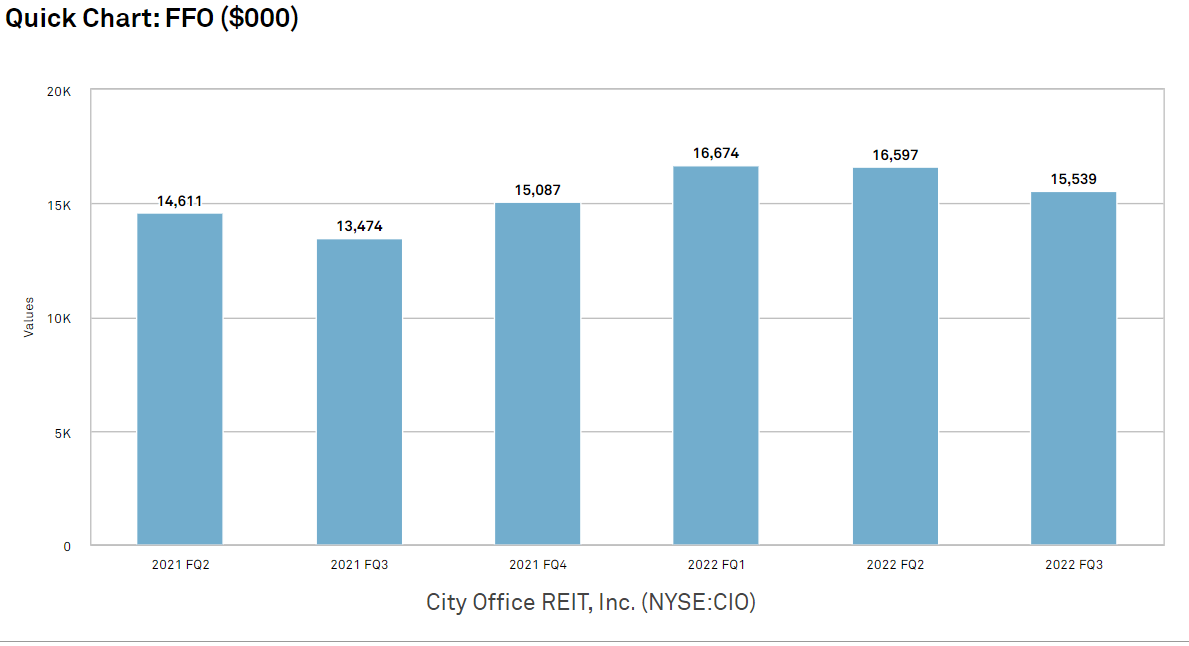
So is $1 of FFO more or less than $1 of GAAP earnings?
It is unclear. In the case of CIO its GAAP earnings dwarf its FFO indicating that each dollar of FFO is more valuable, but in other cases FFO might be larger than GAAP.
The main equation driving whether $1 of FFO or $1 of earnings is worth more is whether appreciation is greater than or less than maintenance costs. It comes down to property type, location and fundamental trends. Overall, I think it is quite close.
As such, I think FFO multiples and earnings multiples can quite reasonably be compared on a 1 for 1 basis.
Conclusion
When we adjust index multiple reporting methodologies to be equivalent, REITs are trading at 14.89X while the S&P is trading at 16.6X-19.1X (depending on which 2023 estimate you use).
REITs appear to be a significantly better value than the S&P at current pricing.
Be the first to comment