

bestofgreenscreen/iStock via Getty Images
Here are the Top 10 REITs for Total Return over the past 5 years, as of April 6. As you can see, Independence Realty Trust (NYSE:IRT) ranks #5 on this list. Surprised?
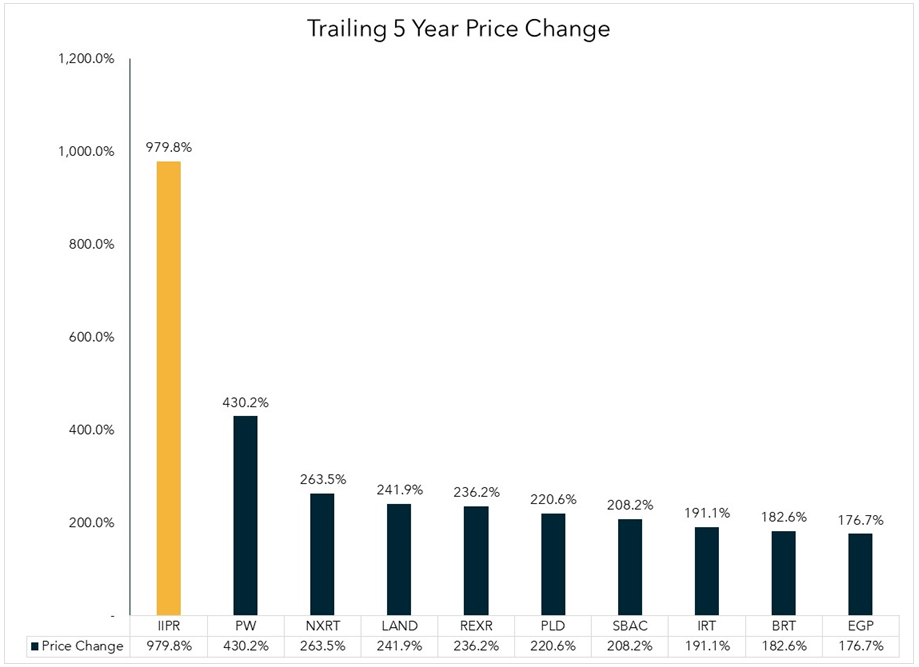
FactSet and Capital IQ Pro Here are the Top 10 for share price Gain, over that same period. IRT ranks #8 on this list, behind Rexford Industrial Realty (REXR), Prologis (PLD), and SBAC Communications (SBAC). FactSet and Capital IQ Pro Over the same time period, the trailing 5-year share price Gain for the Vanguard Real Estate ETF (VNQ) was 9.66% per annum, which translates to 58.6%, when compounded over 5 years. IRT has more than tripled that performance.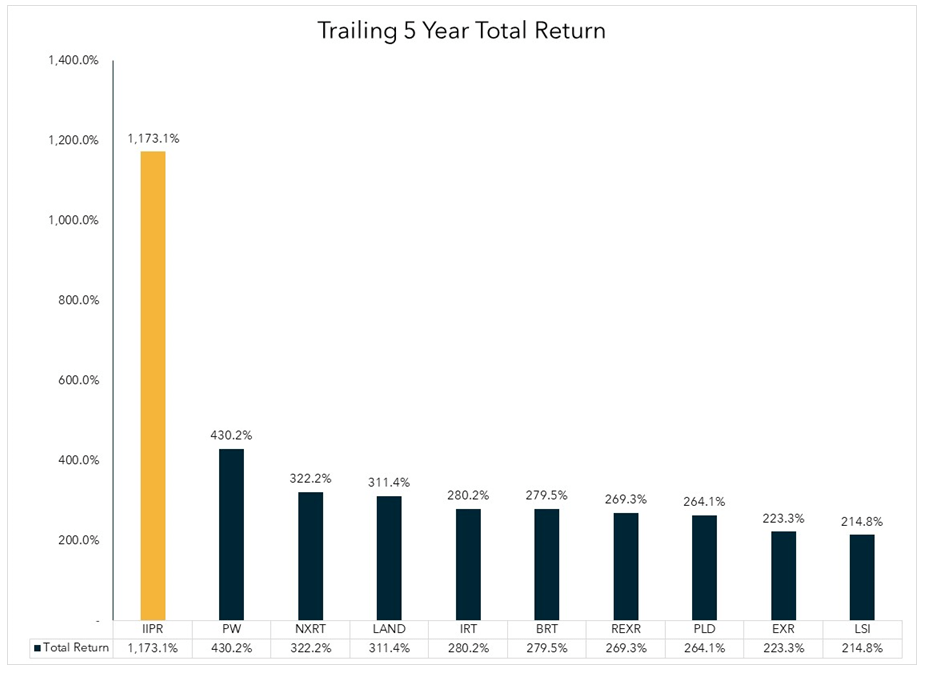
What has been the secret of IRT’s success, and are they likely to continue outperforming?
Meet the company
Last summer, IRT agreed to merge with privately-held Steadfast Apartment REIT. As a result of the merger, IRT now owns 35,498 units in 119 communities across 15 states, with 70% of NOI (net operating income) derived from assets in the Sunbelt.
Independence Realty Trust investor presentation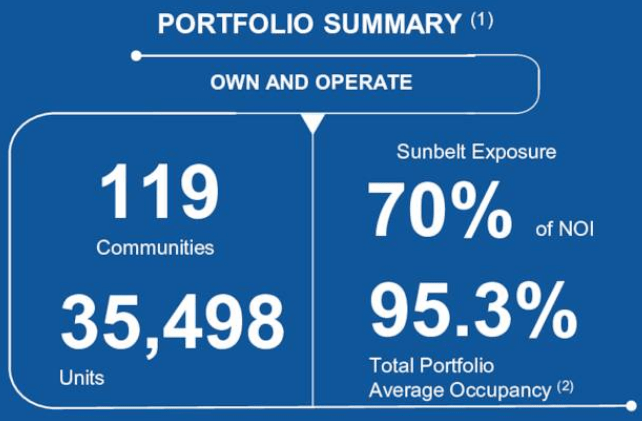
The overage occupancy for the total portfolio is a healthy 95.3%. Same-store NOI growth in Q4 2021 came in at a robust 15.1%.
Independence Realty Trust investor presentation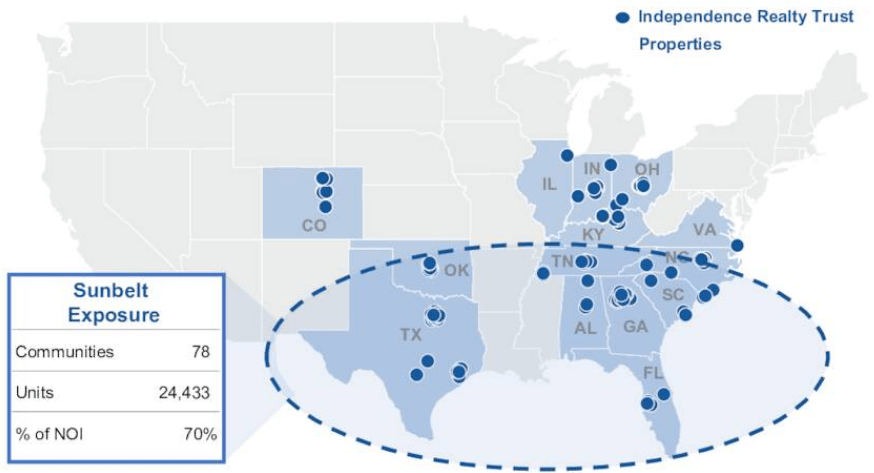
Sunbelt presence is important, of course, because population growth and employment growth currently tend to be higher in that section of the country than the U.S. average.
Independence Realty Trust investor presentation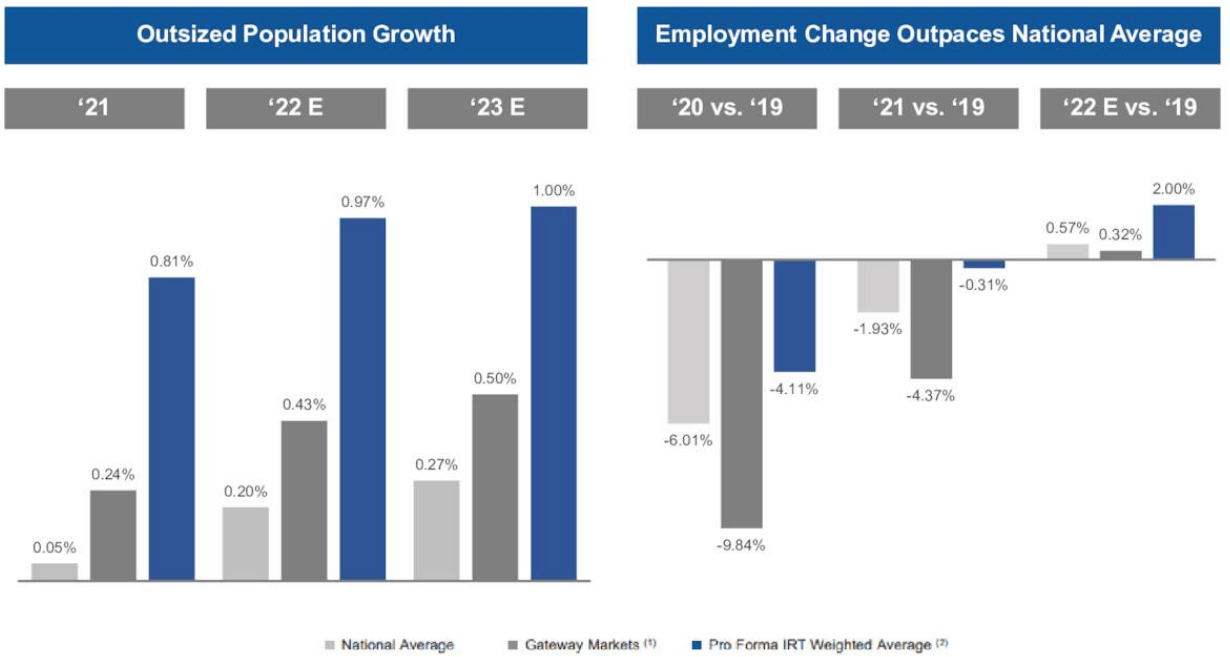
IRT concentrates mainly on Class B assets, for the reasons shown in the figure below.
Independence Realty Trust investor presentation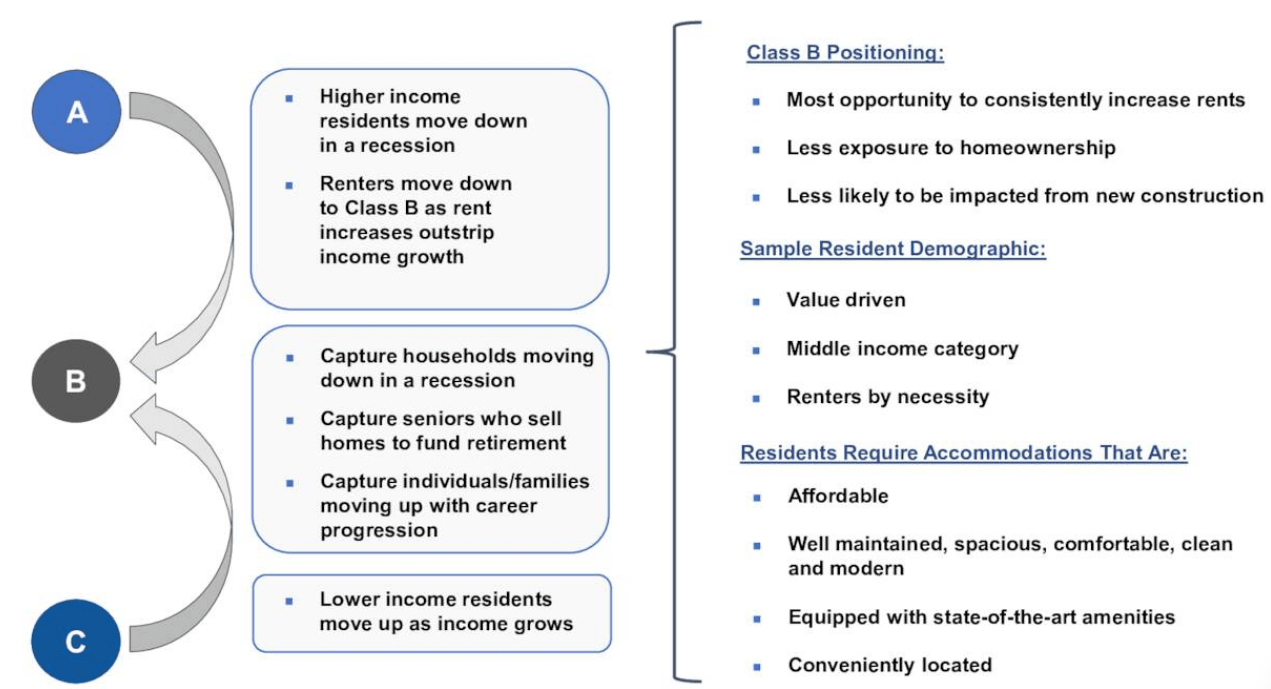
The merger with Steadfast was important, because it gives IRT the opportunity to do more of what they do best: remodeling and upgrading apartments, in order to raise the rent, and turn a nice profit in the process. To date, the company reports that value-add projects have generated an average rent increase of 20%, and an unlevered ROI (return on investment) of 18.4%. Compare that to the 3.00% – 3.75% average cap rate on external acquisitions, and you can see how this boosts the bottom line.
Prior to the merge, the company had about 7,300 units in this lucrative value-add pipeline. After the merger, that number nearly tripled, to a total of 19,327.
Independence Realty Trust investor presentation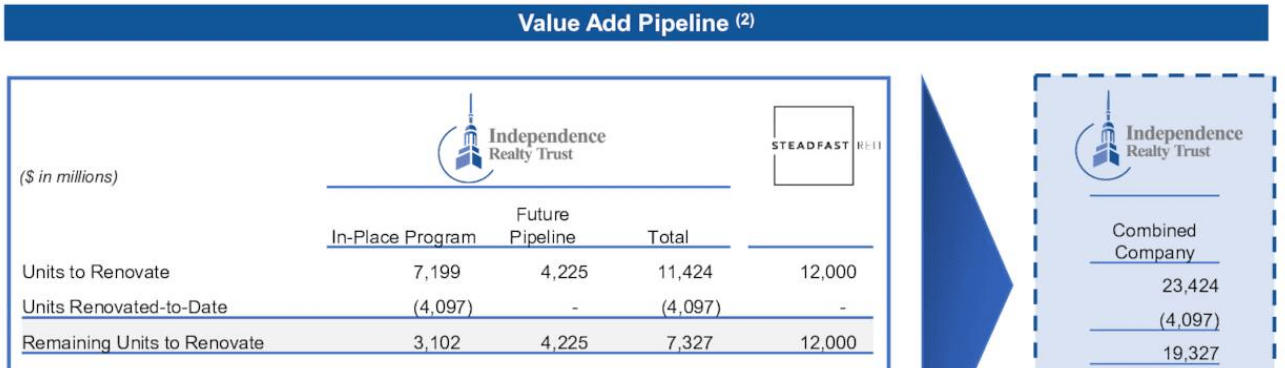
This means that more than half of IRT’s units are now in the remodeling pipeline. As R. Paul Drake has noted,
At the rate they do redevelopments, these will last close to a decade.
If you can buy an asset at a 3% market cap, then upgrade it at 15 – 20% ROI, that effectively raises the market cap. The higher the percentage of your units you can do this with, the greater the increment to the overall return.
IRT has also announced its intention to greatly expand its joint venture operations, providing capital to third-party developers in the Sunbelt. Management says the company typically makes 15 – 20% unlevered return on these deals, with an option to buy at cap rates in the low 5’s (another nice step up from the 3’s).
In the meantime, like most apartment REITs with strong Sunbelt exposure, IRT is enjoying double-digit rental spreads on both new leases and renewals, thanks to the nationwide housing shortage.
Independence Realty Trust investor presentation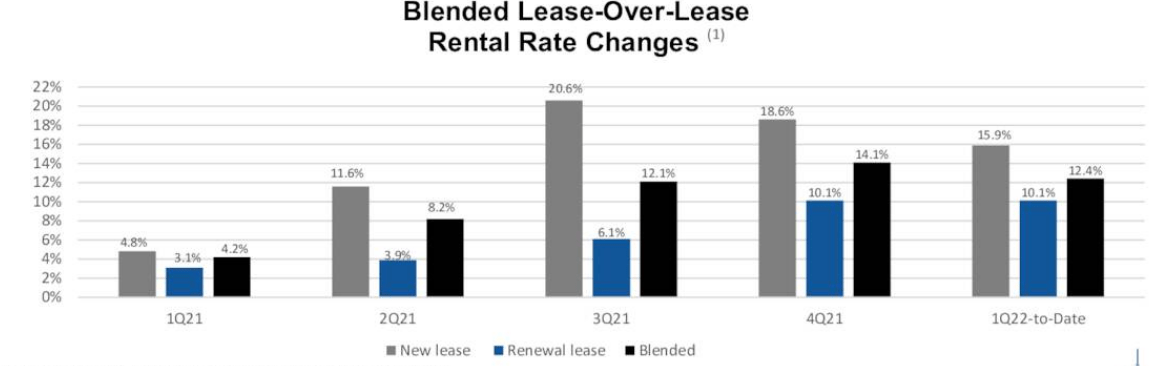
Growth metrics
IRT’s growth over the past 3 years has been spotty, partly because of the pandemic. The table below shows the annual growth rate in FFO (funds from operations), TCFO (total cash from operations), and market cap.
| Metric | 2018 | 2019 | 2020 | 2021 | 3-year CAGR |
| FFO (millions) | $60.1 | $56.2 | $67.7 | $31.7 | — |
| FFO Growth % | — | (-6.5)% | 20.5% | (-46.8)% | (-19.21)% |
| TCFO (millions) | $68.5 | $75.0 | $75.0 | $52.3 | — |
| TCFO Growth % | — | 9.5% | 0.0% | (-30.3)% | (-8.62%) |
| Market Cap | $0.81 | $1.28 | $1.27 | $5.70 | — |
| Market Cap Growth % | — | 58.0% | (-0.8%) | 348.8% | 91.63% |
Source: TD Ameritrade, Companies Market Cap, and author’s calculations
I have never seen such a strange picture. Despite spotty and strongly negative growth in FFO and TCFO, IRT has leapt from a struggling small-cap REIT, all the way to the $4 – $10 billion market cap sweet spot, in the space of just one year. On a 47% decrease in FFO, the market cap quadrupled.
The company is guiding for a sizzling 21% core FFO per share growth in 2022.
Balance sheet metrics
Judged by the balance sheet, IRT is a pretty big mess, but it is apparently a mess that investors don’t mind.
| Company | Liquidity Ratio | Debt Ratio | Debt/EBITDA | Bond Rating |
| IRT | 2.15 | 32% | 7.5* | — |
Source: TD Ameritrade, Hoya Capital Income Builder, and author calculations
* As reported by the company
The company is well aware that its debt is a major issue. By unloading 9 “non-core” apartment complexes over the last 4 months and issuing more shares to pay down debt, the company has improved its liquidity ratio considerably. The current Debt/EBITDA ratio is somewhat unclear, but even if we use the company’s claim of 7.5x, that is still a considerably heavier debt load than the average REIT. Management says it intends to keep paying this down, but its track record in this regard leaves room for considerable doubt.
Dividend metrics
IRT used to be an above-average dividend payer, until the pandemic came along. In 2020 the company slashed the quarterly distribution by one-third, and have not yet restored it. So now the company’s Yield is just average. If you invest in this company, you do it for the share price gain, not for the yield.
| Company | Div. Yield | Div. Growth | Div. Score | Payout FWD | Div. Safety |
| IRT | 2.64% | (-9.64)% | 1.95 | 50% | C- |
Source: Hoya Capital Income Builder, Seeking Alpha Premium, and author’s calculations
Dividend Score projects the Yield three years from now, if the dividend growth rate remains unchanged.
Valuation metrics
| Company | Div. Score | Price/FFO | Premium to NAV |
| IRT | 1.95 | 32.5 | 13.5% |
Source: Hoya Capital Income Builder and author’s calculations
IRT management comes in for a great deal of criticism from analysts here on Seeking Alpha, for issuing too many shares, thereby supposedly diluting the shareholders’ returns. But these authors miss a key point: IRT shares currently trade at a premium to NAV of 13.5%. That means that new share issuance is accretive.
It may also be helpful to look at this company’s history of share issuance and share price movements, to further evaluate this criticism.
| Metric | 2017 | 2018 | 2019 | 2020 | 2021 | 4-yr CAGR |
| Market Cap | $0.84 | $0.81 | $1.28 | $1.27 | $5.70 | 61.40% |
| Share Price Dec. 31 | $10.09 | $9.18 | $14.08 | $13.43 | $25.83 | — |
| Price Gain % | — | (-9.0) | 53.4 | (-4.6)% | 92.3 | 26.49% |
| M Shares Outstanding | 83.25 | 88.24 | 90.91 | 94.56 | 220.7 | — |
| % Growth in Share N | — | 6.0 | 3.0 | 4.0 | 133.4 | 27.60% |
| VNQ Share Price Dec. 31 | $82.98 | $74.6 | $92.79 | $84.93 | $116.0 | — |
| VNQ Share Price Gain % | — | (-10.) | 24.4 | (-8.5) | 36.6 | 8.74% |
Source: CompaniesMarketCap.com, MarketWatch, and author’s calculations
Comparing the yellow rows of the table above, we can see the following:
- IRT’s share price has outperformed the VNQ in each and every one of the past 4 years, more than tripling the VNQ over that period.
- IRT grew its share count by a totally ordinary 4 – 6% each year until 2021, when the number of shares more than doubled. No doubt much of this is due to the merger with Steadfast.
If share issuance was dilutive of shareholders’ stake, it certainly doesn’t show in the price gain.
Another accusation leveled by the company’s critics is that it gives its own management lavish raises. Call me old-fashioned, but if the company is tripling the market, I think the managers deserve a raise.
What could go wrong?
IRT depends heavily on being able to profitably upgrade their newly-acquired apartments, to earn hefty rent increases. Construction and remodeling costs are going up all across the country, and this may eat into the ROI of these value-add projects.
There is no guarantee that the population and job growth shift to the Sunbelt is permanent. If the people or the jobs move elsewhere, IRT’s enviable rent spreads could evaporate.
The company is investing much more in joint ventures than ever before. Joint venture partners may have competing interests, may fail to carry out their end of the bargain, may develop friction with IRT, and could go bankrupt. Ironically, the better a joint venture performs, the greater the risk that profits will be allocated disproportionately in favor of the joint venture partner.
My history with this company
To become a better investor, I reflect on these 5 questions:
- When and where did I first hear about this stock?
- What prompted my decision to buy or not buy it?
- What prompted my decisions to sell or hold it?
- What patterns emerge that tell me more about myself as an investor?
- What changes do I need to make, to be a better investor?
I’m not sure where I first heard of this company, but it passed my screens for growth and gain, and I allocated 3% to a position in late summer of 2019. Having learned a bit more about the importance of the balance sheet, I trimmed about half in January 2020, at a loss of about 2%, due to concerns about the company’s debt ratio. I did a little more speculative trimming that summer at a 20% loss, then liquidated the position in November of 2020, over concerns about dividend cuts and uncollected rent. I took about a 2% loss on those shares, and reinvested elsewhere. So here was a company averaging 27% gain per annum, and I took a loss of about 7% on my transactions, in about a year, approximately matching the market. Pure genius on my part, huh?
The main thing I learned from this, other than to hold for longer periods of time, is that the balance sheet isn’t quite as determinative as I thought. Sometimes I need to bend my guidelines on liquidity and debt ratios, to account for companies whose business models cause them to take on more debt. Like all REITs, IRT takes on some debt to buy new assets, but then takes on additional debt to do what it does best: upgrade those assets into higher-revenue units.
Have you been on board for some or all of this 5-year rocket ride?
Investor’s Bottom Line
The Apartment REIT sector is one of 7 sectors I consider likely to outperform in 2022. I recently reviewed the sector to pick a winner. IRT was eliminated early in the analysis, because of its worse-than-average debt metrics. Maybe that was not the best place to start the analysis.
This is an intriguing company. Sometimes, if you want to outperform the herd, you have to kill a few sacred cows. IRT’s 5-year returns place them in the 98th percentile of REITdom. Writers here on Seeking Alpha have slammed the company for overpaying the management team, carrying too much debt, and issuing too many shares. In light of the results, however, how important do those issues turn out to be?
Is it possible that this company’s management has seen a light that has not yet dawned on the rest of us? Could it be that our well-traveled orthodoxies are not as true as they are tried? After all, if we knew everything about the market, and about what makes a company successful, wouldn’t investing be easy? And wouldn’t everybody be getting rich?
The Seeking Alpha Quant Ratings show IRT as a Hold, appalled by its valuation metrics. The Wall Street Analysts tracked by Seeking Alpha, however, rate the company a definite Buy, as does The Street. Zacks, Ford Equity Research, and TipRanks all rate IRT a Strong Buy. KeyBanc rates it Overweight with a $29 price target, while Deutsche Bank calls it a Buy with a $30 target. As for me, I need to watch this company a while longer before I take another plunge.
Be the first to comment