

marchmeena29/iStock via Getty Images
Introduction
Illinois Tool Works (NYSE:ITW) isn’t a fast-growing company. However, it’s one of less than 70 dividend aristocrats in the United States with more than 25 years of consecutive dividend hikes that also scores high when it comes to its yield, dividend safety, and dividend growth. The company is great at growing its free cash flow thanks to strong margins. This has serviced investors well as ITW is a source of outperforming capital gains without exposing its investors to uncomfortably high volatility. However, right now, the stock is suffering. Supply chain issues and inflation on top of an aggressive Fed are hurting the market. The stock is down more than 27% year to date, which is hurting investors looking for quick capital gains. However, it is causing the company to trade at an attractive valuation, which includes a more than decent yield of close to 3.0%. Again, this market isn’t fun, but dividend (growth) investors need opportunities like these to buy quality exposure.
Let me explain the whys and hows.
But first, let’s talk about this market.
A Tricky Market
I don’t know who came up with this, but someone once said that the best buying opportunities are the ones when buying feels absolutely wrong. That’s how I felt when I added to my dividend portfolio over the past few days. I initiated a new position in Danaher (DHR) and added to some rail stocks.
What we’re currently dealing with is the fastest valuation compression in modern history as the chart below shows.
Bloomberg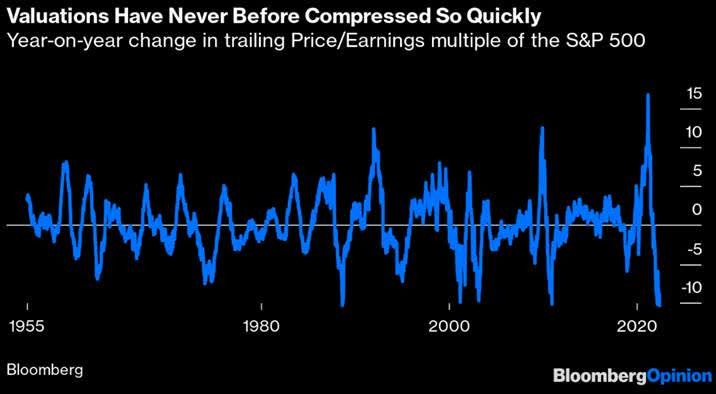
It comes at a time when retail investors are extremely bearish. The AAII Investor Sentiment Survey bull minus bear spread is at its lowest level since 2009.
AAII 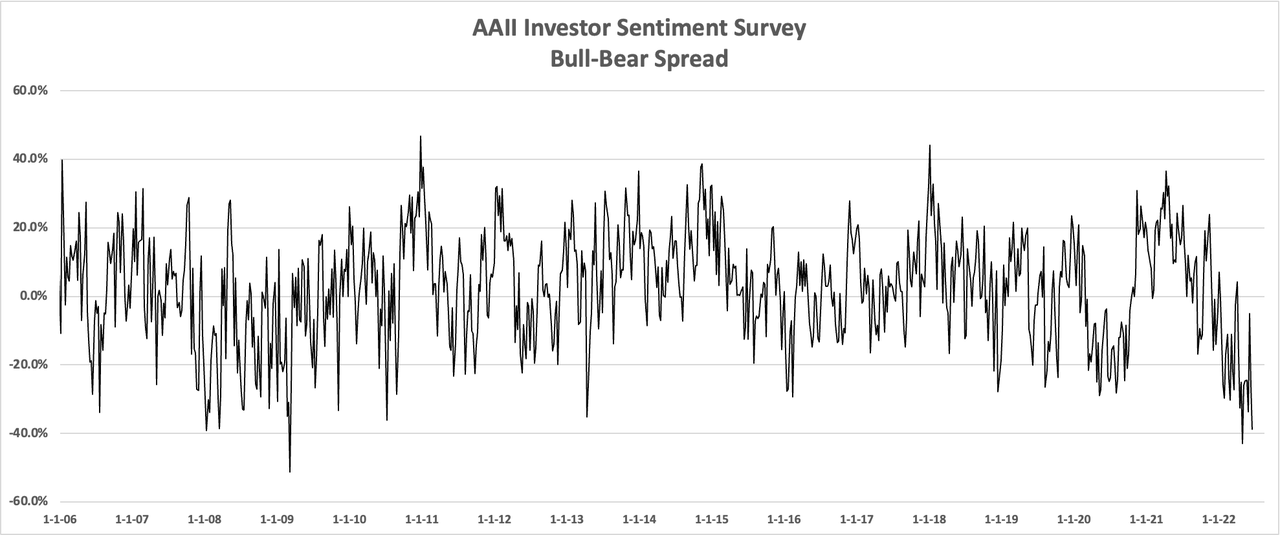
The 2020 selloff was worse, yet the sentiment is lower. I believe this is because 2020 was a sudden and steep decline that did not hurt tech stock as much as the “average” stock. Retail back then quickly piled into tech and stuff like crypto that benefited from the Fed’s quick reaction.
Right now, everything is different.
We’re not dealing with a sudden shock like a pandemic but a toxic mix of high inflation, supply chain problems, overseas lockdowns, the war in Ukraine, and an energy crisis that won’t be solved until supply comes back roaring.
A lot of these issues are related and causing economic indicators like the one below to point to a (manufacturing) recession. Note that I added the Illinois Tool Works year-on-year stock price performance. If ITW were to close this month at current prices, it would be one of the biggest selloffs since the Great Financial Crisis – meaning a lot has been priced in.
Author (New York, Philadelphia Fed)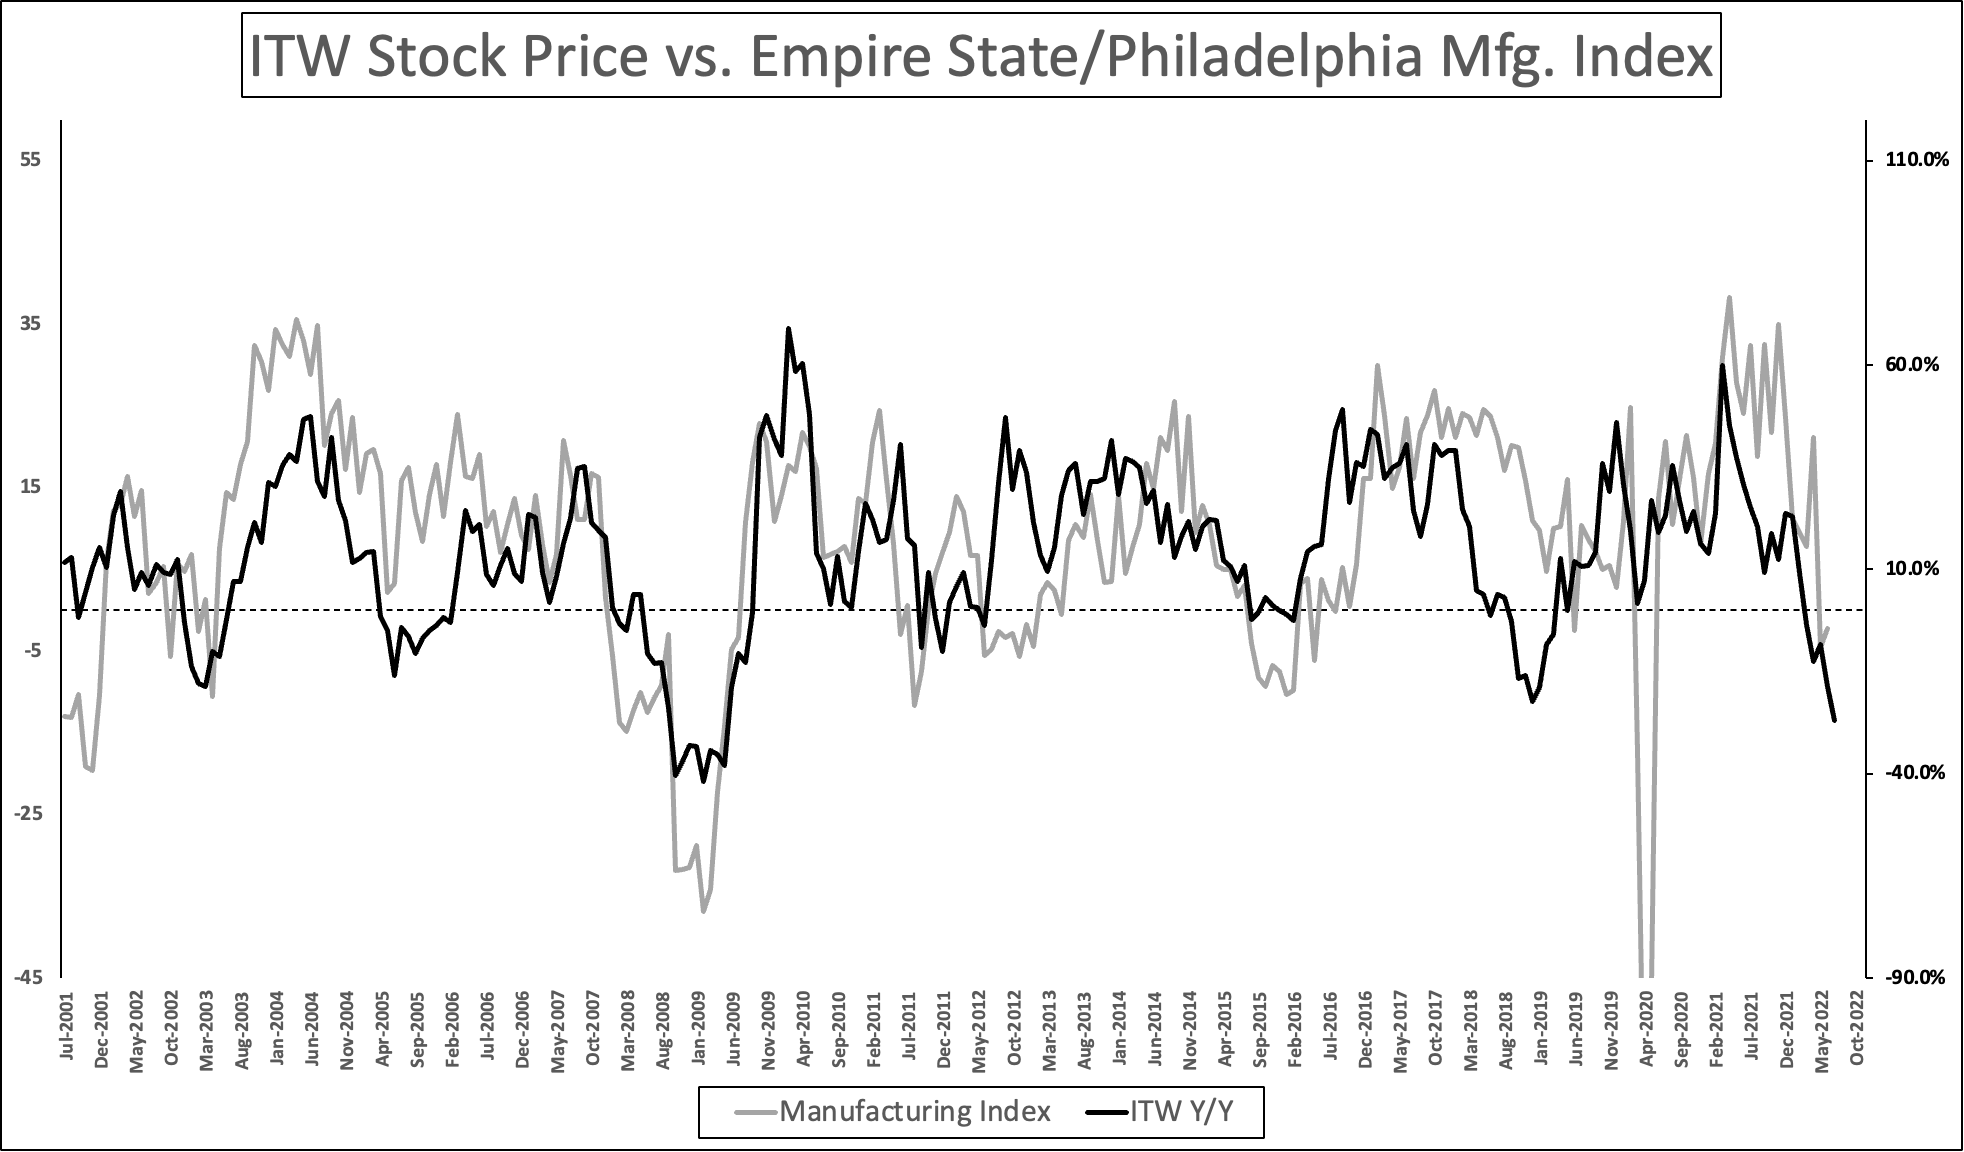
With that said, asset managers are selling as well. The chart below shows asset managers/institutional positioning for the S&P 500 E-mini future, the most traded equity futures contract in the world. As of June 14, asset managers (smart money) are short 753K contracts versus long 960K contracts. This puts net positions at just 206K contracts (the yellow line in the chart below). That’s one of the lowest numbers in the past 15 years as it’s close to the lows of the Great Financial Crisis, the 2016 manufacturing recession, and the pandemic selloff.
CME Group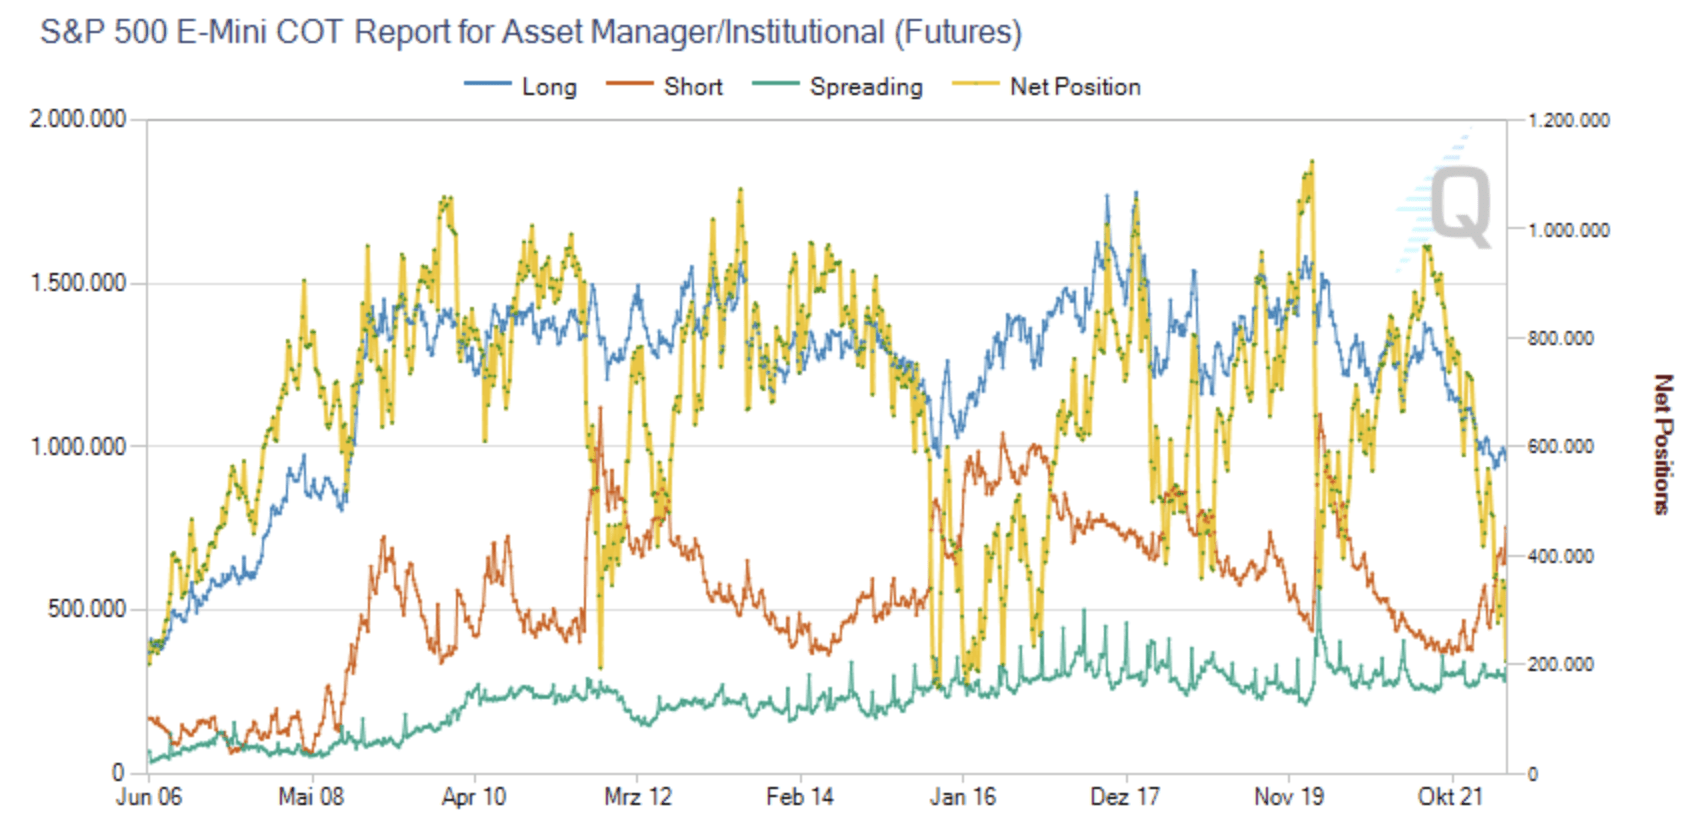
Moreover, just 12.8% of S&P 500 stocks are trading above their 200-day moving average. This, too, is one of the lowest numbers in recent history.
StockCharts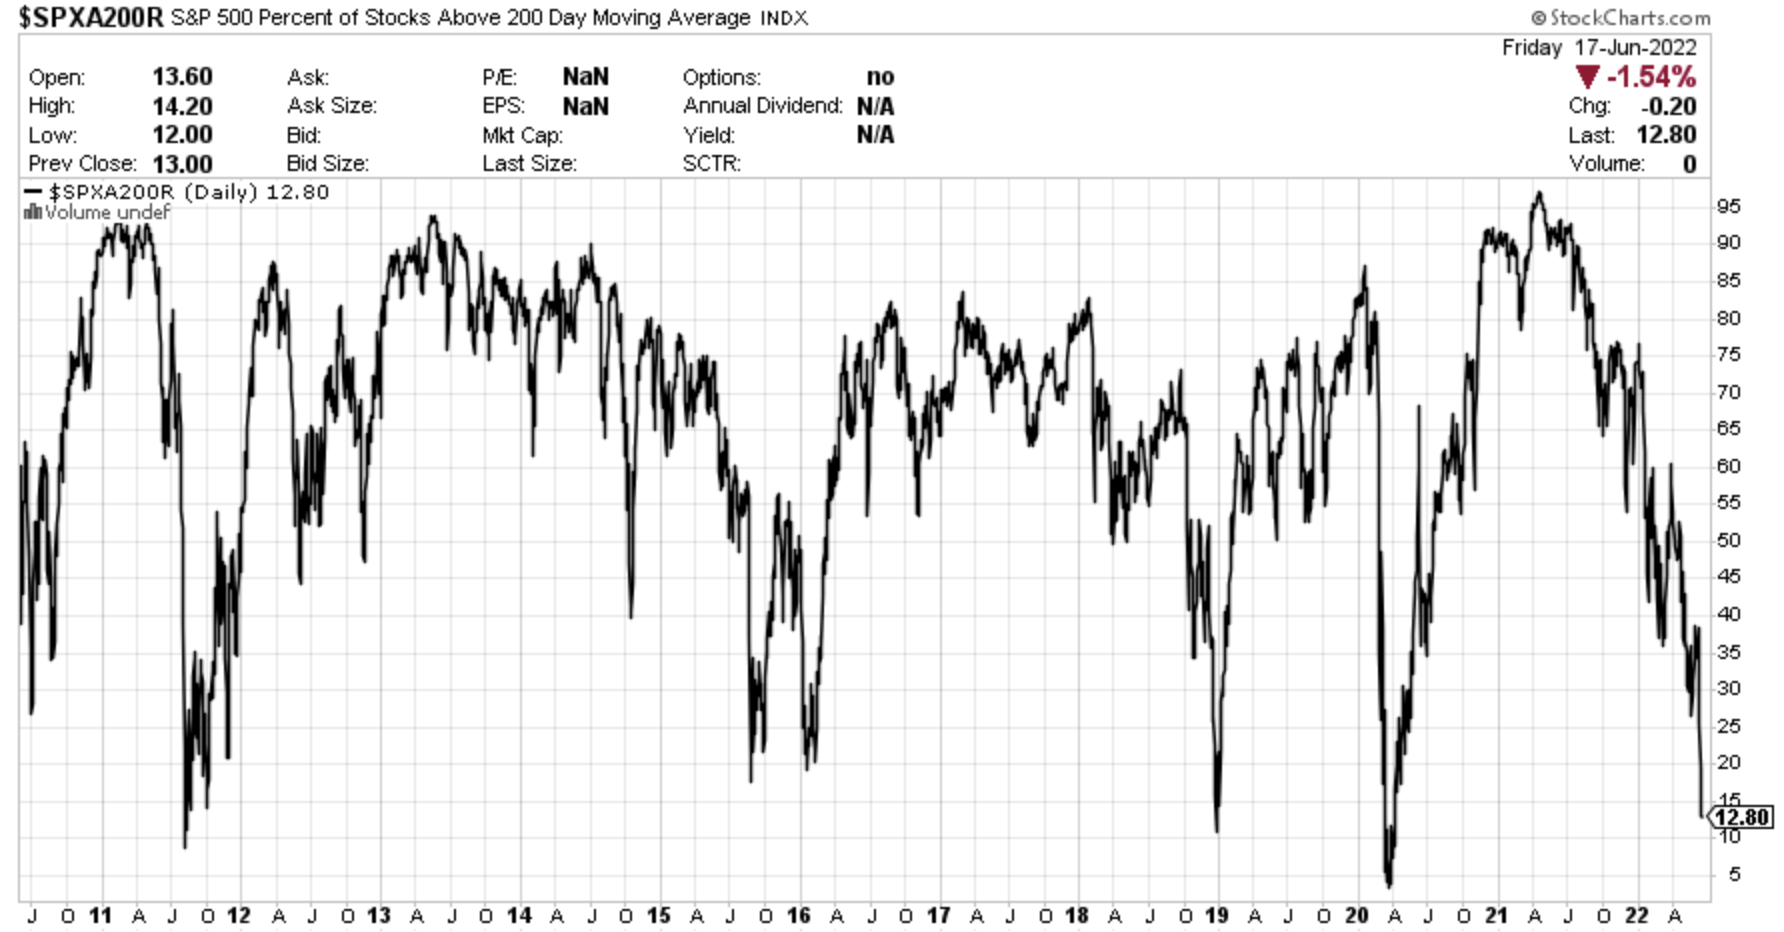
So far, we have a situation where economic expectations are in contraction territory. Retail is scared. Smart money is “de-risking”, and the market seems extremely oversold.
This, of course, does not mean that we’re at the bottom. There are no guarantees in investing and all indicators I just showed you can get worse.
However, as a long-term investor, I care for good prices that allow me to expand my portfolio. Stocks will bounce back eventually, and buying when the S&P 500 is down almost 25% from its highs has historically speaking always been the way to go – even if it often came with a lot of volatility and frustration for some.
Twitter (@Growth_Value_)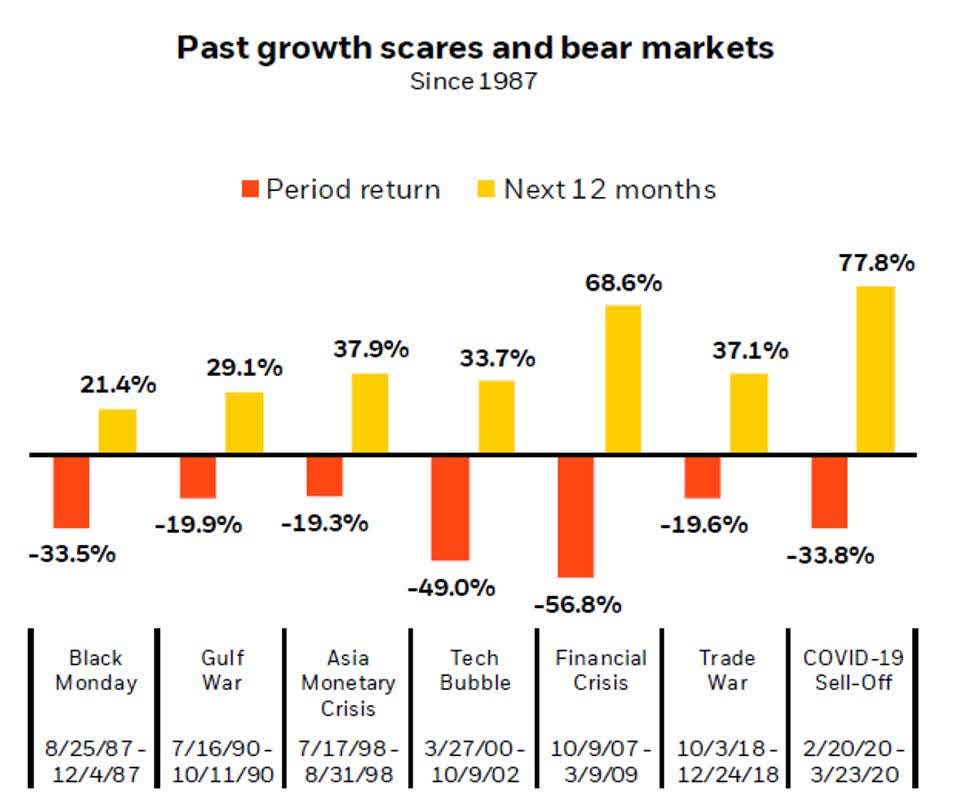
So, with that said, let’s look at a dividend stock that may be a good addition to your portfolio.
ITW Combines Yield & Growth
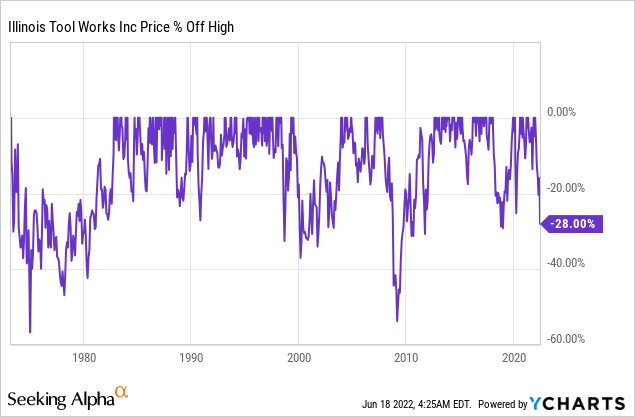
ITW is trading roughly 28% below its all-time high in one of the worst selloffs in recent history.
What sets ITW apart from its sector peers is fantastic (relative) dividend scores in various categories. The company scores an A+ in dividend growth and dividend consistency (dividend aristocrat), an A in dividend safety, and a B for its yield.
Seeking Alpha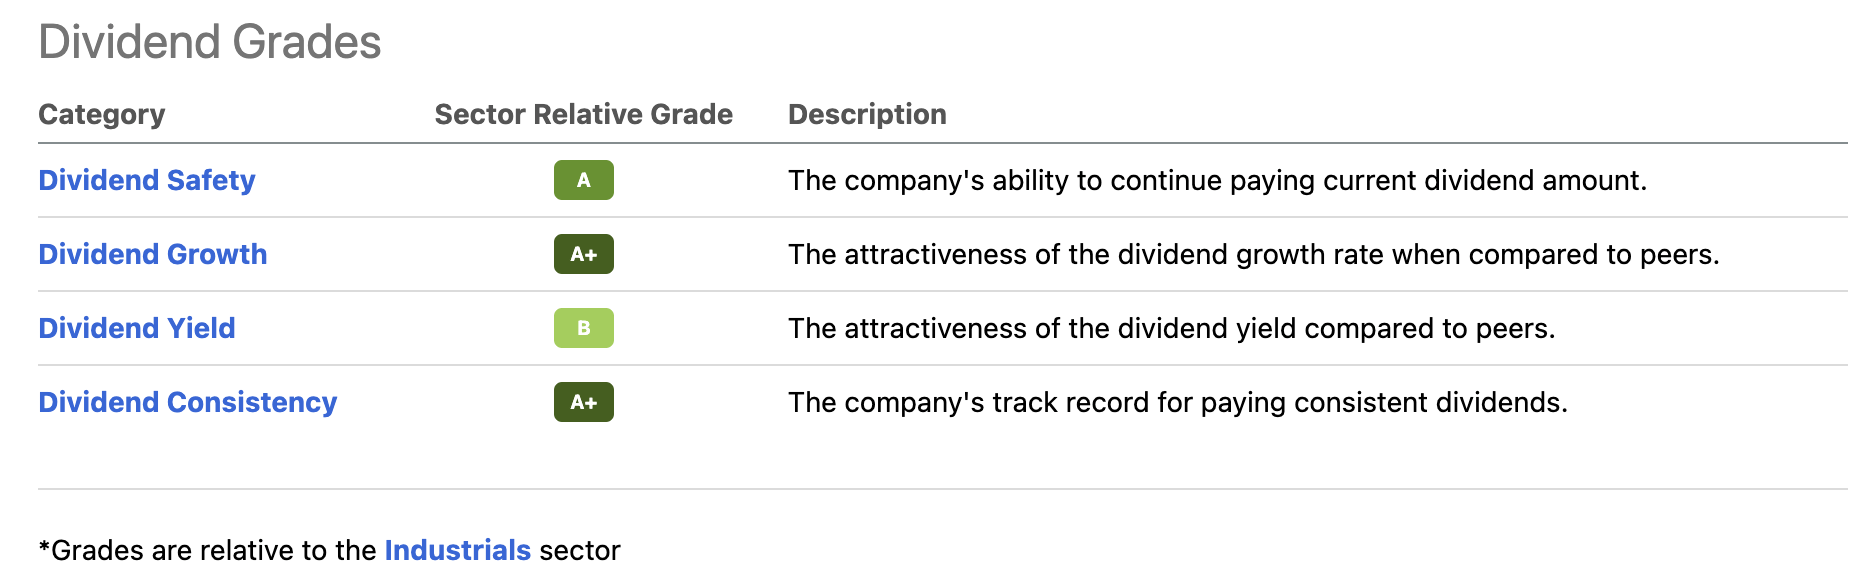
Stability, in general, is provided by the company’s business model. This $55.7 billion industrial company operates in various markets where it sells equipment and related products/services.
It has extremely well-diversified exposure in automotive, test & measurement systems, food equipment, construction, and others. Even its smallest segment still accounts for 11% of total 2021 sales. To put it bluntly, the company is a capital expenditure (“CapEx”) play as it basically sells products that companies buy when they decide to invest in their own business capabilities. This explains why ITW follows economic expectations so well (the chart I showed earlier in this article). Adding to that, the company benefits from a weaker dollar as more than 50% of its sales are generated outside of the United States. A weaker dollar means higher international sales without growing volumes.
MarketScreener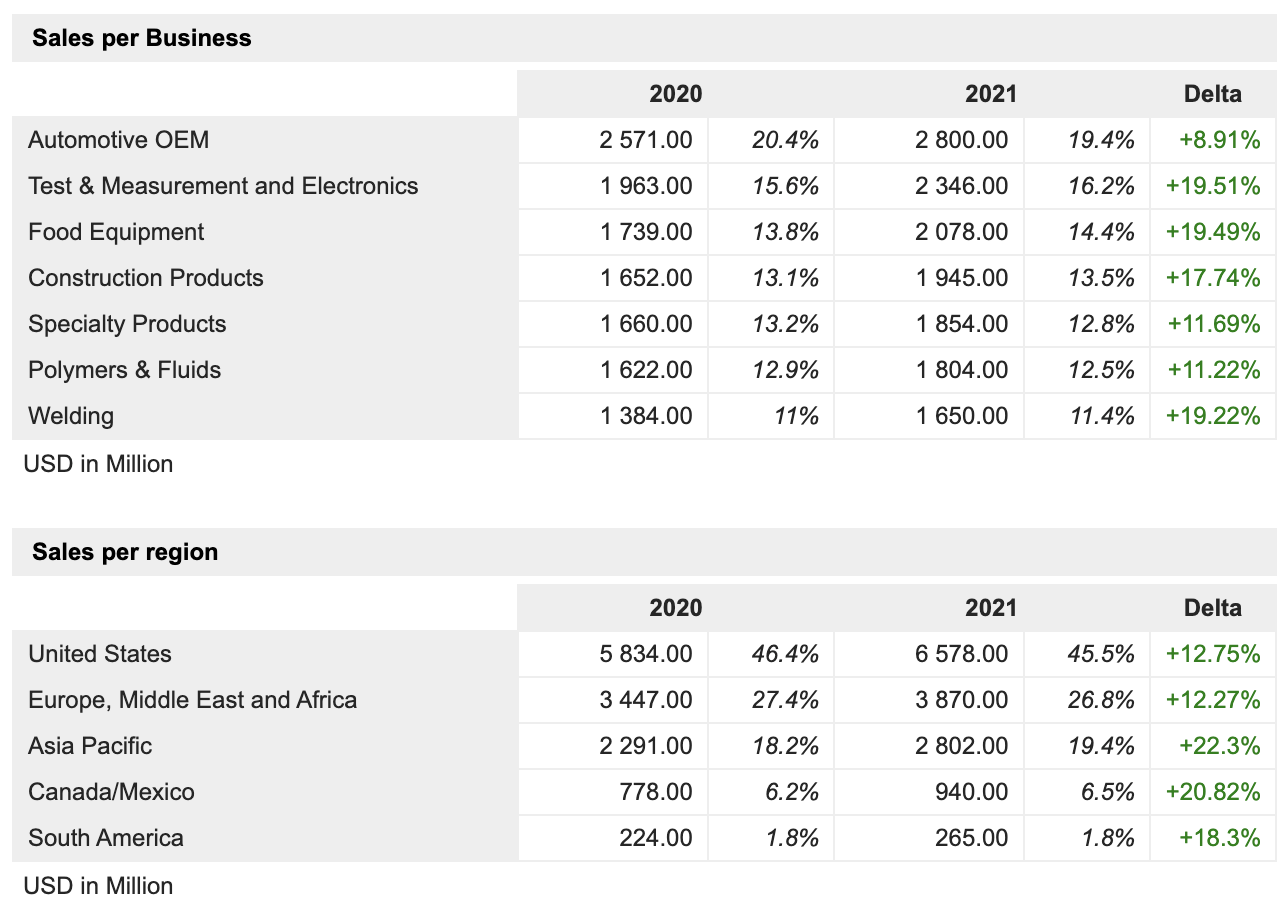
Right now, the dollar is strong, which is adding to ITW’s troubles.
With that said, ITW is not a fast-growing company. At least not when it comes to its top line. Using Seeking Alpha’s CAGR overview, we see that 10-year revenue growth is down 1.8% (compounded annual growth rate). Over the past five years, that number is positive at 1.5%. That’s not a lot. However, thanks to rising margins, the company has grown net income by 5.0% per year over the past 5 years.
Seeking Alpha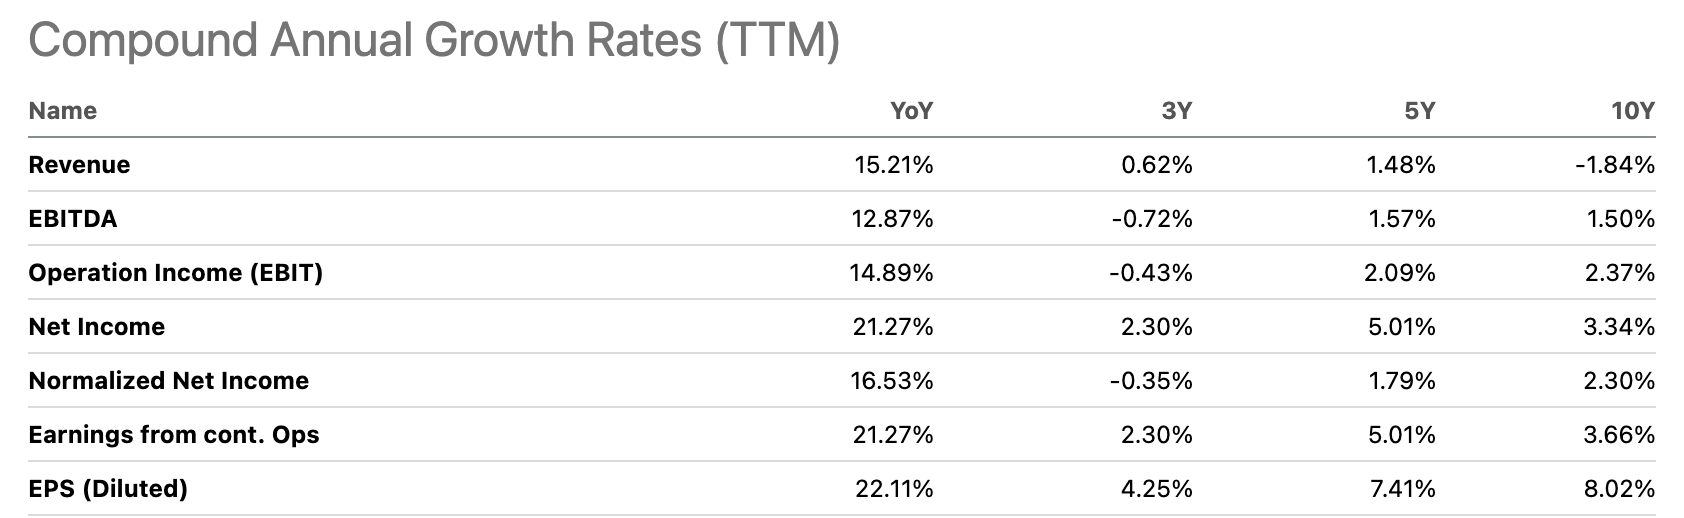
Rising margins have also led to much stronger free cash flow generation. Free cash flow is operating cash flow (net income adjusted for non-cash operating items) minus CapEx. In the case of ITW, free cash flow is now expected to remain above net income, which indicates quality earnings as it comes with so much cash for the company.
TIKR.com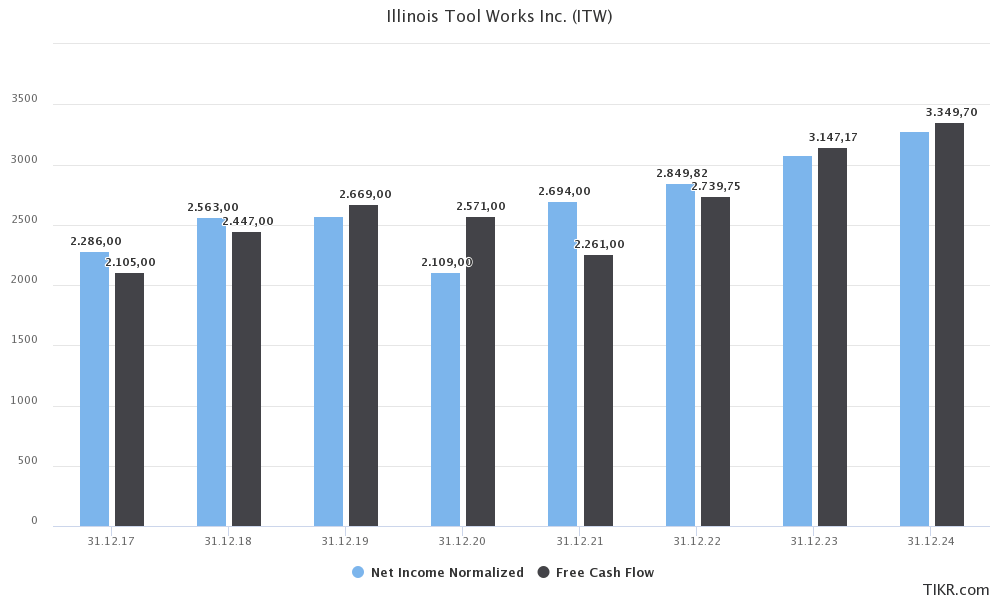
In 2023, ITW is expected to do $3.15 billion in free cash flow, followed by a surge to $3.35 billion in 2024. This implies free cash flow yields of 5.7% and 6.0%, respectively.
In this case, it helps that the company has a healthy balance sheet. This year, net debt is expected to end up at $6.4 billion. That’s roughly 1.5x EBITDA. This could fall to 1.0x EBITDA in 2024 thanks to high free cash flow.
TIKR.com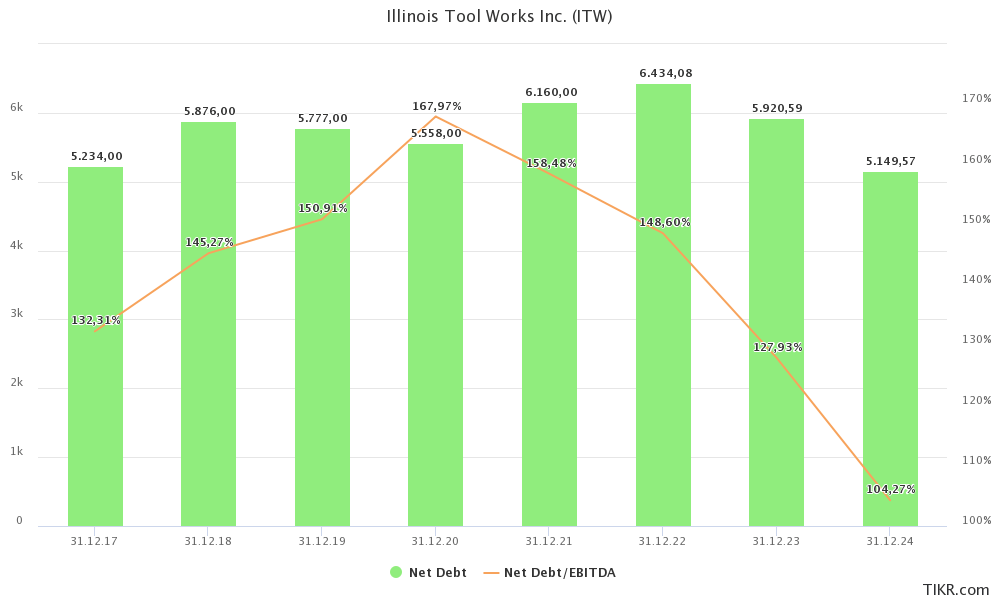
I’m mentioning net debt because the company does not need to prioritize its balance sheet. It can focus on returning cash to shareholders instead of bondholders.
Right now, the company is paying a $1.22 quarterly dividend. This translates to $4.88 per year. That’s 2.7% of its stock price – the dividend yield.
This yield is one of the highest yields in its history. Only the Great Financial Crisis and the COVID selloff led to higher yields.
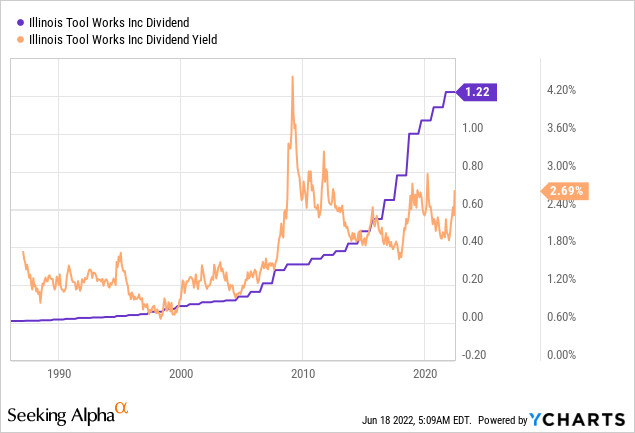
This 2.7% yield is a decent number, which gets better when looking at ITW’s dividend growth.
ITW is one of the few dividend aristocrats with high dividend growth. Over the past 10 years, the average annual dividend growth rate is 13.0%. That is impressive and it really ends up when using 2.7% as a starting point.
However, because of the pandemic and related challenges, dividend growth has slowed. The 3-year average is 8.3%. The most recent hike was 7% on August 6, 2021.
Even if dividend growth remains somewhere close to 8-9%, investors are in a great spot. After all, implied free cash flow is close to 6% of the market cap, which means dividend safety is high – even if free cash flow takes a (big) hit.
A 2.7% yield can quickly turn into a 5.3% yield on cost using a 7% annual growth rate over the next 10 years.
In addition to that, the company is known for its share repurchases. Between 2017 and 2021, the company bought back 8.4% of its shares outstanding. This increases the value of shares outstanding and it (artificially) boosts earnings per share. It’s a great way for companies with rather slow growth to boost their EPS and share prices, which brings me to the next topic.
Valuation & Outperformance
Including dividends, ITW has returned 14.1% since 1987, which is nothing short of impressive. It turned a $10K investment (which was a lot in 1987 – and it still is) into $936K, outperforming the S&P 500 by more than 300 basis points per year. The standard deviation during this period was 23%, which is higher than the S&P 500 (which is obviously a basket of stocks). As a result, the Sharpe ratio (volatility-adjusted return) is somewhat equal.
Portfolio Visualizer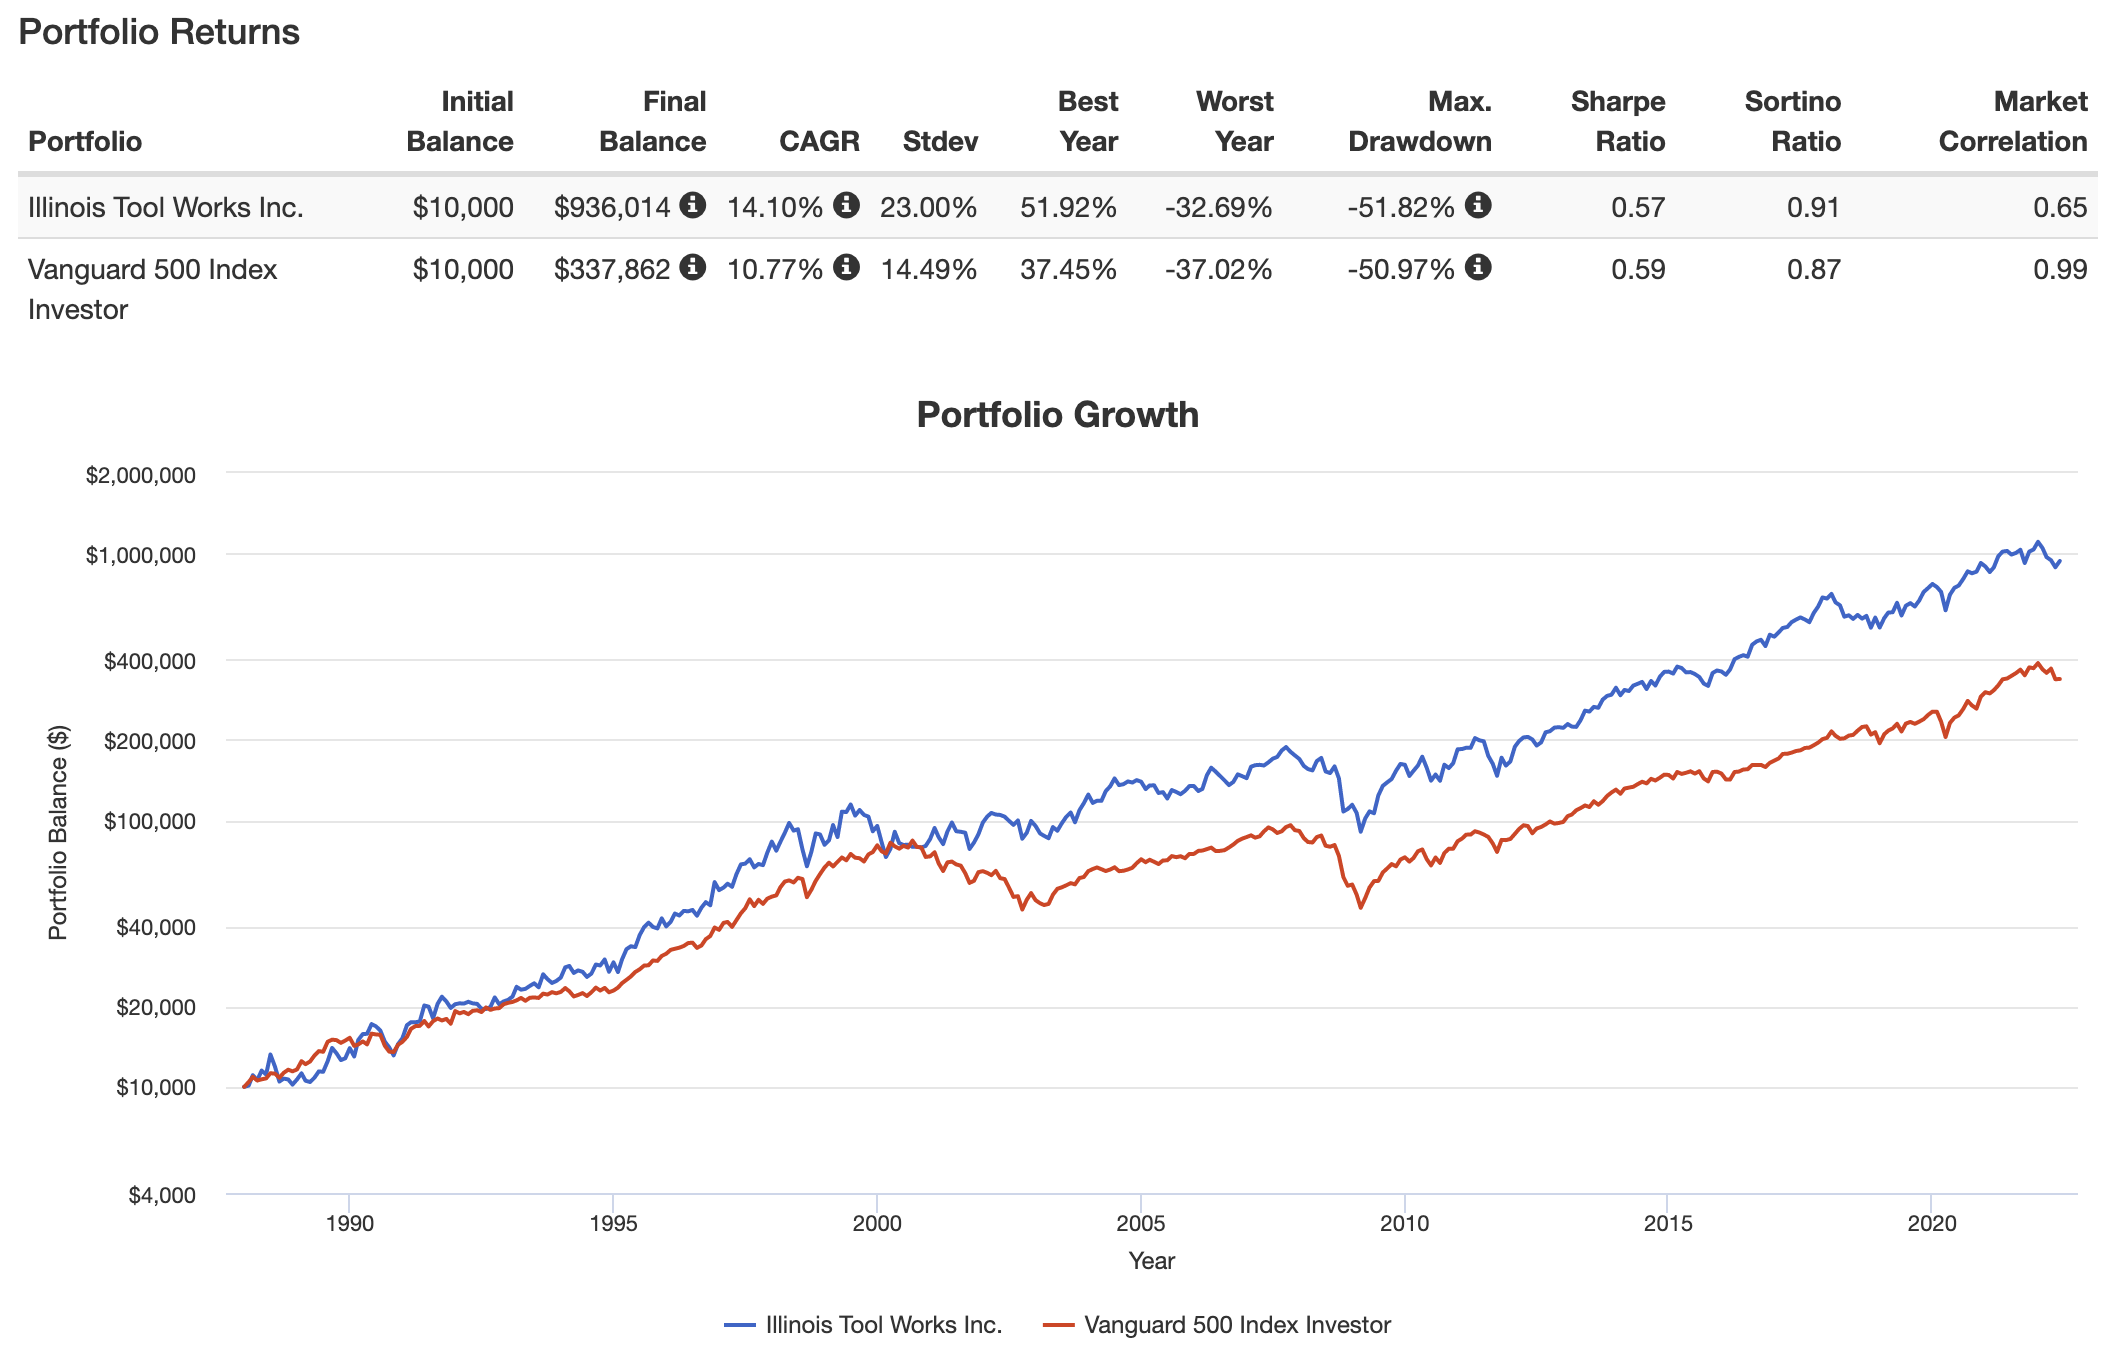
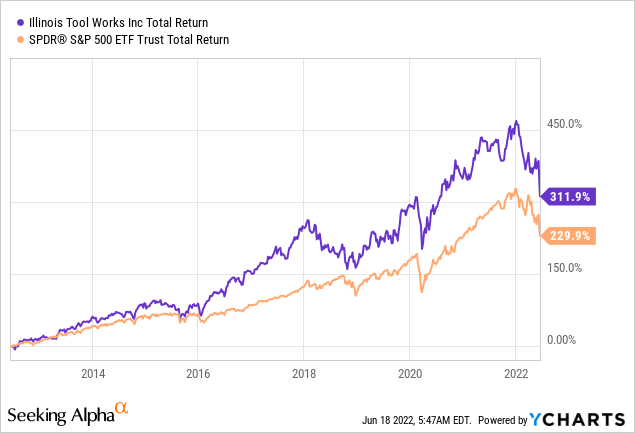
Over the past 10 years, ITW has returned 312%, beating the S&P 500 by 82 points.
Valuation-wise, things are looking much better. ITW is trading at 13.4x 2023 EBITDA using its $55.7 billion market cap, $5.9 billion in expected net debt, and $380 million in pension-related liabilities.
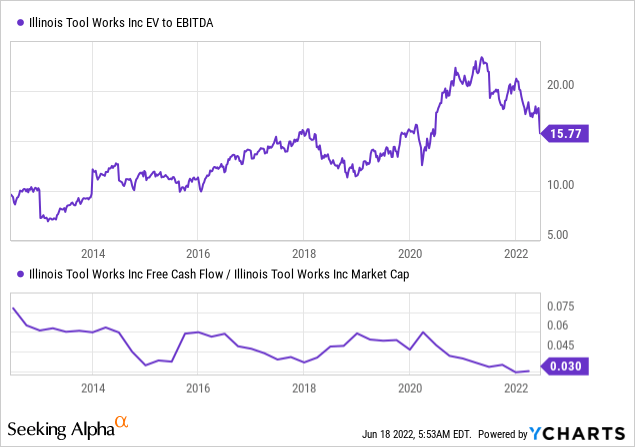
The implied free cash flow yield of 5.7% is close to the upper bound of the 10-year range. Even if free cash flow comes in 20% lower than expected, the company is not overvalued. And this gives us a rather large margin of safety.
Takeaway
This market isn’t fun, but it offers opportunities. Economic growth expectations have come down a lot, retail investors haven’t been this bearish in more than a decade, and smart money has significantly de-risked their portfolios.
While this does not mean that the market will bottom, it makes the risk/reward for investors much better. One of the stocks I like is Illinois Tool Works. In this article, I explained why and how the company follows economic cycles so well and what this means for dividend (growth) investors.
The company is trading at an attractive level, even if analyst expectations come down further. ITW has a 2.7% dividend yield – one of the highest in years – and an expected dividend growth rate in high-single-digit territory backed by the company’s ability to turn earnings into cash.
ITW is the total package of a stable business model, great dividend growth on top of a more than decent yield, share buybacks with excess cash, and a healthy balance sheet.
The only reason why I’m not buying is that I have roughly 50% industrial exposure in my portfolio. I’m looking to diversify first.
New investors looking to buy into ITW should break up their initial investment. For example, buy 25% now and add gradually over time. That way investors can average down when the stock continues to fall. If the stock suddenly rises, investors have a foot in the door.
This is how I add new holdings in this market as I do like the risk/reward at current levels. It’s just close to impossible to buy the bottom.
(Dis)agree? Let me know in the comments!
Be the first to comment