

DNY59/iStock via Getty Images
Interest Coverage Ratio Definition
Interest coverage ratio is a measure of a company’s profitability compared with its annual interest expense. Both investors and bank lenders use the interest coverage ratio to assess a company’s financial strength. Generally, the interest coverage ratio is calculated using a company’s earnings before interest and taxes (EBIT) divided by its annual interest expense. This ratio is sometimes also known as the times interest earned ratio.
How It’s Used & Why It’s Important
Interest coverage ratio is useful for giving a quick snapshot of a company’s ability to pay its interest obligations. The number gives analysts an overview of a company’s financial strength.
Generally, a higher interest coverage ratio is better than a lower one. A higher ratio represents a stronger ability to meet a company’s interest expenses out of its operating earnings. Too low of an interest coverage ratio can signify that a company may be in peril if its earnings or economic conditions worsen.
That said, there may be a limit to how high of an interest coverage ratio is appropriate for a company as well. Firms can often benefit from using debt to invest in new growth opportunities. It could be counterproductive for a firm to pay off debt and thus raise its interest coverage ratio if it would have to forego highly profitable investments to reduce its debt load.
Interest Coverage Ratio Formula (EBIT) & How It’s Calculated
The interest coverage ratio is generally calculated as follows:
Interest coverage ratio formula (Author)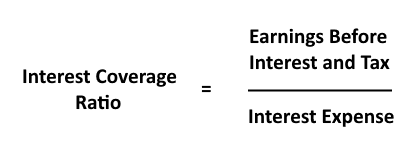
To calculate this formula, take a company’s annual earnings before interest and taxes (EBIT) and divide by the company’s annual interest expense. The result is the interest coverage ratio for that firm.
EBITDA Coverage Ratio
The Interest Coverage Ratio can be calculated using two primary ratios. Using EBIT, as described above, is the most prevalent form. However, some analysts prefer to use the EBITDA to Interest Coverage Ratio instead.
EBITDA is different from EBIT in that it excludes depreciation and amortization from the figure as well. EBITDA has become a popular metric in financial analysis because many people view it as a close approximation to a company’s ability to generate free cash flow. This can be useful in the context of debt analysis, since a company repays banks with cash flow, not with accounting earnings. Items such as depreciation are real economic expenses, but not ones that immediately impact a company’s quarterly cash flows and thus its ability to meet interest payment obligations.
As for whether EBIT or EBITDA is the better numerator for this formula, that’s up to the individual analyst to decide. Both have their place, depending on the context. Also, in some industries, use of EBITDA is more prevalent given specific costs associated with those sectors.
Benefits & Limitations of Using the Coverage Ratio
The interest coverage ratio can be useful in a variety of circumstances. However, it also can have some drawbacks. Here are examples of both.
Benefits of Using the Interest Coverage Ratio
- Useful For Screening: A financial screener setting, such as excluding companies with an interest coverage ratio under 1, can quickly filter out firms with a shaky financial picture.
- Simplifies Balance Sheet Information: There’s a lot of moving parts when analyzing a company’s balance sheet. The interest coverage ratio takes all this data and distills it into one clean easy-to-read metric.
- Helps Identify A Financial Trend: Looking at the evolution of a company’s interest coverage ratio over time can help determine whether a company’s financial strength is improving or deteriorating over time.
Limitations of the Interest Coverage Ratio
-
Rollover Risk: A company can see its interest expense change dramatically when it has to refinance its debt. Particularly now with interest rates rising rapidly, interest costs could quickly rise versus prior years.
-
Fluctuating Earnings: The other side of the equation can also change. Particularly for cyclical companies, earnings that easily exceed interest one year may come up short the next.
-
Rewards Overly Conservative Balance Sheets: Generally, investors want to see the best possible numbers on things such as earnings and cash flow. With interest coverage, however, a “too good” number might indicate that management isn’t using debt efficiently and is failing to maximize potential returns of the business.
Tip: In a rapidly changing interest rate environment, companies may see their interest coverage ratios change significantly, even if their debt load remains constant.
Interpreting the Interest Coverage Ratio for Investors
An interest coverage ratio of 1.0 would mean that a company earns the same in EBIT as it spends on interest. All else held equal, this would be a sustainable but not particularly comfortable position for most companies. A ratio of just 0.5, by contrast, would mean that a company is spending twice as much on interest as it earns in EBIT every year. This would often be true of companies in a distressed situation.
A higher interest coverage ratio, to go the other direction, would show financial strength. A ratio of 2.0, for example, would mean that a company generates twice as much in annual EBIT as it spends on interest.
What’s a Good Interest Coverage Ratio?
In the majority of cases, investors would prefer companies to have an interest coverage ratio significantly above 1. There can be exceptions such as in highly cyclical industries or in companies that are temporarily under-earning versus their potential. In general, however, it’s preferable to have EBIT well in excess of interest in order to provide a cushion in case anything goes wrong.
That said, there can be a limit to how high an optimal interest coverage ratio would be. It can be financially efficient for companies to borrow money to invest in projects which will generate high returns on capital. Forgoing an investment, for example, that would pay 15% a year returns simply to improve a company’s interest coverage ratio would likely be suboptimal for shareholders.
Bottom Line
Balance sheets are a complicated thing. Investors should carefully review a company’s assets and liabilities when considering individual companies. That said, metrics such as interest coverage ratio can be a useful shortcut for filtering companies by financial strength.
Be the first to comment