

solarseven
Introduction
The current market turmoil has fueled many different expert opinions about what investors should do. Jeremy Grantham and Jim Rogers expect one of the worst bear markets ever. Some say to buy stocks – the market is bottoming. Technical analysts and market timers tell us what levels signal downside or upside ahead. Some adhere to the traditional 60-40 stock/bond mix. Others tell us to hide out in defensive stocks and inflation hedges like commodities. Some say to ditch bonds due to inflation and rising rates. What to do with all these opinions? Who will be correct?
Here I make a case to ignore the forecasts and hold an index-based, all-weather portfolio for the long run. We will look at the track record of the pros with market timing and tactical asset allocation, and why most don’t succeed. Two example all-weather portfolios demonstrate a better way. I’ll explain why I believe now is a particularly good time to adopt an all-weather portfolio. Finally, I’ll share my thoughts about a more nuanced approach for advanced and aggressive investors.
Market Timing is Challenging At Best, Destructive at Worst
I recommend against market timing. Watching and reading expert opinions on this can be interesting, but in my opinion isn’t a sound way to invest. Let’s look at the facts.
Here are a few key takeaways from my “How Market Timing Destroys Wealth:”
- Five of the seven bear markets since 1987 were very short, with a duration of 1-4 months.
- Six of the seven bears experienced sharp, double-digit declines over a mere five-day period. If you didn’t time your exit exactly right and held stocks during the worst five-day period, you would have incurred 40% of the entire bear market decline.
- Six of seven bears experienced one-day declines of more than 5%, with two experiencing double-digit one day declines. The 1987 bear included the granddaddy of them all on October 19th – down 20.5%.
- Market timers needed to be nimble and accurate during these events, as the market moved rapidly and violently in both directions.
Not only were there sharp drops over short time periods, many of the market’s strongest up days happened during and near the end of bear markets. Fidelity’s research shows the dramatic negative impact of not being invested during the market’s best days.
Fidelity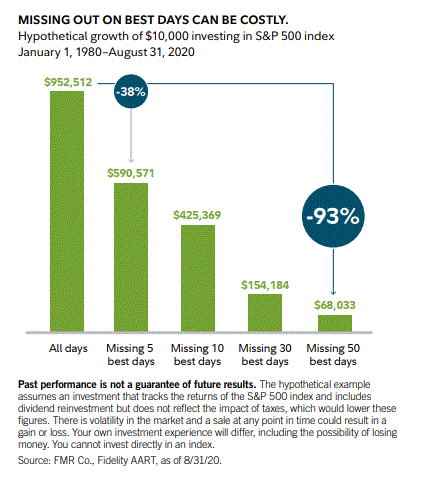
If you had invested $10,000 and missed only the five best return days for the S&P 500 during the 40 year period of 1980-2020, you would have missed out on a whopping 38% of the total return. That is an astounding $361,941 difference in wealth accumulation.
But what about the pros’ market timing performance? “Investment Policy,” by Charles Ellis, referenced a study of 100 pension funds:
“…their experience with market timing found that while all the funds had engaged in at least some market timing, not one of the funds had improved its rate of return. In fact, 89 of the 100 lost as a result of timing and their losses averaged a daunting 4.5% over the five-year period.”
Then there are market timing experts. Wim Antoons’ paper, Market Timing: Opportunities and Risk, cited predictions from 68 market timing experts between 1999 and 2012. The majority (62%) were accurate less than 50% of the time. He also looked at 6,582 forecasts between 2005 and 2012 and found that after transaction costs, no single market timer was able to make money.
Even The Pros Aren’t Good At Tactical Asset Allocation
Many “experts” tell us what economic scenario will unfold and which asset classes will be best. But what do the data show about the track record of the pros in shifting in and out of asset classes? First, a definition. Vanguard’s paper, “A Primer on Tactical Asset Allocation Strategy Evaluation” defined tactical asset allocation:
“Tactical asset allocation (TAA) is a dynamic strategy that actively adjusts a portfolio’s strategic asset allocation (SAA) based on short-term market forecasts. Its objective is to systematically exploit inefficiencies or temporary imbalances in equilibrium values among different asset or sub-asset classes.”
The paper showed that during the period 1995-2009, their sample of 24 professionally managed U.S. stock/bond TAA mutual funds added 8 basis points a month of excess return (vs. a traditional U.S. 60-40 portfolio), before investment management fees. That’s roughly 1% per year of alpha. However, if you consider fees and taxes, you get a different picture. According to the Journal of Index Investing, average fees for these types of funds are currently 1.39% per year, which puts the funds under water relative to the 60-40. And turnover for these funds was a whopping 289% per year. That generates taxes, further degrading performance.
The Journal study concluded:
“TAA funds on average had about 49% of their assets in U.S. equity, about 33% in bonds, about 15% in foreign equities, about 8% in foreign bonds and about 13% in cash. Tactical allocation mutual funds underperformed all benchmark indexes and had lower absolute and risk-adjusted performance from January 1994 to October 2016. Investors would have been better off with passively managed funds that followed benchmark indexes.”
The weight of the evidence above suggests investors would be best off not to shift in and out of asset classes based on forecasts. Like a sailor, you just don’t know when or where the next storm will hit.
Yet, as the examples below demonstrate, investors will benefit from maintaining long-term positions in many different and uncorrelated asset classes, regardless of market conditions. Once that is in place, we can follow the wisdom of the late John Bogle: “Don’t do something, just stand there!”
Why The Pros Can’t Consistently Pick The Best Asset Classes
Common Thinking About Financial Conditions and Asset Class Performance
The chart below shows various scenarios and which asset classes tend to perform well. Much of this is commonly cited by financial market strategists.
Author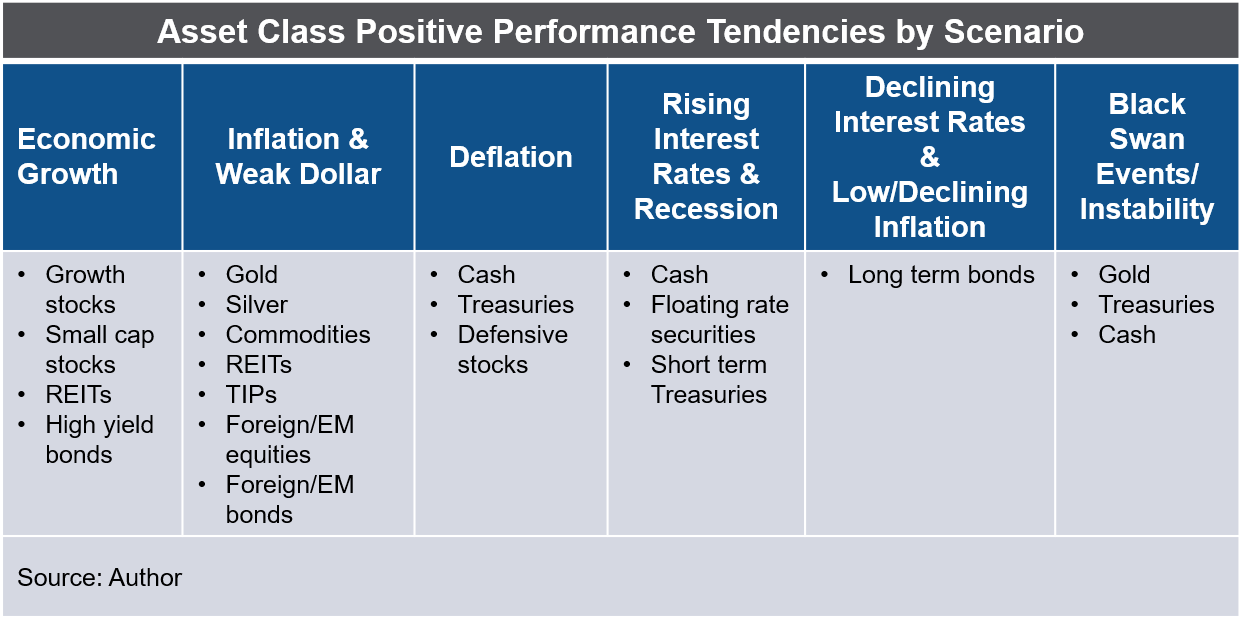
These are tendencies, but there are no absolutes. The situation is complicated. Results usually depend on several factors in combination, not the least of which is investor sentiment. And the latter sometimes defies financial market logic.
The most dominant forces to consider are economic growth and inflation. The chart below depicts four combinations of those factors and which assets they tend to favor.
Author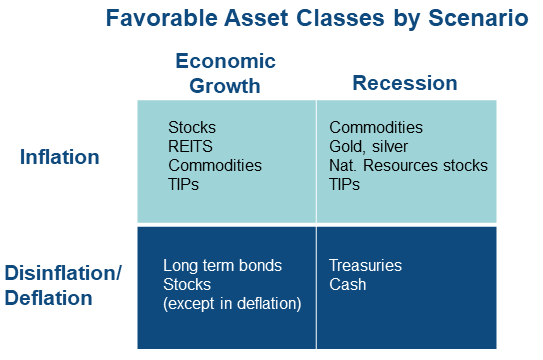
Asset Class Behavior Is Often Unpredictable
These guidelines have limitations in portfolio application. Economic scenarios ebb and flow through cycles. And it’s notoriously difficult to time them. Even worse, investors can be right predicting a financial scenario, but wrong about which assets benefit. Sometimes the asset class doesn’t follow the script.
For example, many rely on gold as an inflation hedge. The metal surged to $2070 in the summer of 2020, but recently traded under $1750, despite surging and persistent inflation.
In the early 2000’s, commodities were touted as having negative correlation to equities. That was the case for the previous several decades. Therefore they should serve as excellent portfolio diversifiers. Among other institutional fans, Harvard’s endowment took commodities from 6% of its portfolio in 2000 to 18% in 2008 – just before they crashed. The iShares S&P GSCI Commodity-Indexed Trust (GSG) dropped along with the market, down 70% between July 2008 and February 2009.
TIP, the popular inflation-protected ETF is down 8.6% YTD. This was largely due to the rise in real interest rates, which more than offset the effects of surging inflation.
To be sure, asset class performance varies year to year. Performance cycles often run for 5-10 years. The “periodic table” of asset classes below demonstrates the constant shifting of leaders and laggards over time.
BlackRock Investment Institute, data from Refinitiv, June 2022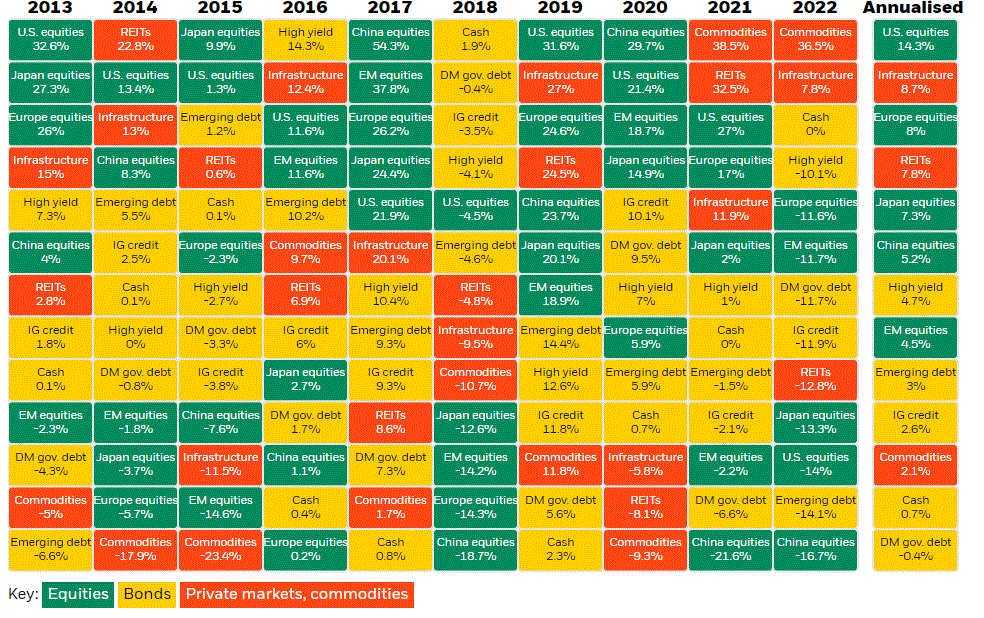
No wonder even the top-paid professionals, supported by hordes of research teams armed with powerful analytics can’t consistently forecast the best asset classes. If they can’t, can we?
Two Well-Performing All-Weather Portfolios
Rather than trying to time the market or forecast asset class performance, there is a more reliable way to invest: the all-weather portfolio. There are many viable all-weather portfolios that suit a range of investor goals and risk-reward preferences. To demonstrate, I chose two simple portfolios below from a list of lazy portfolios.
lazyportfolioetf.com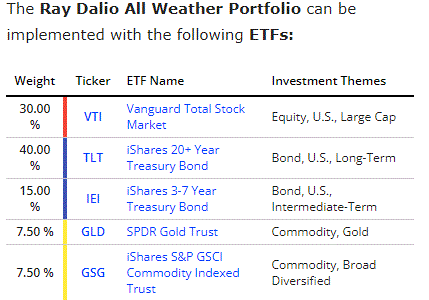
lazyportfolioetf.com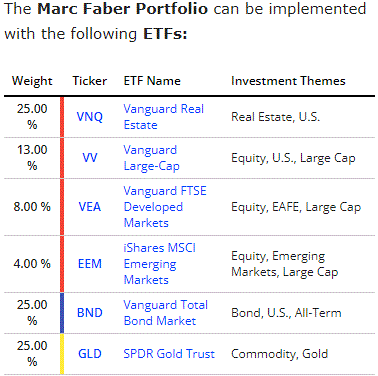
These are both index-based and diversified across major asset classes. A key element is that these portfolios have components with low or negative correlations. This reduces variability and drawdowns. The commodity component has been particularly useful during this year’s inflation surge.
All-Weather Portfolios Compete Well Against the 60-40 While Limiting Drawdowns
The table below shows performance data spanning the past 25 years. This includes the bear markets of 2000-2002, 2008-2009, the short pandemic bear of 2020 and the current market break. It also includes the lost decade of 2000-2009 and the post GFC bull market of 2009-2020. Hence, it provides a good gauge of performance during various market weather conditions.
Author, lazyportfolioetf.com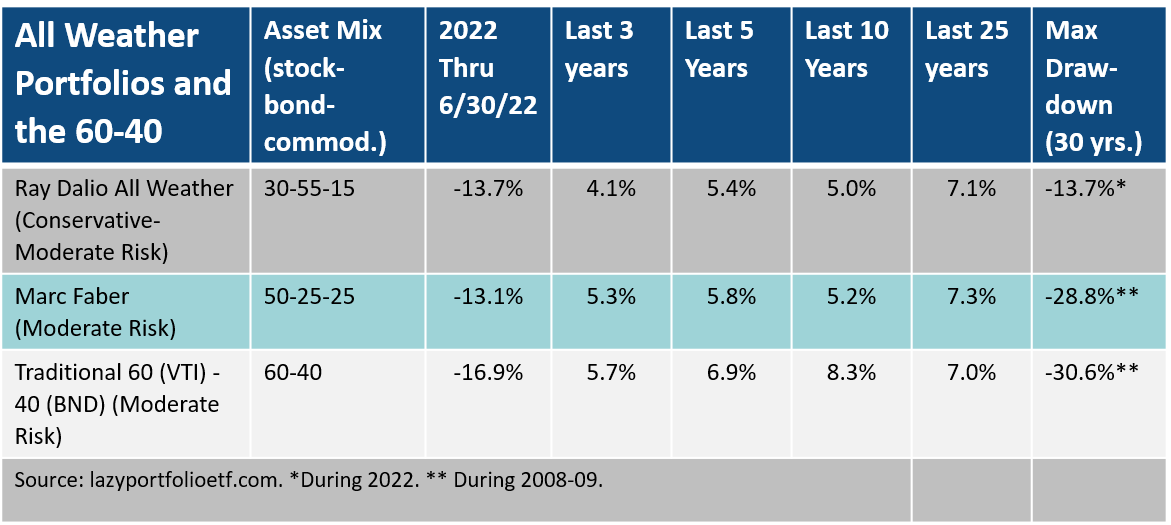
The Ray Dalio Portfolio Competes Well Versus the 60-40, With Less Risk and Better Diversification
The Ray Dalio portfolio has a lower equity allocation than the 60-40 and less risk. Yet it gained 7.1% per year. over the past 25 years, edging the 60-40 return of 7.0% per year. And its maximum drawdown was only -13.7% (this year!) versus -30.6% for the 60-40. In this year’s bear market it has outperformed, with a YTD return of -13.7% versus -16.9% for the 60-40. Both have been hurt by a combination of poor equity and bond returns. However the Dalio portfolio benefitted from its gold and commodity positions. It’s notable that earlier this year Dalio dissed bonds. If he is correct, this will not be as effective a portfolio going forward.
lazyportfolioetf.com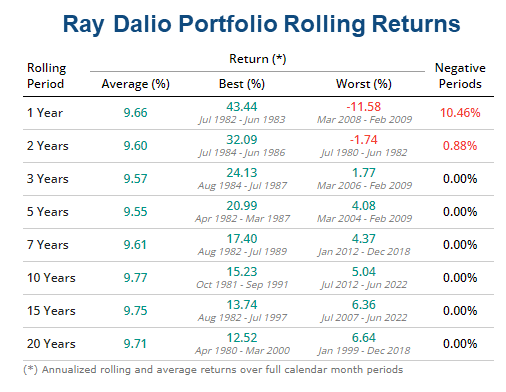
Since 1987 the Ray Dalio portfolio never had a negative return for a period of three or more years and only 10.46% of one-year periods had negative returns. Average annual returns for 1-20 year periods were very consistent, ranging from 9.55% to 9.77%.
The Marc Faber Portfolio Has Also Performed Well Relative to the Traditional 60-40 Portfolio
The Marc Faber portfolio holds 50% stocks, 25% bonds and 25% gold. This makes it comparable to the traditional 60-40 in terms of overall risk (since gold can be considered a risk asset). The portfolio gained 7.3% per year over the past 25 years, ahead of the 7.0% return for the 60-40. And its maximum drawdown in 2008-09 was 28.8% versus the 30.6% drop for the 60-40. This was largely due to the positive performance of gold. YTD the portfolio has also outperformed the 60-40 with a return of -13.1% versus -16.9%.
lazyportfolioetf.com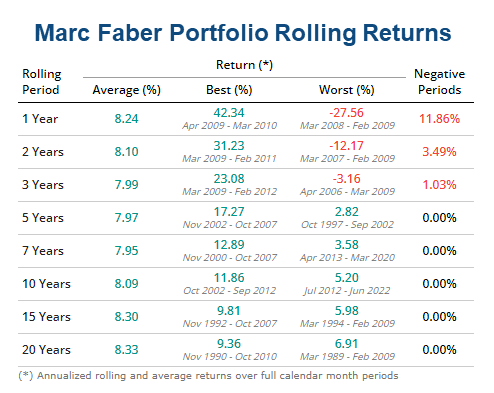
Since 1987 the Marc Faber portfolio never had a negative return for a period of five or more years and only 11.86% of one-year periods had negative returns. Average annual returns for 1-20 year periods were 7.95% – 8.33%.
These are rather simple, elegant portfolios that are easy to implement. However, none are fully diversified in my view. They aren’t meant to be recommendations. Rather they demonstrate the power of an all-weather portfolio in helping patient investors stay the course and achieve solid risk-adjusted returns.
Why Adopt An All-weather Portfolio Right Now
Weak Stock and Bond Return Prospects Ahead
In What Might John Bogle Expect From Today’s Market, I calculated a nominal return range of 1%-6.4%/yr. for the S&P 500 index over the coming decade. Another way to gauge potential returns is via the Shiller CAPE ratio, currently at 30 for the S&P 500. Shiller’s data since 1871 shows that level has been associated with forward ten-year average real equity returns of only 0.9% per year. And similar periods were often associated with nasty bear markets, such as those following the 2000 and 2007 peaks.
Many are comparing current markets to the 1970s. During the stagflationary period of 1970-1979, the S&P 500 and 10-year Treasuries returned 5.9% and 5.5% per year, respectively. A simple 60-40 portfolio returned 5.7% per year. That doesn’t sound bad until you factor in annual inflation of 7.2%, resulting in a real return of -1.5% per year.
Historically high bond valuations coupled with high and uncertain levels of inflation also signal weak bond returns. Bond yields are a good forecaster. If we use today’s BND ETF yield of 3.4% and combine that with U.S. equity returns of say 4% per year, the 60-40 portfolio would generate an annualized return of only 3.76% per year over the coming decade. And if inflation continues to run hot, 60-40 investors could easily face negative real returns.
The Need for Uncorrelated Assets
Over most of the past 20+ years, stocks and bonds were negatively correlated, such that the 60-40 portfolio provided good diversification during bear markets. However, the chart below shows this has not always been the case.
“Equity-Bond Correlation: A Historical Perspective, 2017, Graham Capital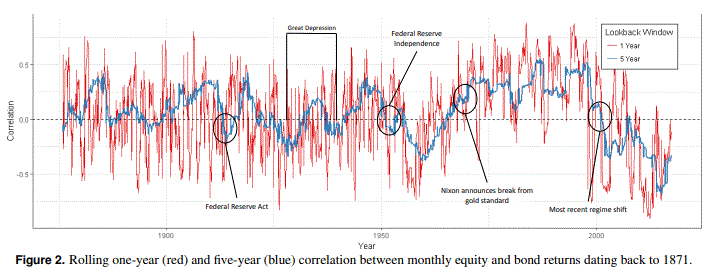
From 1960-2000 the two were positively correlated. In the Great Depression era correlations shifted between positive and negative. So far this year, the two have been positively correlated, hurting investors with more traditional portfolios. This also damaged the performance of the two example all-weather portfolios this year. As a result, it’s very possible those portfolios may not be as effective over the coming decade as in the past 20 years.
That’s why I believe it is vital to own other non-correlated assets. This can include commodities, including gold and silver. Also useful are attractively valued foreign equities and bonds, which provide currency diversification. Other real assets such as MLPs and REITs can also be effective.
An All-Weather Portfolio Helps Investors Ride Out Market Storms
Based on my 35+ years of investing, I believe a critical element of investing success is avoiding significant losses and adhering to a consistent approach over time. Those who have accumulated hard-earned wealth over many decades and even younger investors who benefitted from the post-Great Financial Crisis recovery will appreciate this.
An all-weather portfolio limits drawdowns. YTD through June 30, the Vanguard Total Market Index Fund (VTI) was down 21.3%. Certainly anyone with significant equity exposure has faced considerable stress. This can lead to bad decisions. I learned this lesson back in 1987 after the flash crash recovery.
The data showing the underperformance of mutual fund holders versus the funds they own demonstrates that many buy high and sell low. Indeed, Warren Buffet noted:
“The most important quality for an investor is temperament, not intellect.”
Given today’s U.S. valuations and extraordinary financial conditions, we are likely entering a highly challenging era for financial markets. Already this decade the market has experienced two selloffs – the 34% drop during the pandemic onset and this year’s 22% drop. These are times when an all-weather portfolio is particularly effective. It is as much a strategy decision as it is a behavioral support mechanism.
A More Nuanced Approach
Many investors won’t be comfortable adopting these example portfolios, especially those who are more aggressive. That’s why the approach can and should be customized according to investors’ ability, need and willingness to take risk. It can also be refined to include more asset classes with customized weights based on investors’ risk-reward preferences.
For the past several years on SeekingAlpha, I have described why I believe the financial markets are in an unprecedented and highly risky state. Therefore my own all-weather portfolio tilts allocations towards asset classes that are likely to protect against the most damaging scenarios. This approach may not suit all investors, but supports my investing goals which are conservative and emphasize wealth preservation. But as I acknowledged above, no one knows what the climate will be going forward, so I also hold assets that are likely to do well in a variety of conditions, including rosy ones. To better diversify, I also utilize additional asset classes not shown in these examples.
In my next SeekingAlpha article submission, I will share my all-weather portfolio and the rationale behind it. If you haven’t already, please consider following me to be notified when that is published.
Conclusion
Market timing can be destructive to your wealth. It is extremely difficult to forecast economic conditions, investor sentiment and the resulting performance of asset classes. Adopting an all-weather portfolio and maintaining constant allocations avoids these challenges. They are time-tested and perform well in many different market conditions. Perhaps most importantly, they allow investors to sleep well at night, lowering the urge to make rash exits near market bottoms.
Be the first to comment