


Mohammed Haneefa Nizamudeen/iStock via Getty Images
Investment Summary
From the Portfolio Manager’s Desk
What a difference a few months makes. Not only on the asset level, but at the macro level as well. Equity strategies continue to be hammered in FY22 with long only managers taking the brunt of the pain. Low beta and quality strategies continue to outshine, whilst balanced portfolios with a commodities and alternatives weighting have hedged equity risk well this YTD. The following charts are from a macro-composite we formed in 2022 and display things nicely, and relate back to our investment thesis on SeaSpine Holdings Corporation (NASDAQ:NASDAQ:SPNE). Follow on.
It was only a few weeks ago when we noted the valuation spread enjoyed by value strategies had once again returned. However, with a wind-down of Treasury yields, long-duration growth has regained some upside premium from the June roll-down over value, which starts to raise some questions.
Exhibit 1.
S&P 500 Value (blue) vs. S&P 500 growth (red). Short-term upside premium has returned for long-duration growth in equities as UST yields wind back
Could the situation be reversing again? Risk-appetite appears to be creeping higher rolling into July. Orange zone represents growth premium, blue value.
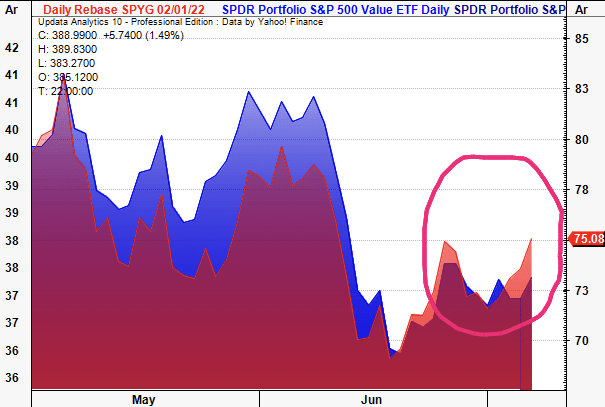
Image: HB Insights. Data: Updata Analytics
Meanwhile, nonfarm payrolls rose 327,000 in June versus an expected 270,000 as the Labour Department reported today. The 3-month moving average of private sector gains is also 362,000. The 21% variance in nonfarms adds fuel to a hawkish Fed and almost certainly ensures a 50–75bps hiking trajectory, by estimate. The probability of distributions for the economy includes a Fed overshoot, but either way, its the fear of recession that will drive equity markets in the medium-term, we argue.
Exhibit 2.
The pullback in yields confirms the spike in growth and pushes back against the rates story
The high-duration of these equities makes them snap-back equally as hard on the upside when there’s a pullback in yields. The sensitivity of duration to yields in growth could confirm this reversal.

Image: HB Insights. Data: Updata Analytics
Further evidence of this is seen in a wind-down in the short growth trade in June. See how 1x inverse ETFs and the SARKK ETF have formed lower-lows since peaking in June. SARKK has also lost relative strength relative to the S&P 500, and continues to do so as seen below, implying relative strength in growth vs. the benchmark.
Exhibit 3.
Short growth has been an effective equity hedge this year that remains ITM. However, it looks toppish and may be weakening.
The difference now is that retail liquidity has been swept up across many pockets of the market, leaving allocators plenty of safety margin to play with
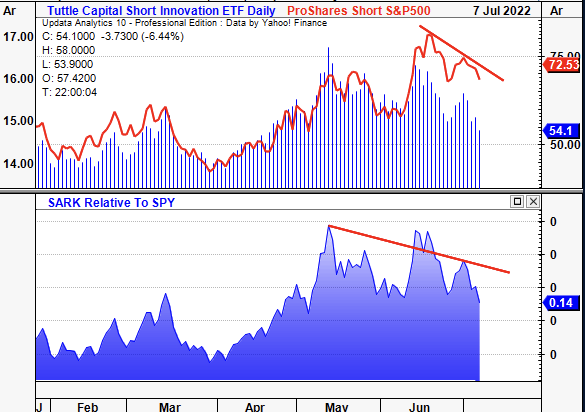
Data & Image: Updata Analytics
The resources trade (oil, gas, metals etc.) looks to have exhausted itself with both Copper futures (Sep 22) and Brent Crude both busting through long-term uptrends in May/June. Both are key indicators for industrial pricing activity and look to have peaked in March. Also tracking lower are US TIPS with the market now pricing these at May 2019 levels. TIPS started the leg down at exactly the same time Brent Crude and copper futures peaked and have been on the descent since, seen in Exhibit 4. What’s this say for inflation expectations and actuals? Moreover, what’s this say about how the market is viewing inflation risk vs. recession risk?
A cooling off in these three instruments could signal a cooling off in the distribution of inflation outcomes. US 5y5y breakevens have consolidated to 2.53% whereas the 5y5y fwd inflation expectation rate has tightened to just 2%, in line with longer term averages. However, this creates a dilemma for investors. Every ~50bps tightening from central banks reduces inflation risk, but increases the risk of us heading into a recessionary environment, by estimate.
Exhibit 4.
Copper and Brent Crude breaking trend having peaked in March. Both are key indicators of industrial pricing activity and this creates a more benign pricing environment.
The confluence of downside with US TIPS suggests market pundits are pricing in lower inflation risk/expectations.
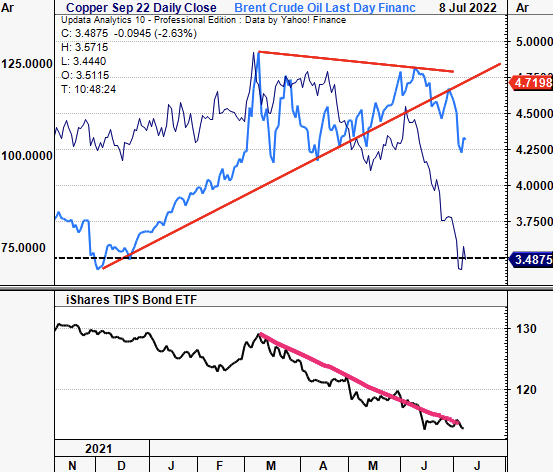
Image: HB Insights. Data: Updata Analytics
We’re seeing investors increasingly price in the risk of an economic downturn in the near-term. Firstly, the stock/bond correlation looks to have rolled over and reversed trend. US Treasuries have also caught a bid at the long end and bounced from June lows, diverging from US TIPS in doing so (Exhibit 5). Investors are adding back duration into portfolios and stepping up in quality and liquidity. ETFs tracking UST’s offering the liquidity have bounced as a representation of this. The case for adding bond duration into portfolios is increasing as the probability of systemic default increases in the near-term. Not to mention core bond funds offer yields of 4.5–5% right now.
Exhibit 5.
Inflows into the long-end of the curve suggest investors believe investment returns will be better out into the future versus in the near-term.
It says to us the market is increasingly pricing in recession risk over inflation risk by adding duration back into portfolios.
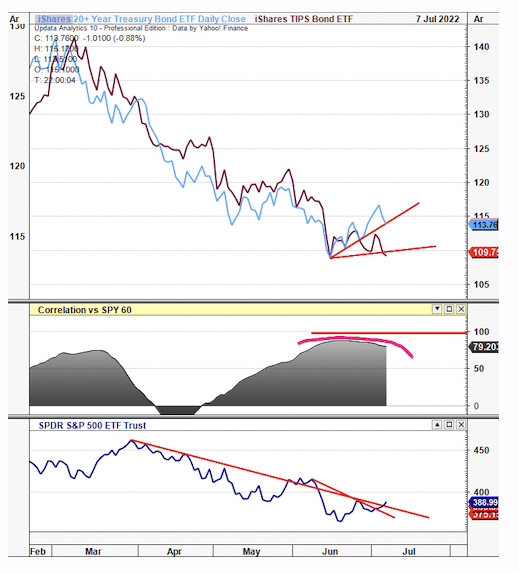
Image: HB Insights. Data: Updata Analytics
The case for adding equity duration is less robust and needs more data first. Whilst there’s been a tilt back towards profitable growth these past few weeks, the high-beta trade is still compressed in H2 FY22. Alas, alternatives continue to offer meaningful forward-looking upside and an uncorrelated source of equity return. Managed futures and other CTA’s in particular are high in relative strength compared to the benchmark. That trade is in small consolidation but is testing support and will prove to be a sure test for alternatives as a weighting in diversified portfolios.
Exhibit 6.
Alternatives (CTA’s in particular) remain high in relative strength against the benchmark.
Managed futures strategies testing support level and will bid higher if drawing buyers at these levels

Image: HB Insights. Data: Updata Analytics
Exhibit 7.
As long as low-equity beta continues to offer risk-adjusted alpha then the case for adding equity duration continues to remain weak
Low beta alternatives have immunized portfolios against equity drawdown
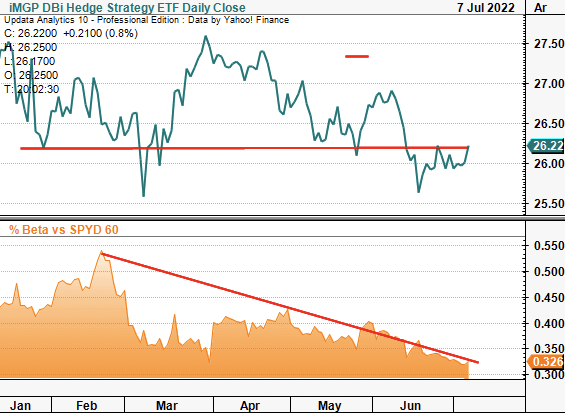
Image: HB Insights. Data: Updata Analytics
Investment Thesis Summary
With this backdrop we can turn to our thesis on SeaSpine Holdings Corporation (NASDAQ:SPNE) and demonstrate why it fails to justify its inclusion into equity focused and cross-asset portfolios. SPNE possesses the kind of fundamental and statistical characteristics we are agnostic too in this current investment landscape. Factors like unprofitability, widening sales/operating income mix and other undesirables leave us neutral on the name. We price SPNE at $4.58 per share and suggest there are more opportunistic names within the spinal medtech space.
Exhibit 8.
SPNE 12-month price action

Image: HB Insights. Data: Updata Analytics
All the factors we aren’t searching for
We’ve taken a hard data approach to demonstrate the case here because, let’s face it – companies can only lose money for so long before investors suspend belief on the qualitative growth narrative. When the cost of capital was low (i.e., the past 10-years) unprofitable names could get away with it but as liquidity dries up we’re seeing the weakness in these names really come through. SPNE for instance has been softening against the SPX since September last year all whilst its correlation structure has been shifting upwards.
SPNE has also been losing strength against the S&P 500 whilst the benchmark itself has been incurring heavy losses. It is a high beta, low quality play that contrasts directly to our global investment strategy. As seen in Exhibit 9., the SPNE share price drifted off its high, whilst its volatility become more highly-correlated to the market. In a bull market this would be a good thing as the stock’s drivers would include this momentum. However, tightening correlations are rough in these markets, as seen in the run down in share price.
Exhibit 9.
SPNE improving in relative strenght vs. the benchmark
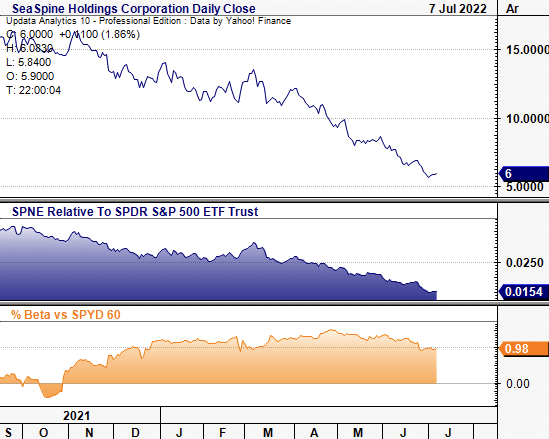
Image: HB Insights. Data: Updata Analytics
It’s not just the market data that should guide positioning in SPNE. The company’s fundamentals have been weakening for several periods. Last two years, on a quarterly basis, sales have grown at CAGR 8.5% to $51 million last quarter. Unfortunately, SPNE expects another $60 million in FCF burn in FY22 with $40 million allocated towards spinal implant inventory as previously mentioned. Hence more operating losses are expected adding to a series of losses at the operating margin.
Investors aren’t paying for this kind of forward-looking P&L mix. Whilst there’s been a very short-term strength of growth stocks the trend remains overwhelmingly tilted towards profitability and ‘quality’ factors. As investors continue to move up in quality these traits become more attractive leading to sustainable, long-term momentum. Effectively, investors are rewarding bottom-line fundamentals over top-line growth, a poor outlook for SPNE, as seen in Exhibit 10., the company’s two-year operating history.
Exhibit 10.
SPNE’s operating performance isn’t the picture investors are paying a premium for right now
Operating Losses and negative FCF margin continue

Image: HB Insights.
As a result of these losses operating leverage has normalised to -1.4x in the past two years. We’d be searching for positive operating leverage here to demonstrate SPNE’s ability to feed cash down to the bottom line. Unfortunately it fails the litmus test here and this could perhaps explain its sloppy return on capital summary as seen in Exhibit 12. Nonetheless, this degree of operating leverage is a risk to profitability and our outlined strategy.
Exhibit 11.
Operating leverage struggling suggesting further headwinds ahead
Explains much of the operating losses as the company continues to innovate and build out its inventory. It spent ~12.5% of sales on R&D last period.

Image: HB Insights.
Management guided to a $40 million investment in its spinal implant segment this year, with a higher mix towards the inventory side versus CAPEX. This is concerning to us. When the company spun-out seven years ago, more than 75% of its revenue mix was from products eight years or older. Fast forward and SPNE’s portfolio is vastly different today. Now, ~90% of products are obviously seven years or less old, meaning there’s been a number of new launches in that time.
However, in that same timeframe, SPNE’s harvested nil return on capital and has printed a series of losses instead. ROIC came in at -19% in Q1 FY22 whereas ROA was -11%, each below 3-year quarterly averages. Both have normalised at -16% and -20% over five years respectively. ROIC and ROA have been cyclical albeit negative these past two years also. This lack of profitability adds a bearish tilt to the risk/reward calculus. Moreover, SPNE’s projections on generating a return on invested capital are murky. Per CFO John Bostjanic on the last earnings call, regarding SPNE’s outlook on new product launches:
And we’re just going to continue to cannibalize the legacy products and grow and take market share with the new products and also convert the surgeons still using the legacy products to those with better features and benefits and help ourselves become more efficient, less complex, supply chain so that we’re managing fewer systems, but also making sure that surgeons have the best and most current products in hand to take care of their patients with.
Exhibit 12.
Below average ROIC / ROA at the last print needs to lift to overcome increasing cost of capital
Companies will no longer get away with unprofitability if prevailing trends continue, by estimation.
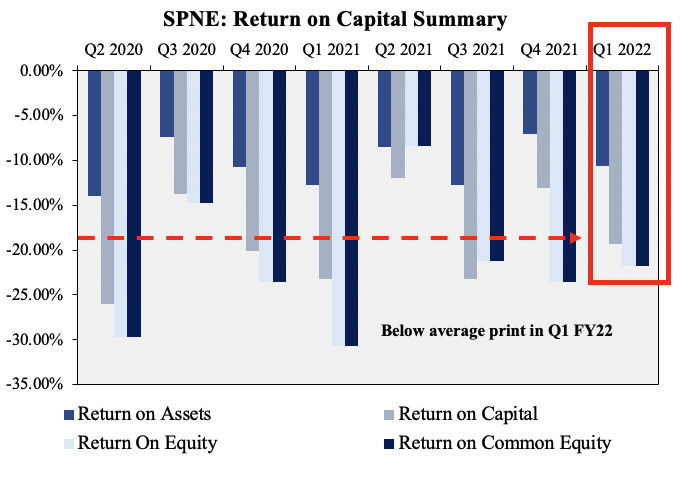
Image: HB Insights.
This is despite maintaining a reasonably healthy credit profile these past two years as well. At present, the capital structure is tilted towards equity holders, which means SPNE could head to the high-yield debt markets if needing to raise capital, or complete dilutive equity raises for the same.
Exhibit 13.
SPNE has managed liabilities and other balance sheet sections welk
SPNE Credit Summary, Q2 FY20–Q2 FY22
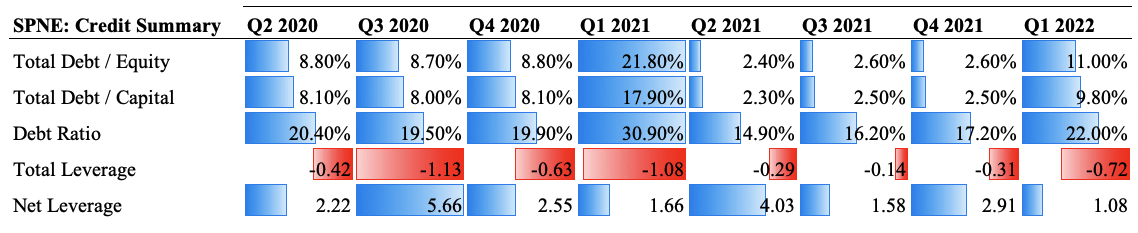
Image: HB Insights, Data: HB Insights, SPNE SEC Filigns
Findings show SPNE’s reduced/improved its cash conversion cycle by around 82 days from Q2 FY20–Q1FY22′. This was driven by an 88 day reduction in days inventory outstanding in that period suggesting better efficiency and a higher pace of sales. However, removing the anomaly of Covid-19 in Q2 FY20, cash conversion was in-line with longer-term averages.
This could change during the back end of FY22 due to the ~$40 million planned spend on inventory in spinal implant inventory. It plans to build up inventory to support revenue growth after aggressively upping the cadence of spinal implant sets. However, it also moved from alpha to beta testing in its FLASH system and hopes to launch it later this year. As it continues to put units from alpha to beta into launch there’s chance inventory spend will remain high. As it starts to recognise revenue from placements of the FLASH system it must ramp up inventory volume to support this further. Hence it must unload a great deal of inventory in the next 12–24 months to keep up the pace of cash conversion, by estimate.
Exhibit 14.
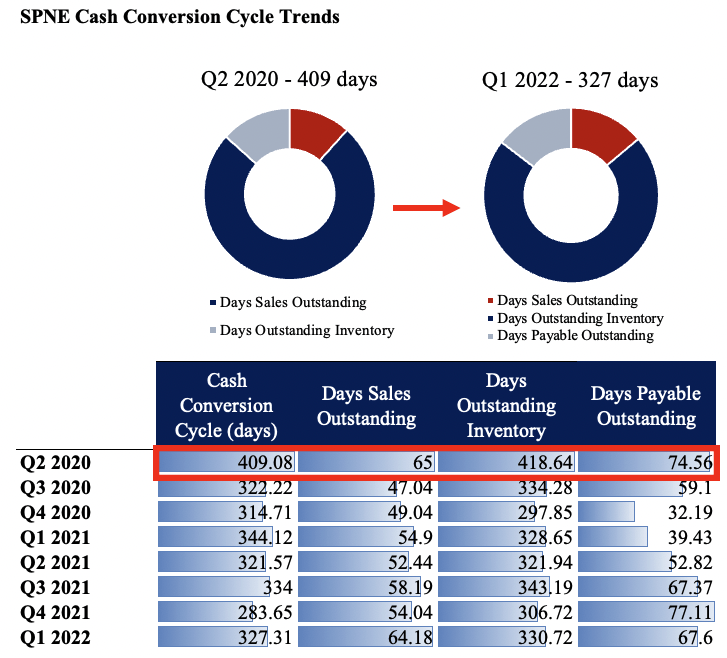
Image & Data: HB Insights
Valuation
SPNE’s lack of profitability immediately shines through on valuation. Shares are trading at ~1x sales and 0.75x book value, below the sector median’s ~5x and ~2.2 respectively. But what are we valuing here? A 7.5% 5-year average sales growth? That doesn’t even constitute a growth play. We’ve forecasted 20% and 10% at the top for FY22 and FY23 respectively, and still, this is meaningless in our strategy. We’re focusing on bottom line fundamentals and we have nothing tangible to grasp onto here. Plus, given the stock’s ~68% loss these past 12 months it’s no wonder to see such a de-rating in these multiples. So it’s less of a product of fundamental/earnings momentum and more a function of market sentiment. The question really is, can it re-rate on a combination of pricing and fundamental strength?
Part of our valuation composite is made up of what we call tangible value flow (defined at FCF/share and EPS). Using this as a benchmark to valuation, and the downside case increases. Investors have realised a substantial loss in realised value to the tune of $144 per share incrementally from Q3 FY19 to date. Add in our FY22 forecasts and the incremental loss in value widens to $187. If investors are prioritising bottom-line fundamentals as we say, then the answer to the question above is no, it can’t re-rate by estimation.
Exhibit 15.
Investors have realised an ongoing loss of tangible value flow these past few years.
Trends look set to continue as well offering no upside relief in the trade

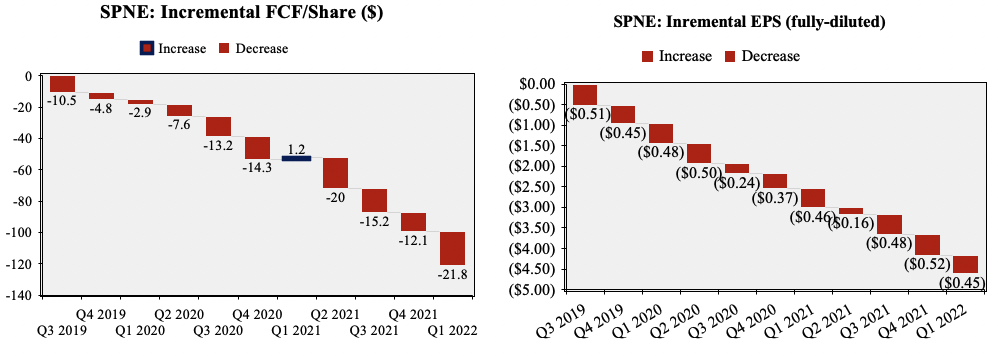
Image: HB Insights.
Using Enterprise Value to factor in SPNE’s $83 million in total liabilities on TTM values and we’ve priced SPNE at just 0.75x FWD sales. This is $4.75 on FY22 sales and $4.66 on FY23 sales discounted at 12.5%. We’ve priced SPNE at $4.58 based on a composite of inputs, including technical price targets discussed below.
Technical Studies
Point & figure targets corroborate our forward valuation with multiple downside targets ranging from $6.10 down to $4.35 at the lower bound. Numerous downside objectives have been confirmed and the price action is bearish from this chart. Each of the previous downthrusts have met our lower targets laying extra weight to the $4.35 objective.
Exhibit 16.
Multiple downside targets from with $4.35 objective yet to be respected.
Whereas $6.20 has been confirmed alongside a series of downside targets prior to this.
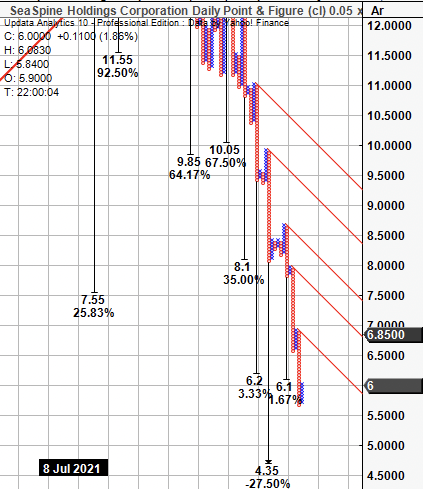
Image: HB Insights. Data: Updata Analytics
On a 7-month daily cloud chart, shares have been trading below cloud support for the past five months. The lag line is definitely bearish along with the price action. On balance volume has ticked lower since that time too, confirming the downtrend, whilst momentum is slow. The stock looks oversold at its current levels but the RSI looks to be more a function of price weakness than confluence of an entry point.
The gap between the cloud and prices has widened and sellers appear active at these levels as the order book is filled to on the sell side. Point is trend indicators continue to suggest further downside on the chart and that market sentiment is poor.
Exhibit 17.
Broke through the cloud in March and trended lower since. Divergence from cloud support as well with the lag line confirming the trend.
Other trend indicators signaling further downside is possible.
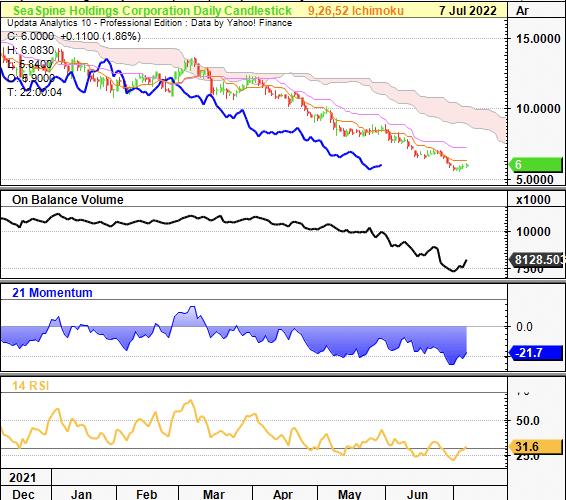
Image: HB Insights. Data: Updata Analytics
Shares have been mean reverting for the past 12 months and recently broke through the reversion channel in May. It now trades at the lower level of the descending channel and will be tested at ~$4.90, which we reckon it will fail at. Sellers will be unhappy holding below $5 with this name, by estimation. The upside risk is too defined and event-dependent.
Exhibit 19.
Broken through longer-term support channels
Now heading to floor of longer term support channel
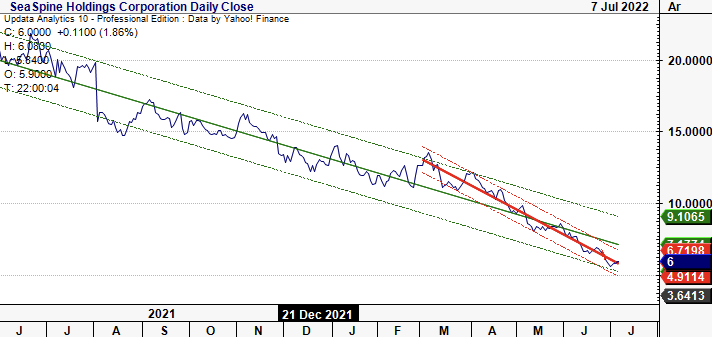
Image: HB Insights. Data: Updata Analytics
Positioning SPNE in long-only, equity focused portfolios
In the interests of weighting SPNE in a long-only, equity focused portfolio, it appears the stock fails the litmus test here too. Balanced portfolios have performed well in 2022 and look set to continue along this trend. The 60/40 is off to its worst half of the year in decades and is down ~20% YTD after both treasuries and the S&P 500 bounced off recent lows [drawdown 21%, return -21% YTD].
However, adding commodity and alternatives exposure on an equal weight basis saw a substantial uptick in sharpe and sortino measures whilst limiting drawdown to just 3.2% and standard deviation to 6.3% from Jan-June 2022. SPNE’s inclusion into the same setup as an equity allocation results in a substantially worse performance with drawdown of 13% and standard deviation of 12.7%. Moreso, it resulted in a Sharpe and Sortino ratio of -1.95 and -1.87 respectively. In other words, the expected return’s not worth the level of risk.
Exhibit 20.
Portfolio Statistical Summary

Data: HB Insights
In Short
SPNE lacks the convicting factors required to up-stand in the current macroeconomic climate. Cash flows are priced well out into the future, and there’s a lack of incremental value yet to be realised by shareholders. The uncertainty over these cash flows is high too given SPNE’s track record of printing losses of capital. That, and the macroeconomic landscape that’s leading to a very particular set of characteristics leading equity returns. The data is quite clear, and we could even be at a turning point if economic stats come in strong.
However, we aren’t so confident this will happen, and unprofitable, high beta names will flounder as investors step up in quality and liquidity by estimation. We’ve priced the shares at $4.58 and prefer other names in the medtech / spinal space, such as Globus Medical Inc (GMED) which we’ve covered here.
Be the first to comment