


Kameleon007/iStock via Getty Images
Over the past several quarters, the direction of real economic growth has been decidedly lower as the massive fiscal spending impulse wanes. Price pressure, however, has not yet peaked and is set to jump north of 8% once the March consumer price figures are released later in April.
In the sections below, I will update key economic data that was recently released from the employment report and the important ISM manufacturing report in the context of the continued (and intensifying) growth slowdown.
Lastly, I’ll offer some ideas about positioning your portfolio for the next part of this economic downturn.
Updates To Key Economic Data
The trend in economic growth is defined by the combination of employment, income, production, and consumption.
Whether we look at non-farm payrolls, real consumption, industrial production, or real income, the growth rate peaked in March or April of 2021 and has been cooling – slowly at first and now intensifying as forecasted by the leading indicators.
Using the Employment Situation report and the ISM manufacturing report, we can gather a comprehensive update on these trends.
Total employment growth edged slightly lower in March but has remained stable over the last 6-8 months.
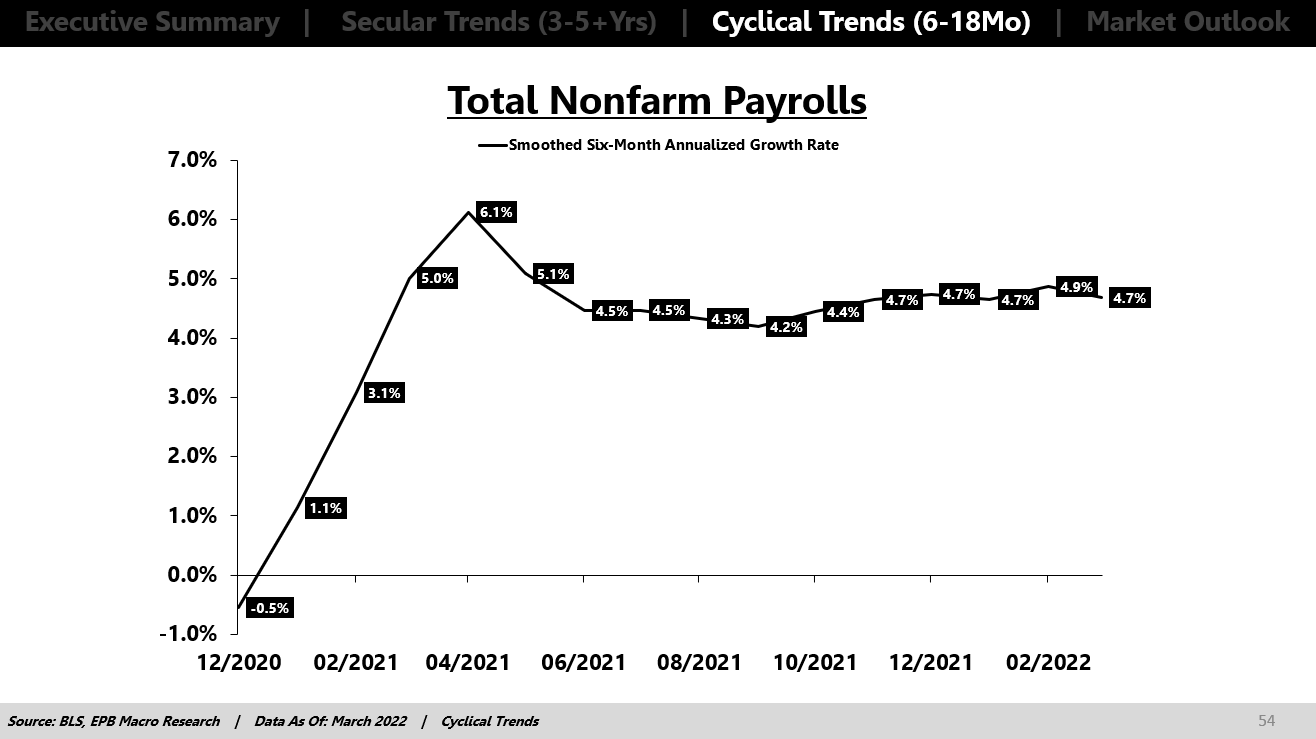
BLS, EPB Macro Research
Employment is the most lagging of the four coincident indicators (employment, income, consumption, production), so it’s not surprising to see the strongest trend in this corner of the economy.
There are more than 150 million payrolls in the United States, and most are concentrated in parts of the economy that are not highly cyclical. Job losses are rare, for example, in healthcare and education but can be severe in construction and manufacturing.
A cyclical read on the jobs market can be found through the 20 million payrolls in the cyclical sectors of the economy.
Construction and manufacturing payrolls growth remained flat at 3.9% but at a cyclical high.
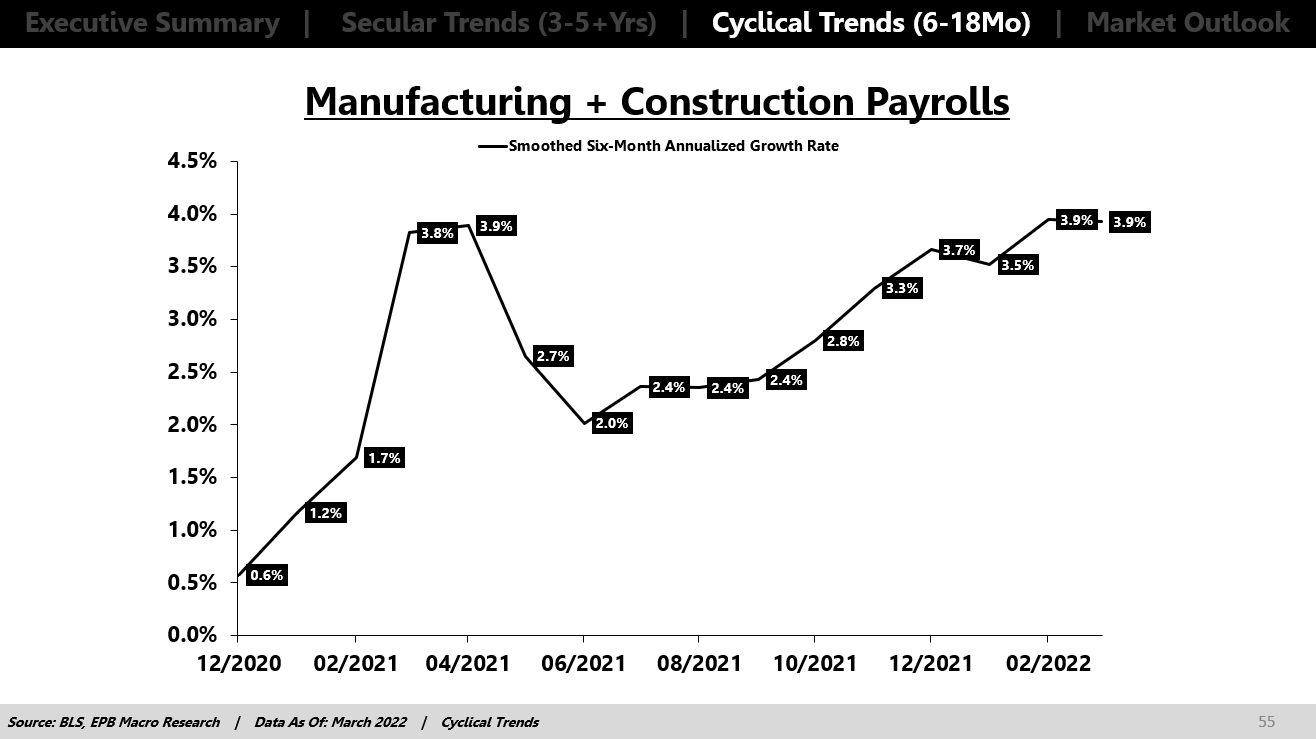
BLS, EPB Macro Research
Prior to the jobs report, I noted that cyclical jobs growth (construction + manufacturing) almost always declines sharply before recessionary periods so the continued strength in the growth rate of these payrolls means the economy is not yet at recession’s door despite the ongoing and intensifying slowdown in aggregate economic growth.
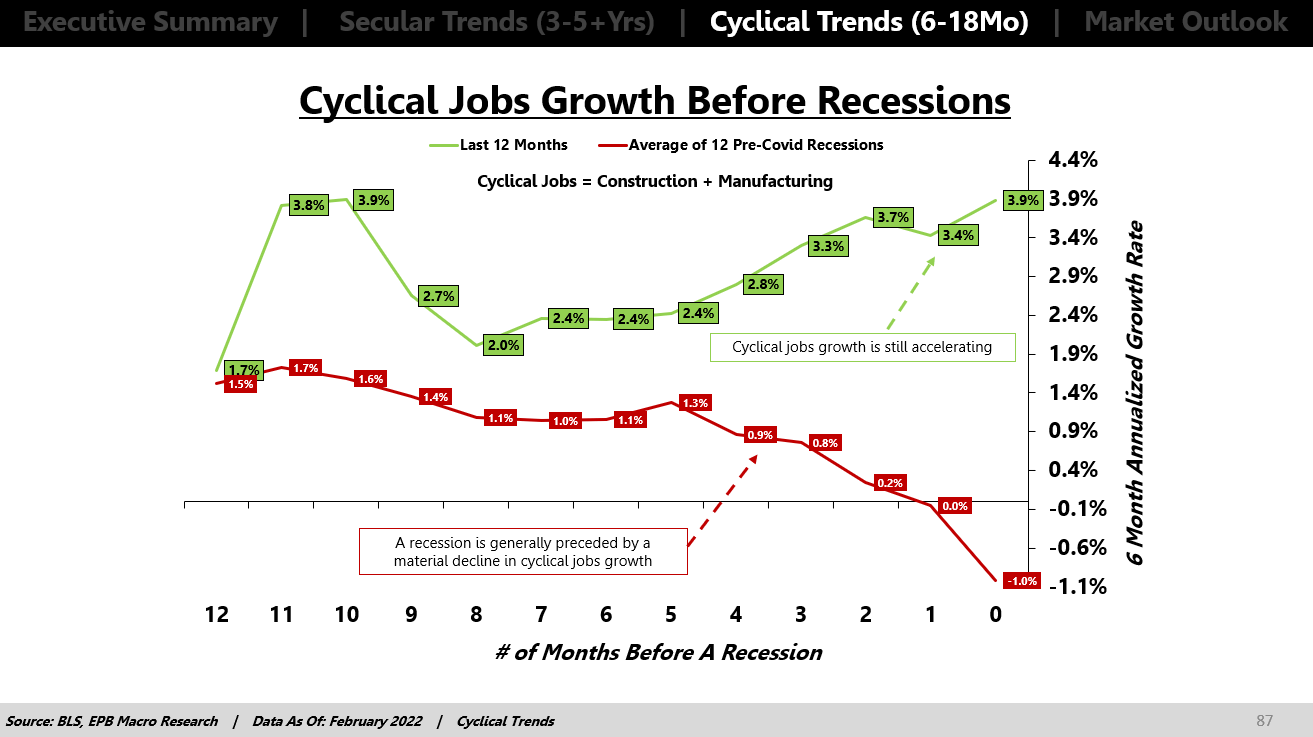
BLS, EPB Macro Research
Of note, however, is that residential building payrolls fell by 3,000 in March, and the growth rate dipped to 4.7%.
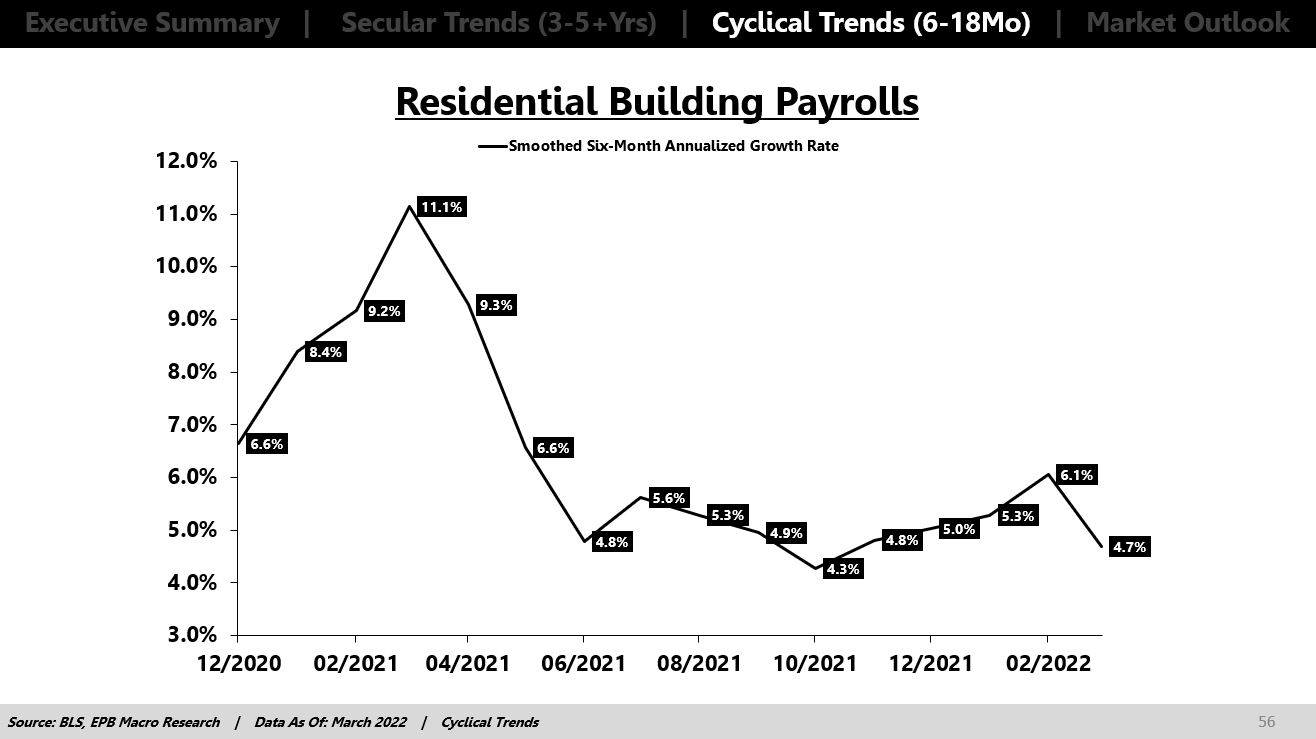
BLS, EPB Macro Research
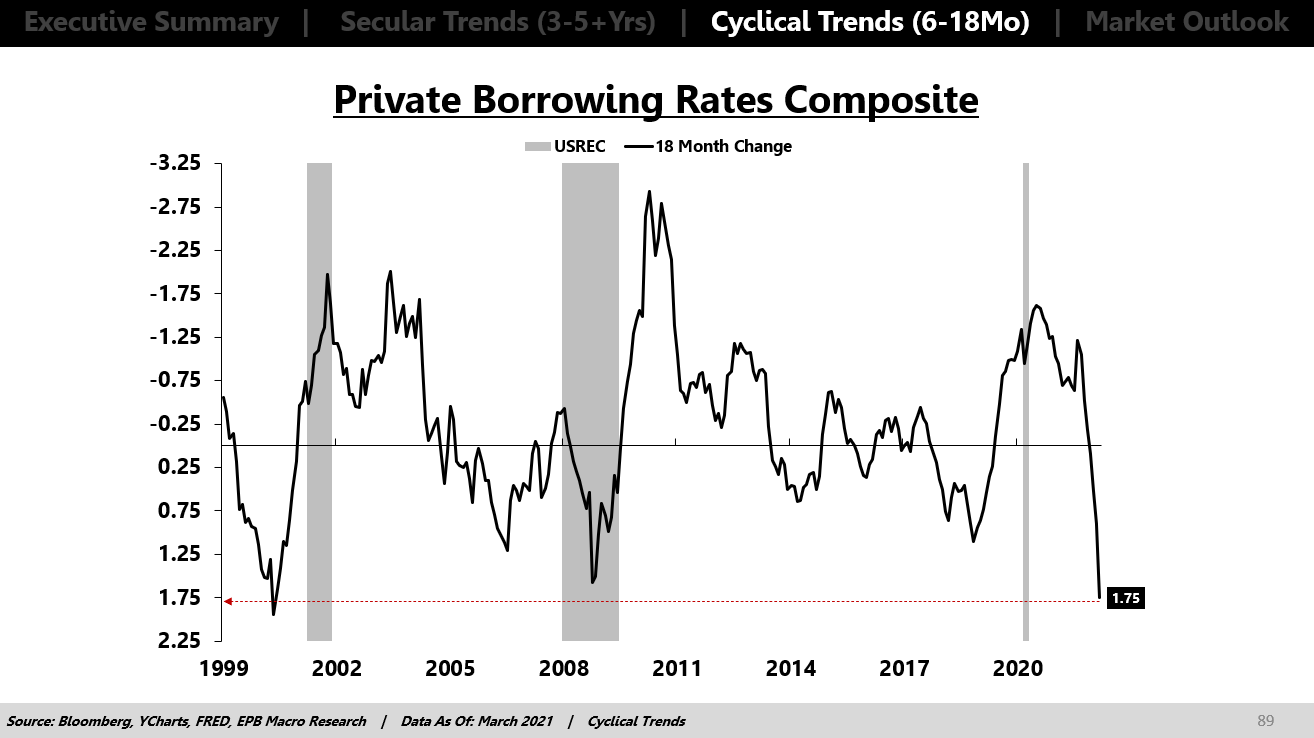
Residential building jobs are extremely cyclical. The housing market has been a major source of economic strength, but private borrowing rates, a composite of mortgage rates and corporate rates, have increased 1.75% in the last 18 months.
This surge in private interest rates is one of the largest over the last 30 years.
One indicator should never be used to forecast a recession, but the rate of change in private borrowing rates is a long leading indicator that informs us that slowing conditions are ahead.
Bloomberg, EPB Macro Research
We should pay close attention to all housing-related economic data and payrolls as the impact of higher private rates ripples through the economy over the next 3-6 months.
High wage numbers were touted after the employment report, but this surface-level analysis badly misses the true economic impact.
If wage growth was 20%, is that good?
You might say “yes,” but what if inflation was 40%? Of course, the 20% decline in real income is assuredly a bad sign for future economic growth, but mainstream analysis never puts the wage numbers in context.
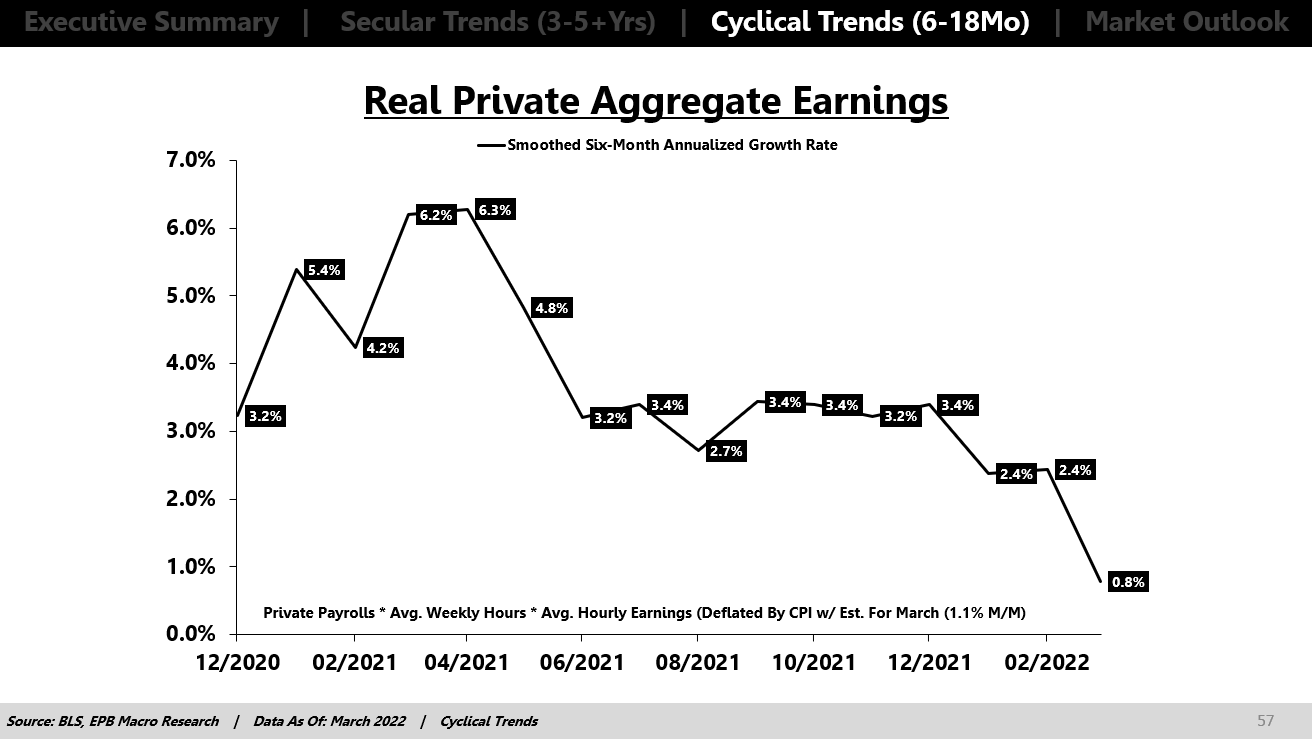
We can take the product of total private payrolls, average hourly earnings, and average weekly hours from the employment report. This calculation is “aggregate private earnings.”
We have to put these earnings into a growth rate and subtract the inflation rate for the full context.
We can see that real aggregate earnings growth is collapsing, falling from 6.2% in the spring of 2021 (peak growth) down to almost 0% as of this last report.
BLS, EPB Macro Research
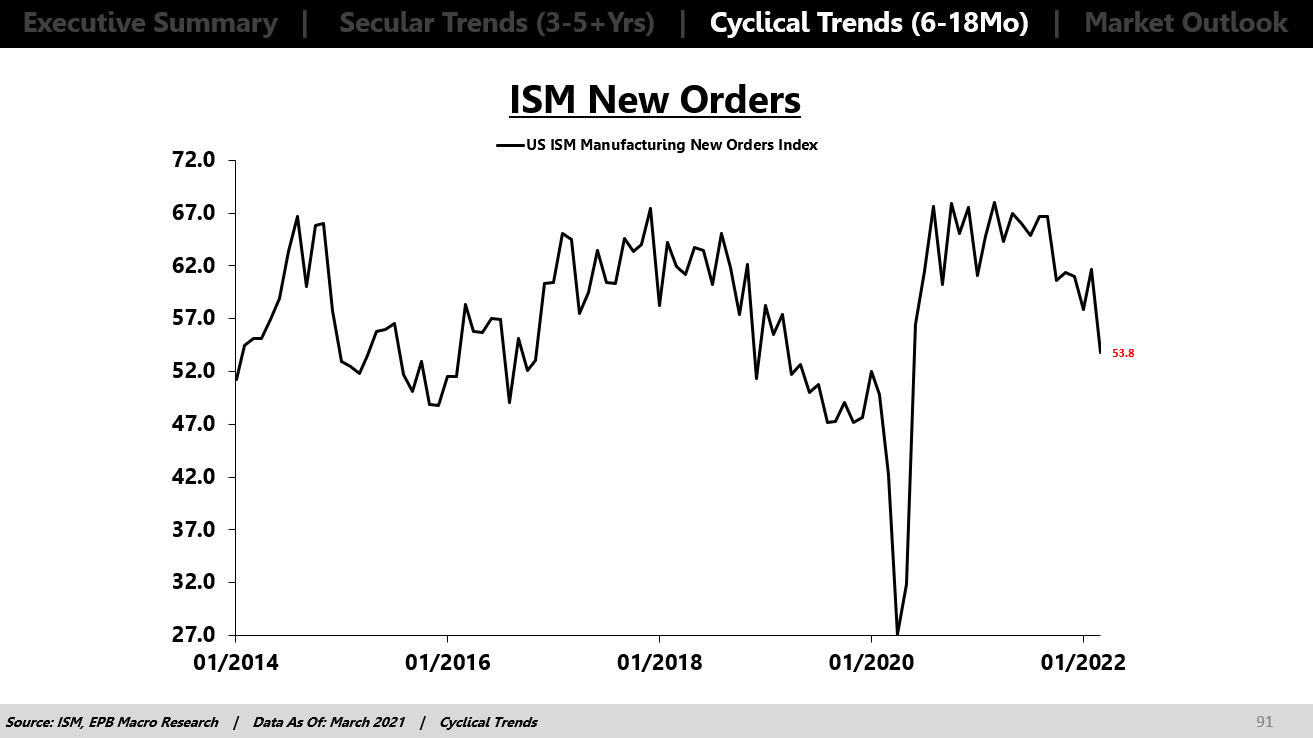
The ISM Manufacturing Index was also reported for March and showed a headline reading that fell to an 18-month low.
The more leading new orders sub-component fell to a 22-month low, confirming what the leading indicators had been foreshadowing.
ISM, EPB Macro Research
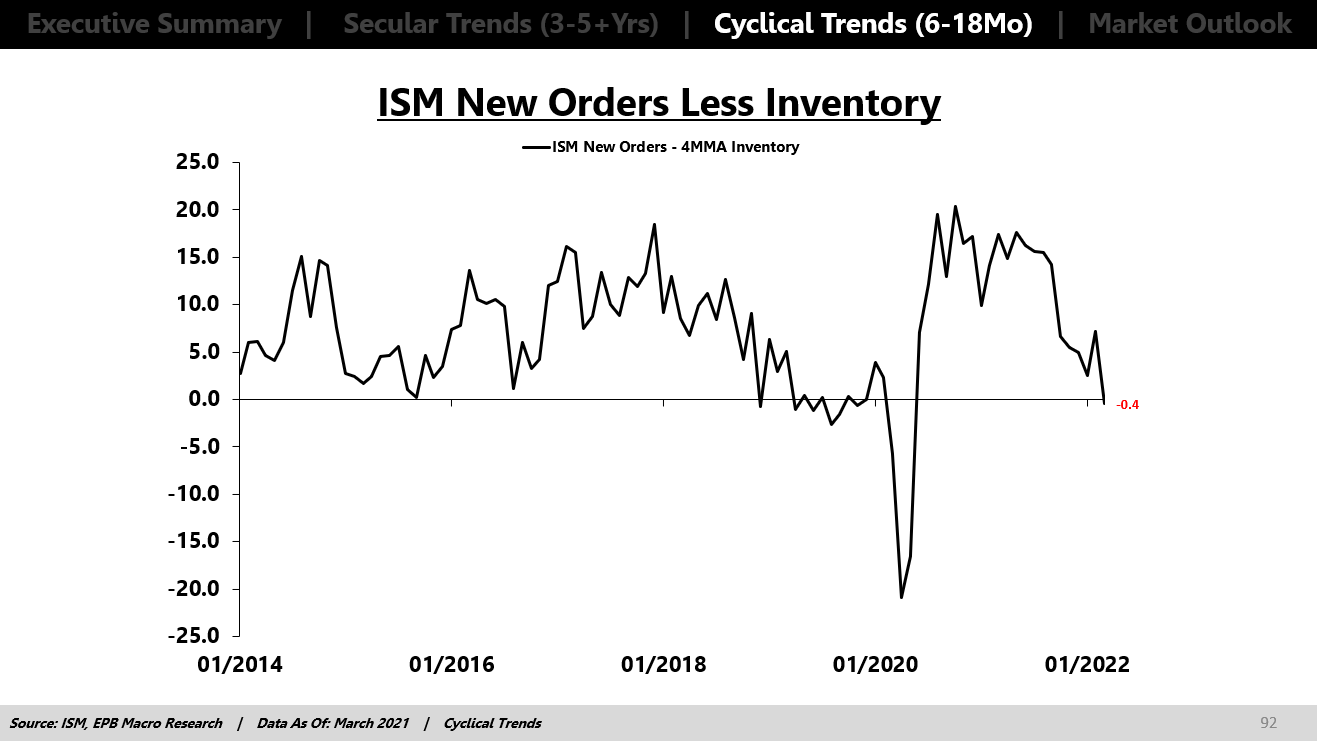
The spread between the new orders and inventory sub-components, also a leading variable, fell to a 22 month low which implies a major slowdown in production is on the horizon.
ISM, EPB Macro Research
Economic growth remains in a downturn, and the recent employment and ISM data confirm that the slowdown is picking up steam. Real income growth is falling and soon will be contracting. Consumers are now pulling back on big-ticket durables, which is coming through loud and clear via a slowdown in new orders for manufactured goods.
Asset Class Performance Trends
When economic growth is slowing, avoid cyclical assets and buy defensive assets.
The chart below shows a traditional basket of cyclical assets, including equities from these sectors: homebuilding, building materials, industrials, broad materials, emerging markets, high-beta style factor, and small caps.
The chart shows the relative performance of that cyclical basket compared to the defensive basket, which is a composite of consumer staples, utilities, S&P 500, and long-term bonds.
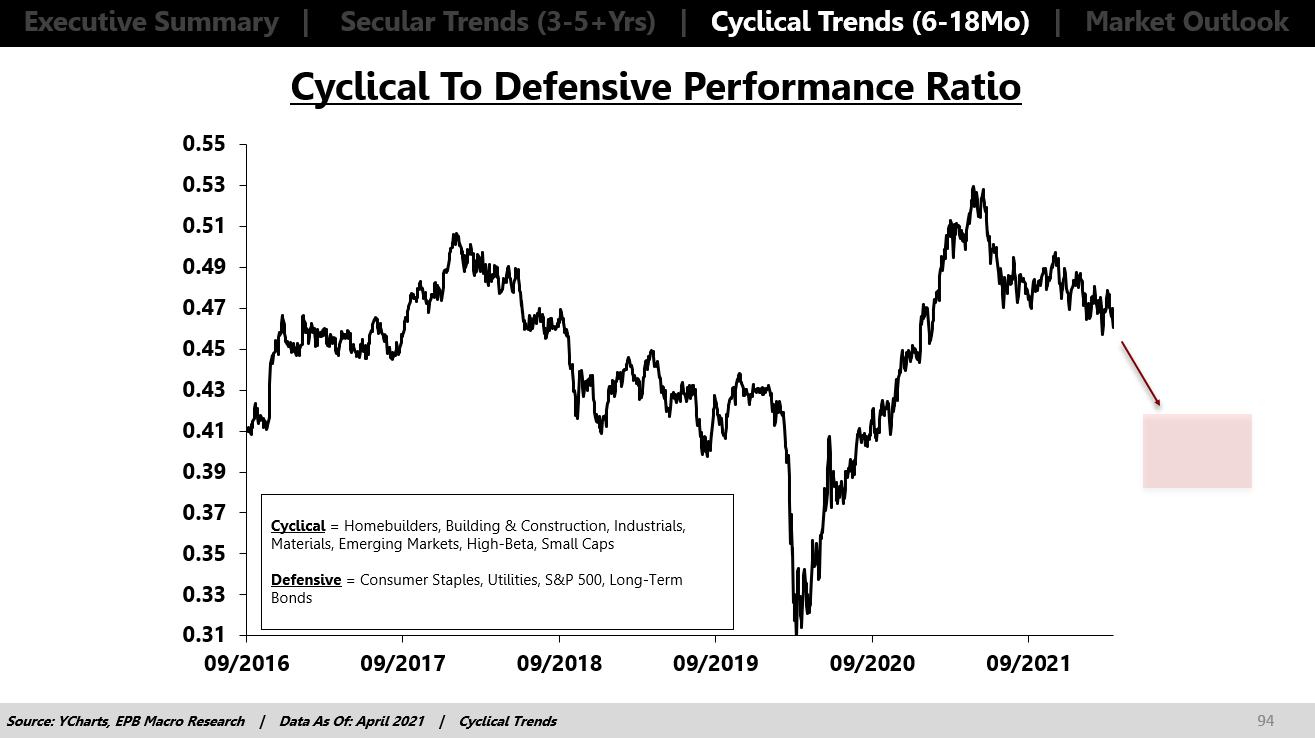
YCharts, EPB Macro Research
You can reference the peaks and troughs in the ratio above with the peaks and troughs from the ISM new orders chart to understand the connection between the cyclical direction of growth and the outperformance of cyclical or defensive assets.
Since the spring of 2021, the ratio above has been declining, which means cyclical assets have been broadly underperforming defensive assets.
The leading indicators of economic growth are firmly suggesting the slowdown will continue and will be at least near-recessionary. We don’t have sufficient data yet to confirm the economy is at recession’s door, but the slowdown will intensify from here.
There’s more room to fall in the ratio above.
Continue to avoid or short cyclical assets and continue to buy or overweight the defensive assets.
Within the defensive basket, long-term bonds offer the most asymmetric risk-reward. With a 6-12 month view, I’m still a buyer of (EDV) (NASDAQ:TLT).
Be the first to comment