

Sundry Photography/iStock Editorial via Getty Images
Investment thesis: as the markets have turned more conservative, stocks like IBM have become more attractive.
My analysis of large companies uses a three-fold approach: a look at the macroeconomic backdrop, an analysis of the company’s long-term financials, and a look at the charts. The economic analysis assumes that large companies like IBM will see share price appreciation in a growing economy and less downside risk in a down market. The financial statement analysis focuses on safety and stability while the chart analysis is looking at timing
I originally analyzed IBM in late January, concluding the following:
IBM is really more a high-grade bond than stock investment. This is really about dividend yield (which is attractive) instead of capital appreciation. If you need an income position, consider IBM. But this isn’t a large position stock and you shouldn’t be thinking this is going to climb in share value. Instead, “clip the coupon” and be done with it.
Let’s take a quick look at what’s changed in the economic and company picture since January.
The economic environment has become more clouded due to the Federal Reserve not only embarking on a set of rate hikes but to the increasing possibility of at least one 50 BP hike in the next few meetings. While the Fed wants to engineer a soft landing (an economic slowdown instead of a recession), it is far more likely to cause a recession. As a result, the financial market components of the long-leading, leading, and coincidental indicators are now flashing caution (below in red):
Long-leading, leading, and coincidental indicators (FRED data, author’s calculations)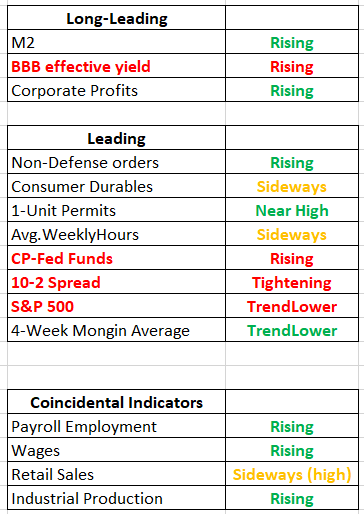
IBM released its latest 8-K on March 31. Revenues are in line with recent experience:
IBM gross revenue (Seeking Alpha)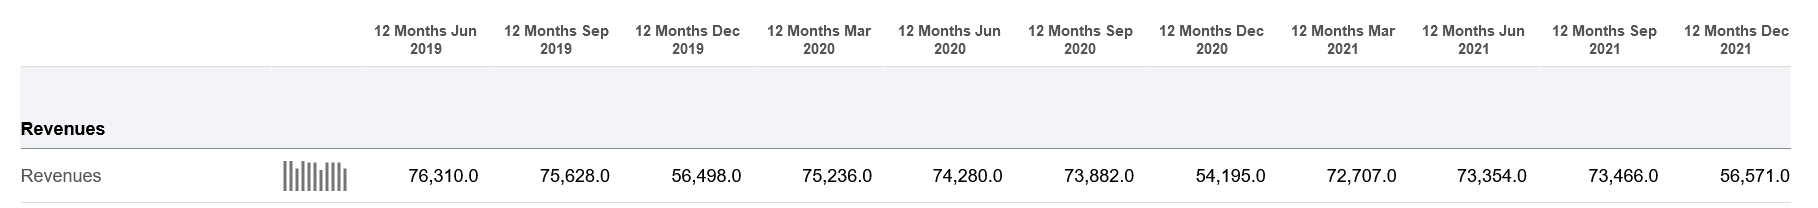
The TTM December figures have printed between $54-$56 billion during the last three years.
Now, let’s turn to the markets starting with the top three index performers for the most recent week, month, and YTD time frames:
| Week | Month | YTD | |
| First | [DIA] | QQQ | [SPY] |
| Second | [SPY] | OEF | [OEF] |
| Third | [OEF] | SPY | [DIA] |
Data from Finviz.com; brackets indicate a negative result.
The top performers are all large-cap indexes, which is beneficial to (NYSE:IBM).
Next up are the charts:
IBM weekly and daily charts (Stockcharts)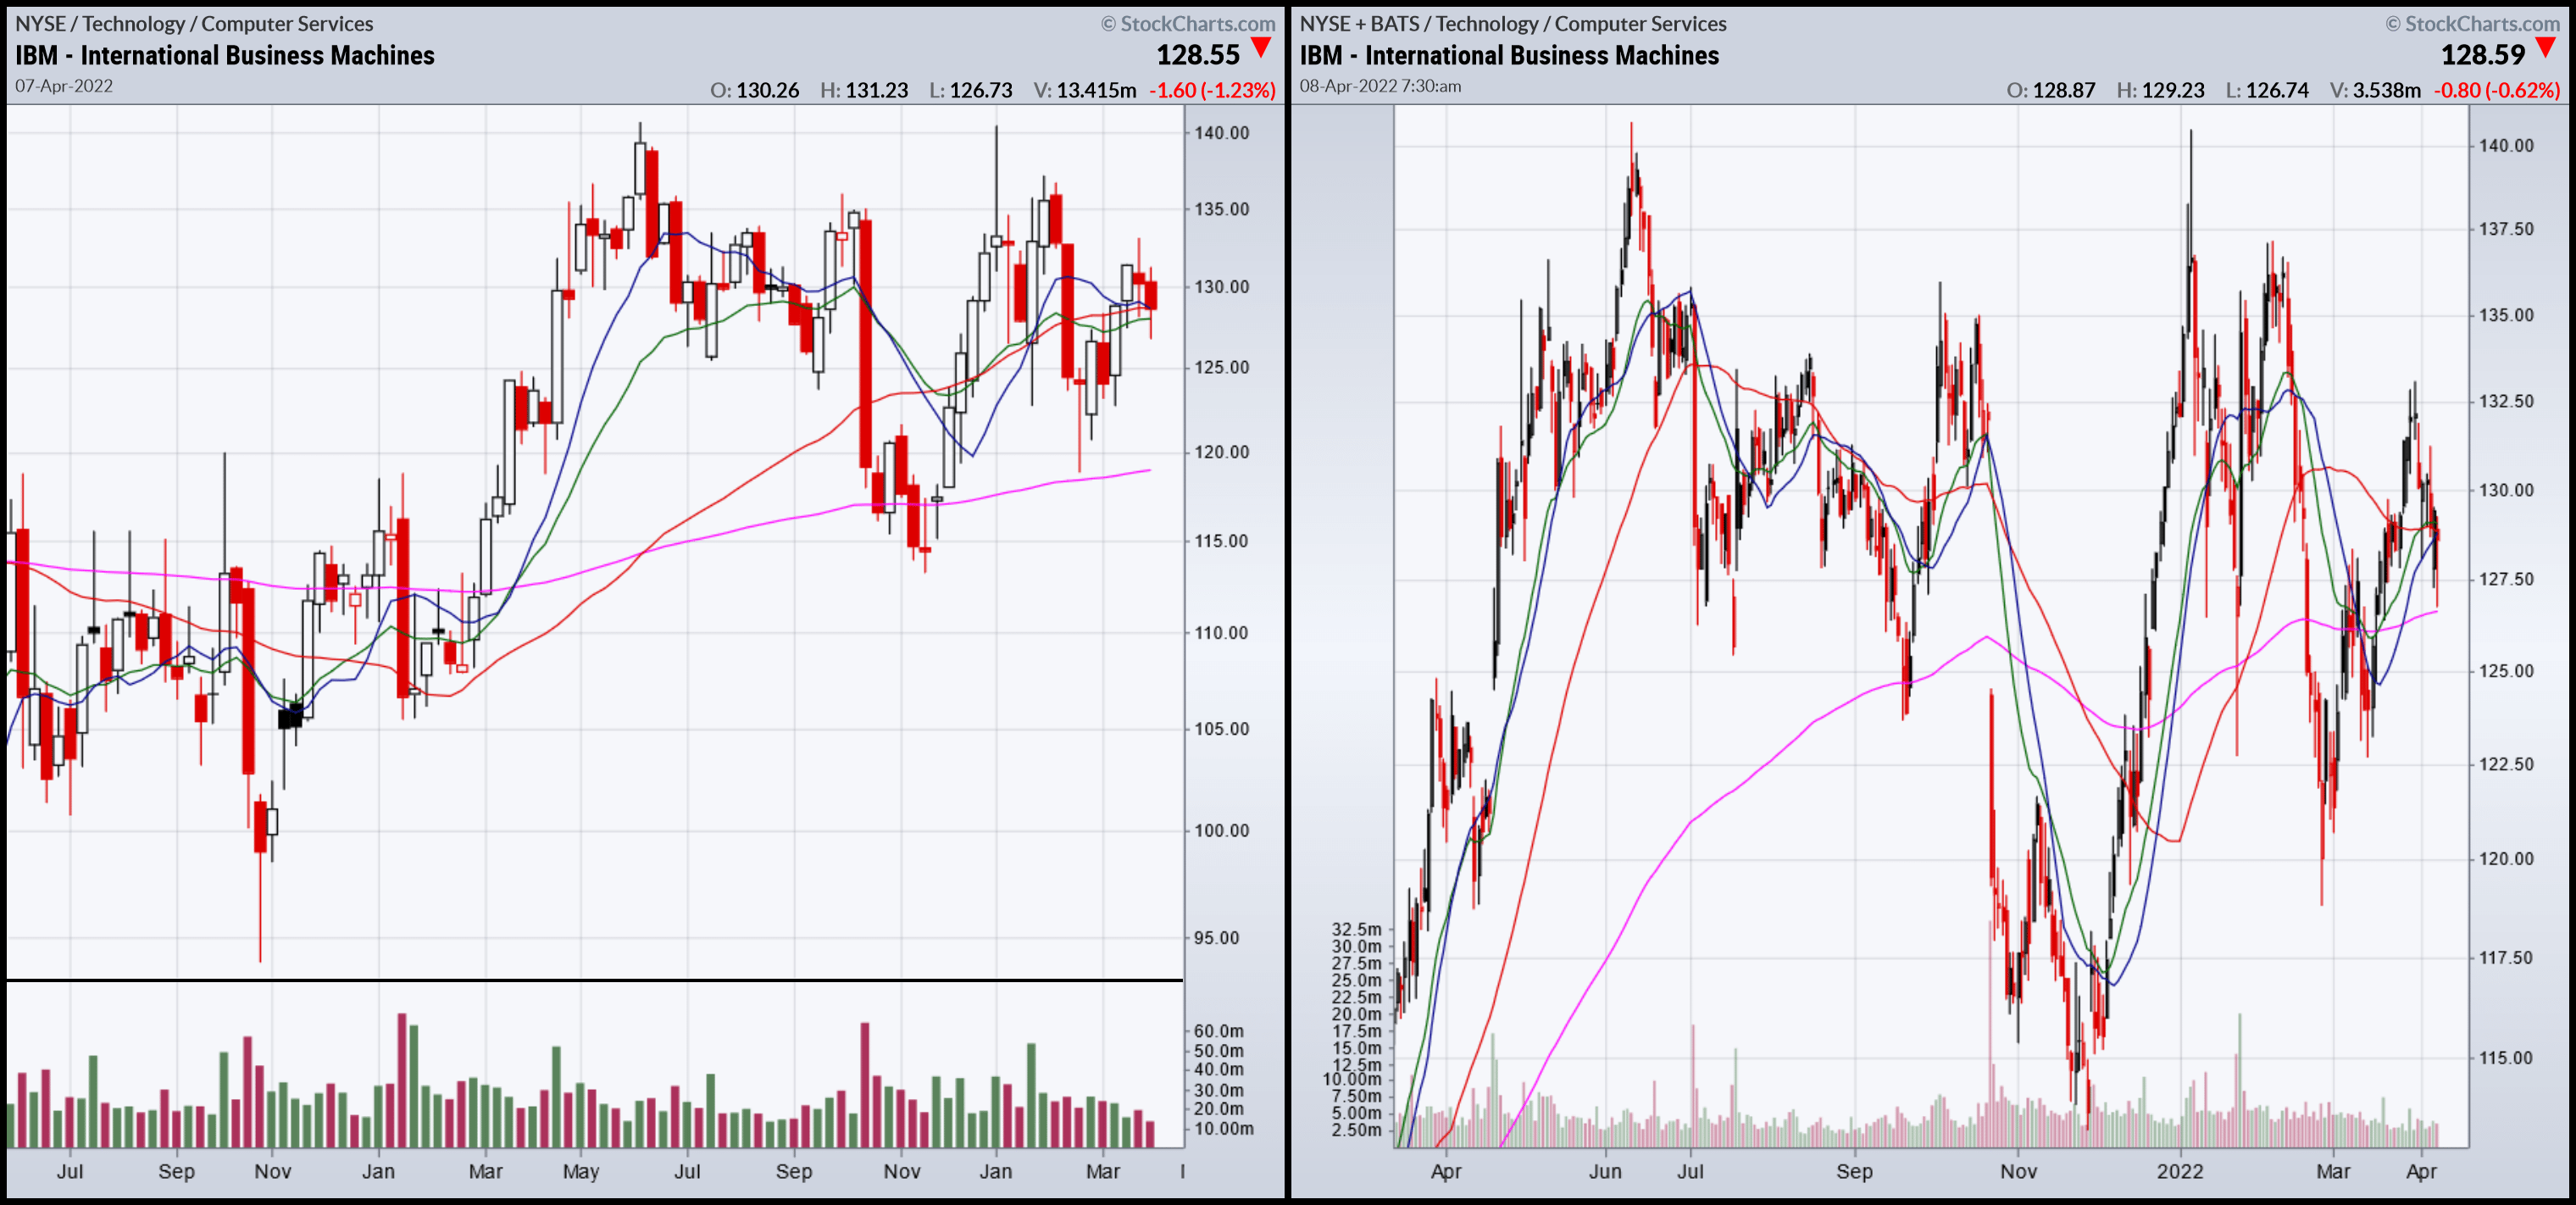
Not much has changed technically since January. The weekly chart (left) shows that prices are still consolidating. That is confirmed by the daily chart (right), where prices have been trending between 120-137 since the start of the year.
Finally, here’s the dividend data:
IBM Dividend Data (Seeking Alpha)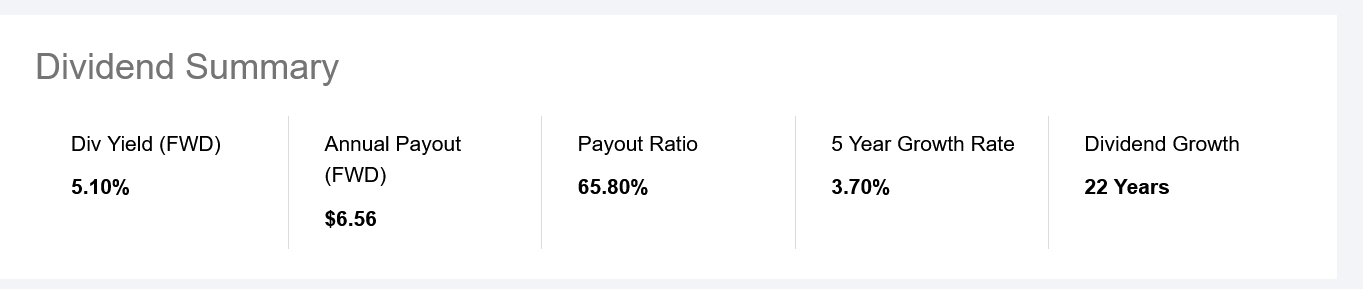
5.1% is attractive right now and it’s high enough that it will provide downside protection. The company is three years shy of becoming a dividend aristocrat and with a 65.85% payout ratio, they are more than able to get there if they want to.
I previously noted that IBM really acts more like a high-grade bond than equity. I stand by that assertion. If you have an investment portfolio where the investment policy requires equity allocation, consider IBM. You also might want to add to a position as prices dip, to get the yield.
Be the first to comment