

NicoElNino
Intro
If we look at a long-term chart of iShares Biotechnology ETF (NASDAQ:IBB), we can see no technical damage is evident as shares of the fund continue to make higher highs and higher lows. Furthermore, as we can see from the monthly MACD indicator, which is a solid read on both trend and momentum in IBB, we see that shares have rarely been as oversold from a long-term basis as we have at present. Suffice it to say, given the sustained pattern of higher highs and higher lows in IBB up to this point, that multi-year trend-line depicted below should continue to stand firm.
IBB Long Term Technical Chart (Stockcharts.com)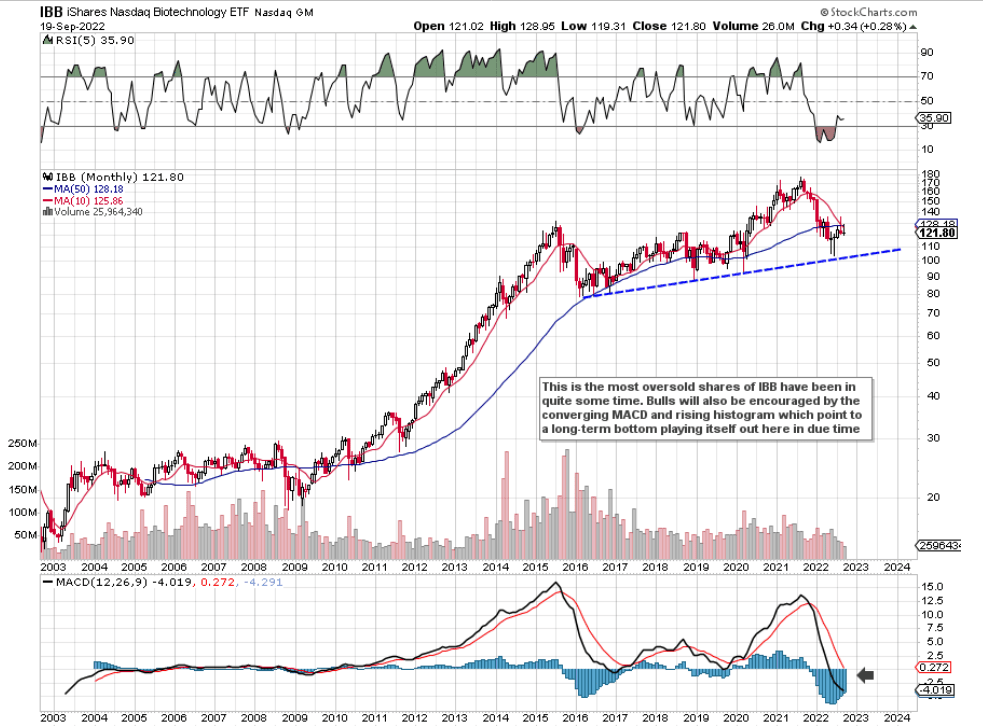
If we go to a more near-term chart of IBB, we see further evidence of a near-term bottom here. As we can see below, shares have been trading in roughly a $30 range for the best part of eight months now. However, buying volume has been on the rise meaningfully since shares bottomed in May of this year. This ties in with the more bullish trends we have seen in IBB´s assets under management in recent weeks. In fact, the assets under management (“AUM”) increase of over 3% over the past month alone points to a rally in the fund before long.
Furthermore, although short interest comes in at 10.89%, the number of shares sold short continues to come down. In the last short-interest report, the number of shares sold short dropped by almost 20%. The current number of shares sold short comes in at 6.97 million shares, which again is a far more encouraging number compared to previous months.
IBB Daily Technical Chart (Stockcharts.com)
Volatility
If we go to an implied volatility chart, we see that IBB’s implied volatility (30.4%) is well above its 12-month average and is trading well above historical volatility (23.3%). ETFs trading with an implied volatility of approximately 30% may turn off traditional ETF investors who do not want to suffer unwanted drawdowns. When we take ETFs as a whole, we see that their average implied volatility comes in at approximately the 20% mark. This demonstrates the perceived risk that a long investment in IBB may have over its ETF counterparts.
How, though, can one use IBB’s elevated implied volatility to both justify long exposure but also take risk off the table? What we would recommend would be the sale, for example, of the January´2024 $120 put option which presently is priced at about $1300 per put. This immediately would bring the investors’ cost-basis down to the $107 level for 100 shares in IBB, which is well over 11% below IBB´s prevailing share price and also very close to underside support.
Another question is why we would recommend going out well over a year with the sale of those puts. Well, as well as the fact that the position does not need to be micro-managed (which suits long-term investors), long-term options (liquidity allowing) have higher vega (especially if one selects the at-the-money options which we have – $120 strike) over their short-term counterparts. This means that any decline in volatility (which will indeed happen as volatility is mean-reverting) will see the position respond more favorably when the eventual contraction occurs. Furthermore, longer-term options have lower gamma (how quickly delta changes), which again means much less volatility over a short-term option.
So, if we look at the setup for the trade below, we see that the position has a 70% probability of profit where the cost basis, as mentioned, is close to the $107 mark. Furthermore, the margin requirement ($1,304) really demonstrates how one can make far better returns on capital by using options over buying IBB shares outright. This is an example of using LESS risk when trading options as opposed to being long stock. We state this because by agreeing to take possession of IBB shares in 486 days’ time at the $120 strike, the real cost-basis is approximately $107 ($13 less than the prevailing price per share of IBB today)
Performance Chart IBB (Interactive Brokers)
Conclusion
The iShares Biotechnology ETF looks attractive from the long side due to its technicals (higher lows and higher highs intact), volume trends, reducing short ratio, and increasing assets under management. Furthermore, the fund’s high implied volatility (also present in its longer-term options) gives long-term investors the opportunity to sell the at-the-money put options to take advantage of that elevated vega. We look forward to continued coverage.
Be the first to comment