

S&P 500, Dollar, GBPUSD, USDJPY and Recession Talking Points:
- The Market Perspective: USDJPY Bearish Below 141.50; Gold Bearish Below 1,680
- On the back of Monday’s impressive 1.5 percent gap higher from the S&P 500, the index surged another 1.9 percent on Tuesday’s open
- Those looking for justification for a ‘risk on’ mentality can find it in the UK’s fiscal policy reversal and NFLX earnings, but there are serious underlying issues
Recommended by John Kicklighter
Get Your Free Top Trading Opportunities Forecast
An Undeniably Impressive S&P 500 Gap Higher and Earnings Run
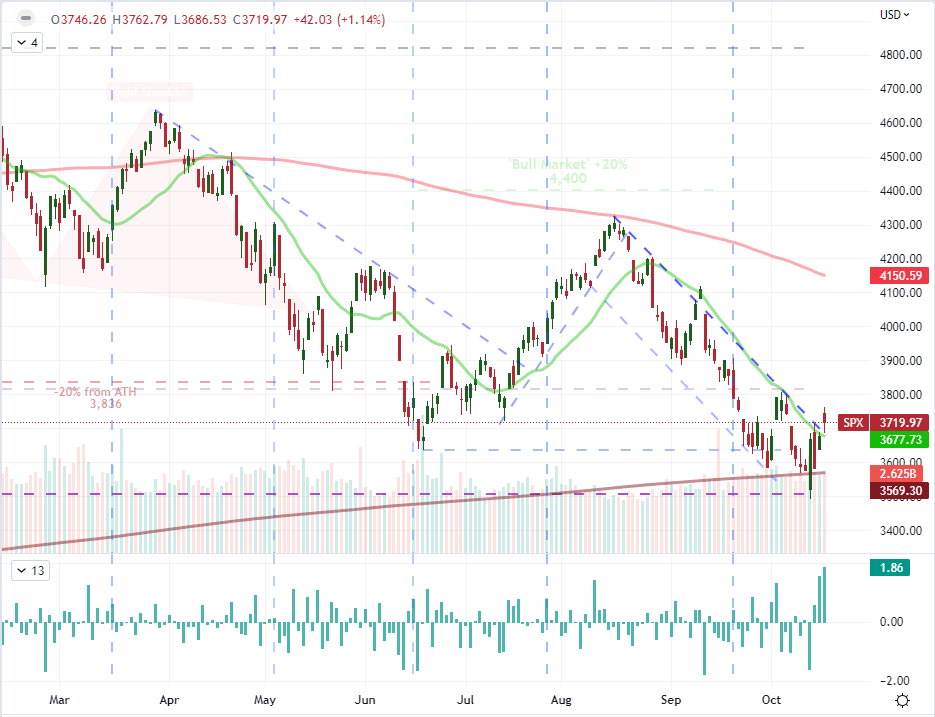
If you were looking for support to build a risk appetite perspective in the market this past session, there were technical and even a few light fundamental developments that could keep the ember lit. That said, the systemic threats run deep and the broader bear trend of 2022 is hard to miss. It is important, going forward, to differentiate the short-term changes in the speculative winds from the medium to long-term hardship that don’t seem to be going away anytime soon. For those diehard bulls, the S&P 500 seemed to offer among the most promising foundations of support. The US index followed a 1.5 percent bullish gap on the open, the biggest since November 9, 2020, with an even more impressive 1.9 percent charge Tuesday morning (which beat out the previous day’s historical milestone stretching back to the same timeline). There was not much in the way of convincing follow through during active hours once again, but he opening thrust nevertheless roused sentiment with a move through a multi-month channel top and via a close above the 20-day simple moving average (SMA). But is that enough?
Chart of S&P 500 with Volume, 20-Day, 100-Day, 100-Week SMAs, and Daily Gaps (Daily)
Chart Created on Tradingview Platform
In the most charitable assessment I can muster of the market’s performance over the first 48 hours of the trading week, there seems to be an opportunity to revive confidence in the short-term. Speculative reversals are not uncommon in even established trends, but it is a very different thing to suspect a bounce to turn into the foundations of a lasting trend. Fundamental support is frequently a critical qualifier for a systemic change in tack. The picture of monetary policy, recession potential and financial cracks has only worsened recently; but perhaps the earnings season can offer a temporary distraction as we chart our course on the broader economy. This past session, yet another bank – Goldman Sachs – reported ‘better than expected’ results that were still a cooling from previous periods thanks to volatility and higher rates in the financial markets. That is not exactly a universal benefit to corporate America. The bigger impression comes from Netflix which reported earnings per share (EPS) of $3.10 against $2.20 expected on $7.93 billion in revenue and a 2.41 million increase in user. The 15 percent rally in NFLX shares after hours indicates how that information is being interpreted, but how much is this an interpretation of the market at large?
Chart of Netflix with 20 and 100-Hour SMAs with After-Hours Trade (Hourly)
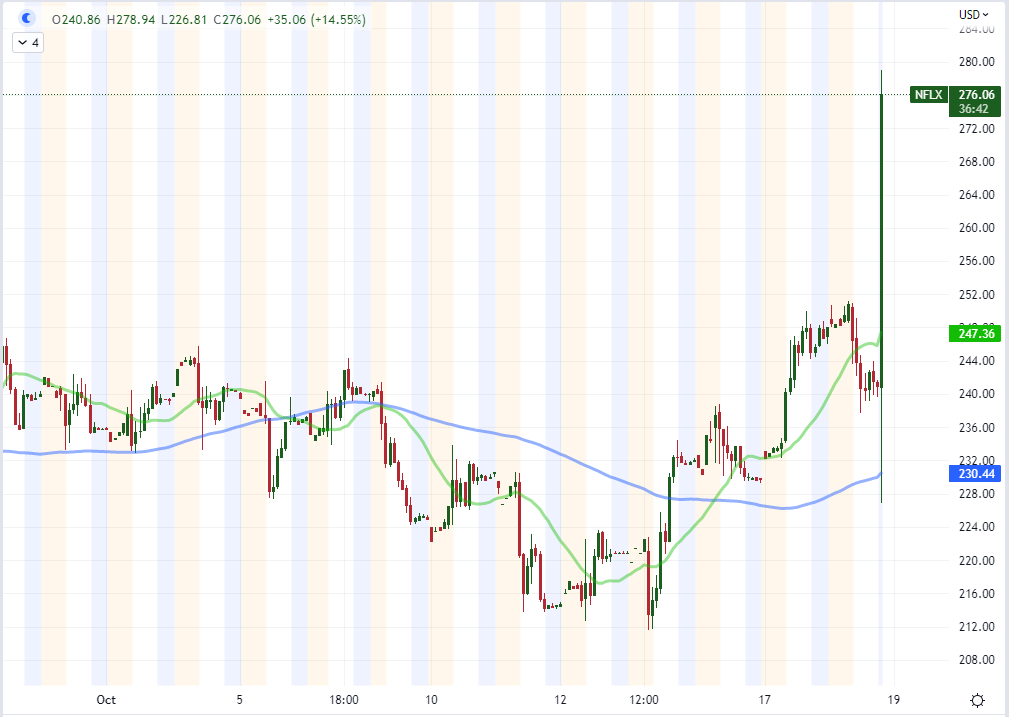
Chart Created on Tradingview Platform
The Fundamental Risks Continue to Build
Reflecting on the same outlet of US earnings, Netflix has seen a considerable slide in its ability to represent the broader market through the past year. Further, the FAANG grouping for which this ticker is a member has seriously flagged in its speculative representation. In fact, the ratio of the tech-heavy Nasdaq 100 to the blue-chip Dow Jones Industrial Average (‘growth’ to ‘value’) ratio has dropped below the midpoint of the 2018 to 2021 advance encompassing serious speculative escalation. QQQ afterhours trade relative to the DIA ETF suggests the ratio may bounce tomorrow, but how far is practically going to stretch? With the bigger players of Google, Apple and Amazon due to report next week – amid US and Eurozone 3Q GDP – gaining traction on a reach in sentiment seems fraught.
Chart of Nasdaq 100 to Dow Jones Industrial Average Ratio with 20 and 100-Day SMAs (Daily)
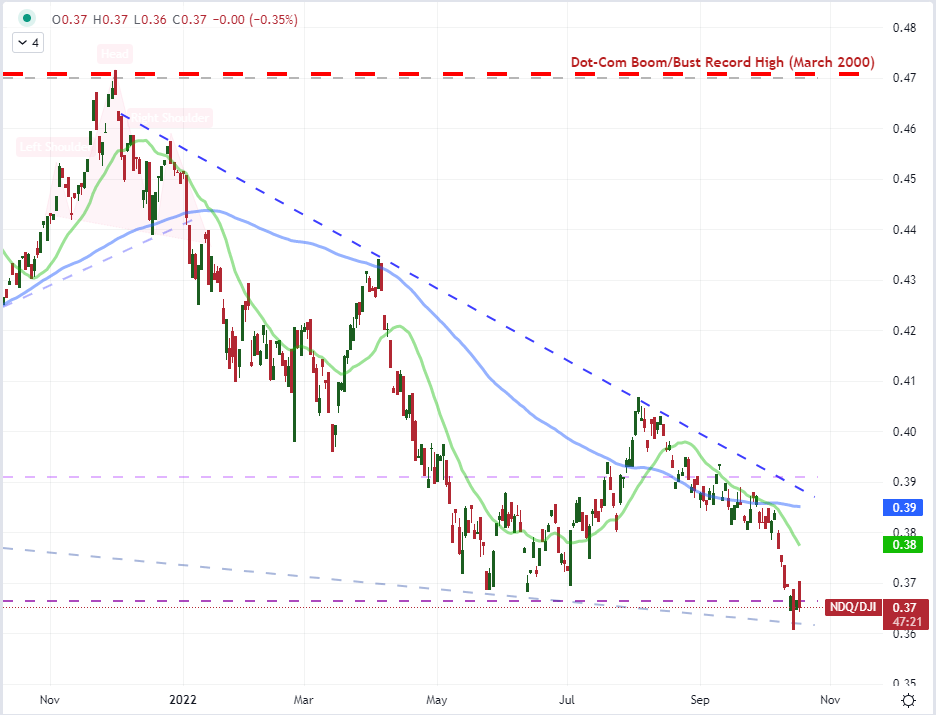
Chart Created on Tradingview Platform
If we push aside the gap higher in risk benchmarks this past session and neutralize for a moment the NFLX earnings figures, the bigger issues in fundamental health are pointing precariously lower. It was worth noting that credit rating agency Fitch released an assessment that global credit risks are rising and a forecast for the US economy to drop into recession by the Spring. That is a little more aggressive that Bloomberg’s forecast for a contraction in the next 12 months or the NAHB’s Housing Market Index update reinforcing the signal that the housing market is itself in a recession. Consider the source of the forecast before you throw your confidence behind the view – or believe that the market will follow sight unseen. The White House suggested indicators currently do not indicate a recession while global CEOs have made an effort to focus on the current strengths in labor and corporate funding. Yet, they have a stake in supporting an optimistic view. Alternatively, the warnings from Fitch, the IMF and from the US 10-year / 2-year Treasury spread carry less subjectiveness. The question is when does the market heed the undercurrents?
Recommended by John Kicklighter
Get Your Free USD Forecast
Chart of US 10-Year to 2-Year Treasury Yield Spread Overlaid by US GDP YoY (Monthly)
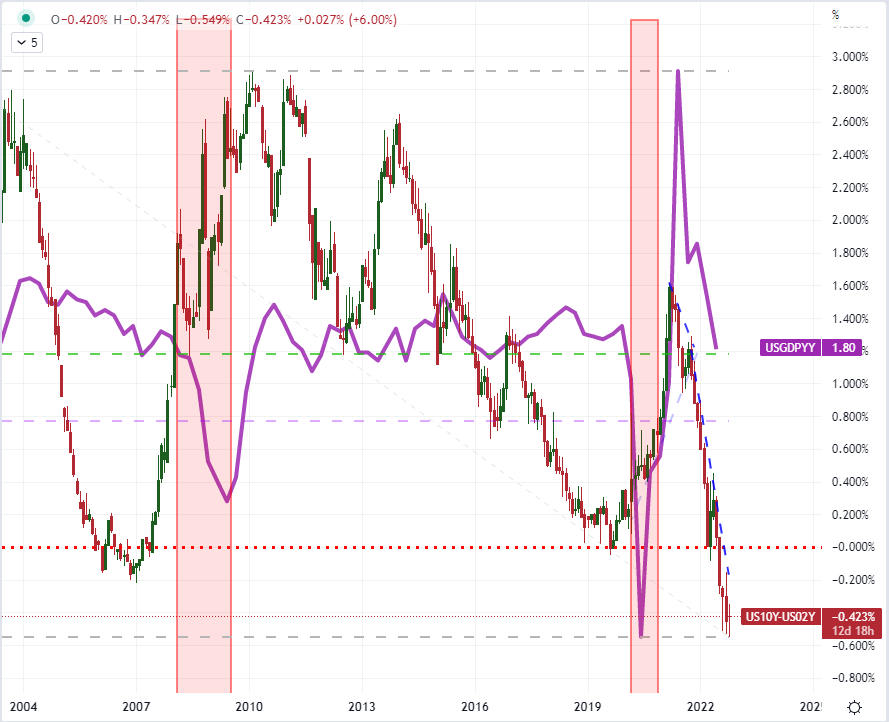
Chart Created on Tradingview Platform
The evolution of economic degradation is a process that will take considerable time, but financial strains can unfold more suddenly and fuel the panic that we have thus far been able to avoid. Recently, the situation behind the United Kingdom’s financial stability seems to have improved with the government’s virtually full reversal on the offending mini budget. Alternatively, credibility here has been shaken. Regardless, there are other pressure points around the system including constant iterations of concern related to the extent of the Dollar’s surge. A Bank of America fund manager survey released this past session said the long-USD play was the most over-saturated. The combination of the Greenback’s high yield forecast, the ability to export more pressure to global peers in economic terms and the role it plays as a safe haven have keep the currency under power. This past session, USDJPY closed a 10th consecutive advance. That matches the longest run from this pair since 1973. What’s worse is that there is speculation that the authorities attempted to intervene on behalf of the exchange rate but were simply beaten back by the market. Losing credibility at this juncture represents serious problems.
Recommended by John Kicklighter
How to Trade USD/JPY
Chart of USDJPY with 20-Day and 100-Day SMAs and Consecutive Candle Count (Daily)
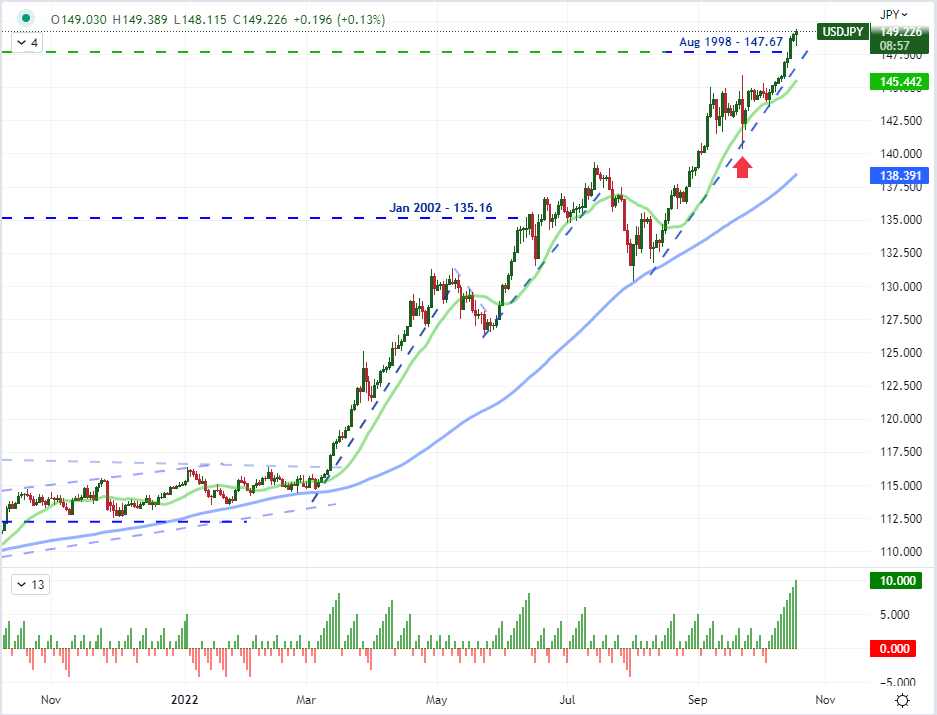
Chart Created on Tradingview Platform
The Event Risk: Inflation, Earnings and a Fed Countdown
At the momentum, I’m evaluation the market’s bearings in both a short-term and longer-term perspective. For longer-term, the implications of a slow march towards recession and the dangerous risk of financial threats metastasizing are keeping me from formulating a true optimism in the capital markets. Meanwhile, the short-term can be motivated by the development of scheduled event risk. From a monetary policy perspective, the UK and Canadian inflation data for September is worth monitoring – the former will tell how badly the fiscal miscue will charge further shock while the latter will play into next week’s BOC rate decision. On the earnings front, I am watching Tesla as the most ‘market indicative’ ticker, but Alcoa and IBM are blue chip material. Then there is the Fed’s Beige Book. Technically, the report is the Fed’s official working outlook for economic trends, but functionally it just starts the 2 week countdown to the next FOMC rate decision.
Critical Macro Event Risk on Global Economic Calendar for Next Week
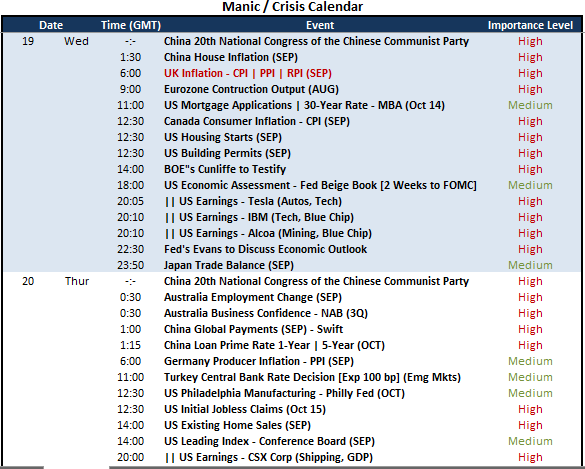
Calendar Created by John Kicklighter
Trade Smarter – Sign up for the DailyFX Newsletter
Receive timely and compelling market commentary from the DailyFX team
Subscribe to Newsletter
Be the first to comment