

choness
Thanks to the WFH (Work-From-Home) trend, Office REITs have taken a beating, resulting in low prices and high yields. In a bad year for REITs, Office REITs have underperformed, returning an average of (-36.87)% YTD, compared to the REIT average of (-32.03)%, according to Hoya Capital.
Hoya Capital Income Builder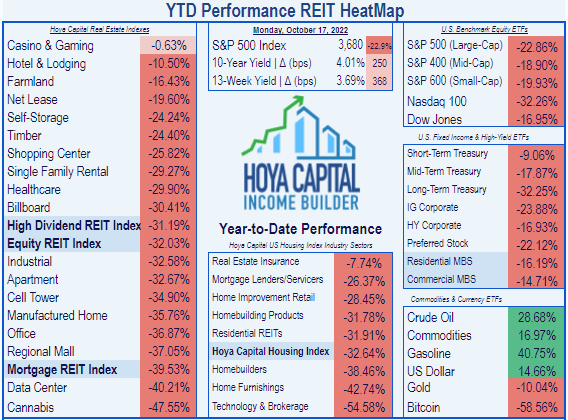
The post-pandemic WFH (work from home) trend has put an apparently permanent 10% dent in leasing demand for office space, with office utilization rates hovering 40 – 60% below pre-pandemic levels. According to Hoya Capital,
Markets with longer, transit-heavy commutes and a WFH-disrupted industry mix heavy in technology and financial services will continue to face the most sustained headwinds.
Hoya Capital Income Builder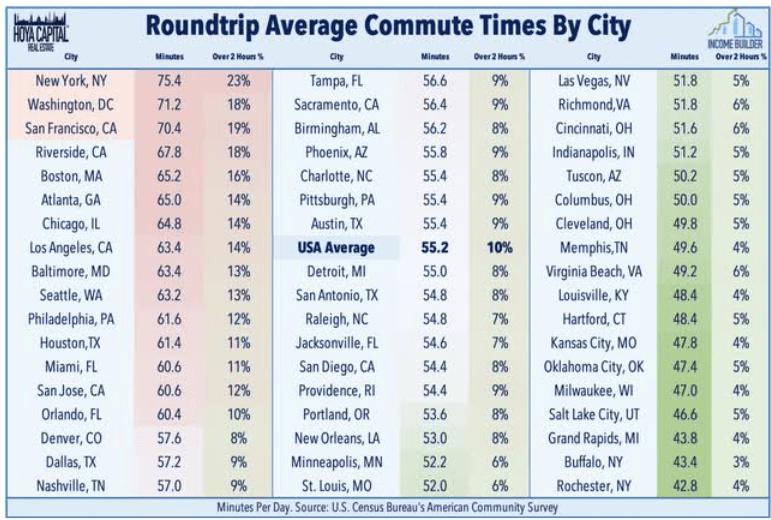
Hudson Pacific Properties (NYSE:HPP) has done worse than most Office REITs, as share price has lost a staggering (-57.47)%. Meanwhile, the Yield has risen above 9%, making it potentially attractive to income investors.
Seeking Alpha Premium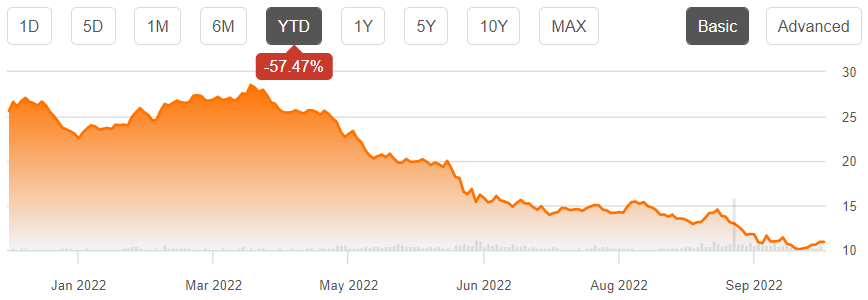
The question is, will those losses continue to mount, or is a turn-around in store?
Meet the company
Hudson Pacific Properties
Hudson Pacific Properties is the leading publicly traded owner of office space in Silicon Valley and one of the largest independent owner-operators of movie studios in Los Angeles. The company owns 54 Class A office properties totaling 14.6 msf (million square feet) of rentable space, and another 8 land parcels, in Vancouver, Seattle, San Francisco, and Los Angeles (along with a development underway in London). The same-store office portfolio is 12.82 msf, and is 92.2% occupied, generating $615 million in ABR (annualized base rent.) The company also owns 4 studios totaling 1.5 msf, of which 1.23 msf is same-studio space, occupied at just 84%.
Hudson Pacific acquires, operates, transforms, and builds premier office and studio properties in global epicenters for tech and media innovation, focusing on less capital-intensive, shorter-time-to-market, core-plus and value-add investments.
Office occupancy rates vary considerably across HPP’s four markets, from a high of 98.7% in the Los Angeles area to just 83.8% in greater Seattle.
| Market | MSF | % Occupied | ABR | ABR/sq ft |
| Vancouver | 1.50 | 94.4 | $42.1 m | $29.60 |
| Seattle | 1.95 | 83.8 | $62.7 m | $38.36 |
| San Francisco | 7.23 | 89.7 | $389.2 m | $60.06 |
| Los Angeles | 2.13 | 98.7 | $120.8 m | $58.01 |
| Total | 12.82 | 92.2 | $614.9 m | $52.91 |
Source: Company Q2 Supplemental
The company is currently engaged in repositioning 408,000 square feet of office space and 25,000 square feet of studio space, with another 541,000 square feet of office space and 241,000 square feet of studios under construction. There are another 3.6 msf in future development, on properties already owned by HPP.
The tenant base is mostly premier high-growth high-tech companies, with the top 15 shown in the table below. (RSF stands for rentable square feet.) HPP is overly dependent on Google as a tenant, deriving 12.7% of annual base rent from Google alone.
| Tenant | % of RSF | ABR (millions) | % of ABR |
| 8.2% | $76.8 | 12.7% | |
| Amazon | 5.4% | $25.5 | 4.2% |
| Netflix | 2.8% | $24.7 | 4.1% |
| Nutanix | 3.3% | $18.5 | 3.1% |
| Riot Games | 2.2% | $18.4 | 3.0% |
| Qualcomm | 2.9% | $15.4 | 2.5% |
| Salesforce.com | 2.1% | $14.5 | 2.4% |
| Block | 2.0% | $13.3 | 2.2% |
| Uber Technologies | 1.4% | $9.9 | 1.6% |
| Dell EMC Corp. | 1.3% | $9.7 | 1.6% |
| NFL Enterprises | 1.3% | $8.4 | 1.4% |
| Company 3 Method | 1.0% | $7.1 | 1.2% |
| WeWork Companies | 1.1% | $7.0 | 1.2% |
| GitHub | 0.7% | $6.9 | 1.1% |
| PayPal | 1.0% | $5.8 | 1.0% |
| Total, top 15 tenants | 36.7% | $262.0 | 43.3% |
Source: Company Q2 Supplemental
The company’s weighted average remaining lease term is 5.1 years. Lease expirations are nicely spread out, but averaging low double digits over the coming 4 years. Leasing will be key to HPP’s prospects.
| Period | 2022 | 2023 | 2024 | 2025 | 2026 | 2027 | 2028 | 2029 |
| % of ABR expiring | 9.7% | 11.9% | 13.3% | 14.5% | 6.2 % | 7.0% | 9.8% | 2.9% |
Source: Company Q2 Supplemental
The tenant roster is heavily concentrated in technology (40.8% of ABR) and media (13.7%).
Company Q2 Supplemental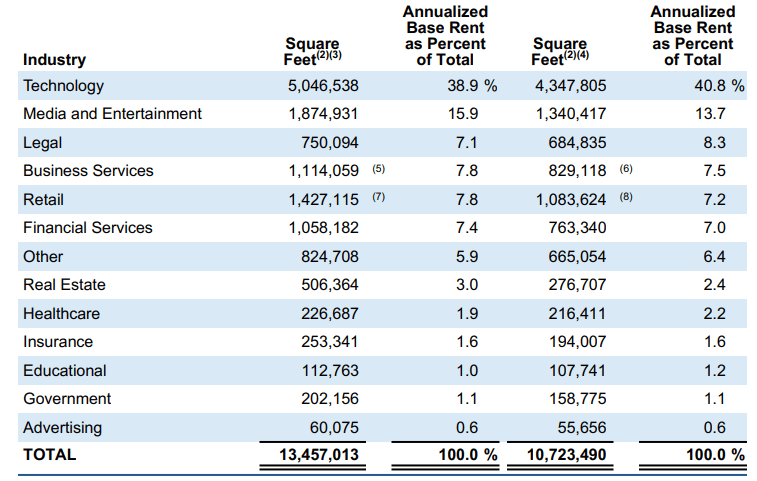
In an interview given at the BofA Global Real Estate Conference in September, CEO Victor Coleman stated that for the first half of 2022, HPP has realized 15% GAAP leasing spreads. This is a potentially strong source of internal growth, if they can renew or replace their expiring leases in a timely manner.
The company is also growing externally. Coleman says their last 3 acquisitions, totaling $600 million, were executed at a cap rate of about 15%. The company is especially excited about the recent purchase of Quixote Studios, a leading provider of production services to Hollywood. Streaming content providers are increasing production, which drives demand for studio and related assets. The deal also synergizes with HPP’s existing portfolio of studios and services, and provides enhanced presence in the high-spend markets of New York, Atlanta, and New Orleans.
HPP does not hesitate to sell underperforming properties. The company currently has 4 low-occupancy properties, totaling 745,000 square feet, held for sale.
Growth metrics
Here are the 3-year growth figures for FFO (funds from operations), TCFO (total cash from operations), and market cap.
| Metric | 2019 | 2020 | 2021 | 2022* | 3-year CAGR |
| FFO (millions) | $316 | $284 | $294 | $279 | — |
| FFO Growth % | — | (-10.1) | 3.5 | (-5.1) | (-4.09)% |
| FFO per share | $2.03 | $1.91 | $1.99 | $2.03 | — |
| FFO per share growth % | — | (-5.9) | 4.2 | 2.0 | 0.00% |
| TCFO (millions) | $288 | $302 | $315 | $380 | — |
| TCFO Growth % | — | 4.9 | 4.3 | 20.6 | 9.75% |
*Projected, based on H1 2022 results
Source: TD Ameritrade, CompaniesMarketCap.com, and author calculations
HPP’s revenues have largely recovered from the pandemic, and the company has kept cash flow growing the entire time, which is remarkable.
Meanwhile, here is how the stock price has done over the past 3 twelve-month periods, compared to the REIT average as represented by the Vanguard Real Estate ETF (VNQ).
| Metric | 2019 | 2020 | 2021 | 2022 | 3-yr CAGR |
| HPP share price Oct. 17 | $33.65 | $20.76 | $27.83 | $10.90 | — |
| HPP share price Gain % | — | (-38.3) | 34.1 | (-60.8) | (-31.50)% |
| VNQ share price | $93.81 | $80.82 | $106.38 | $79.01 | — |
| VNQ share price Gain % | — | (-13.8) | 31.6 | (-25.7) | (- 5.60) |
Source: MarketWatch.com and author calculations
As you can see, HPP was hit hard by the pandemic, bounced back strong in 2021, then has taken a gut punch this year. Investors who bought HPP in 2019 have experienced average annual losses of (-31.5)%, compared to the more modest loss of (-5.6)% for VNQ investors.
Balance sheet metrics
Here are the key balance sheet metrics. HPP is in a mild amount of trouble in this area. Their Debt Ratio and Debt/EBITDA are worse than the Office REIT average, and considerably worse than the REIT average.
| Company | Liquidity Ratio | Debt Ratio | Debt/EBITDA | Bond Rating |
| HPP | 1.79 | 46% | 7.8 | BBB- |
Source: Hoya Capital Income Builder, TD Ameritrade, and author calculations
As of June 30, the company had $782 million in liquidity, over against $4.3 billion in debt. Maturities will climb rapidly over the next four years to a peak of almost $1 billion in 2026, then fall off sharply to $456 million in 2027, and just $55.6 million in 2028.
Company Q2 Supplemental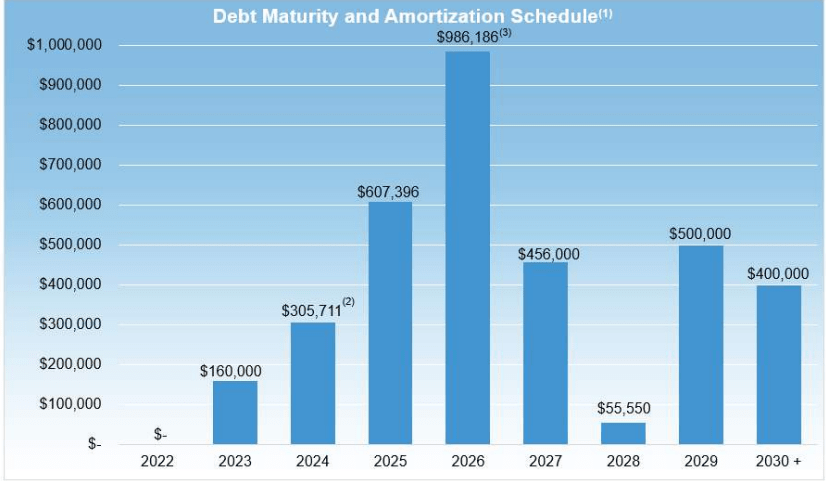
The weighted average interest rate on the debt is 3.5%, with a weighted average of 4.7 years to maturity. Of the debt, $2.4 billion is unsecured.
In early September, HPP issued $350 million worth of senior notes at 5.95%, with a February, 2028 maturity, taking advantage of the 2028 lull, and taking some pressure off their line of credit.
HPP repurchased 2.1 million shares of common stock outside of the ASR (accelerated share repurchase) program, at an average price of $17.65 per share in Q2. Over the period from June 30, 2021 to June 30, 2022, the company reduced its share count by 6%.
Dividend metrics
HPP’s dividend is exactly $1.00 per share, unchanged from Q1 2017. This company did not reduce its dividend during the COVID sell-off, and its current 9.3% yield appears well-covered. HPP earns a picture-perfect Dividend Safety score of C- from Seeking Alpha Premium.
| Company | Div. Yield | 3-yr Div. Growth | Div. Score | Payout | Div. Safety |
| HPP | 9.3% | 0.0% | 9.3% | 50% | C- |
Source: Hoya Capital Income Builder, TD Ameritrade, Seeking Alpha Premium
Dividend Score projects the Yield three years from now, on shares bought today, assuming the Dividend Growth rate remains unchanged.
Valuation metrics
In a sector that is already on sale, HPP is available for a whopping 64.2% discount to NAV. Its Price/FFO of 5.3 is barely more than half that of the average Office REIT currently. In other words, it’s dirt cheap.
| Company | Div. Score | Price/FFO ’22 | Premium to NAV |
| HPP | 9.03 | 5.3 | (-64.2)% |
Source: Hoya Capital Income Builder, TD Ameritrade, and author calculations
For a growth investor, the low Price/FFO is a shot across the bow. Cheap REITs are usually cheap for a reason.
What could go wrong?
Tenants in HPP’s office spaces tend to be high-dollar, high-head-count installations. Expiring leases that are not renewed may create significant occupancy challenges.
As employers learn how to optimize office space in a more prevalent WFH culture, demand for office space may continue to decline. However, this may also mean that employers can afford to move to higher-quality office space, which would benefit HPP and its Class A properties.
Investor’s bottom line
Hudson Pacific Properties appears to me to be oversold. The 9%+ dividend Yield and the dirt-cheap Price/FFO make it an attractive value proposition, and the catalysts of streaming video production and double-digit leasing spreads suggest the company has growth potential as well. HPP has a very decent shot at a turn-around, and I rate the company a Buy, with only a modest allocation.
Seeking Alpha Premium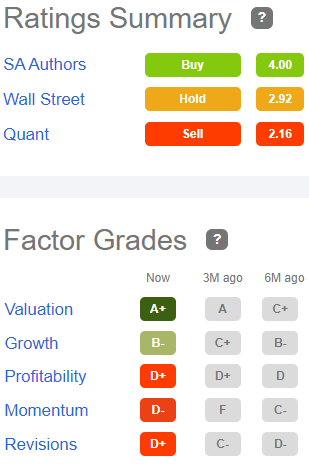
On September 2, HPP was dropped from the S&P 500. On September 18, however, Citi named HPP one of 10 buys in the Real Estate sector, based on future growth prospects.
The Street and Seeking Alpha’s Quant ratings say Sell, Ford Equity Research and Zacks say Hold, TipRanks rates HPP as Outperform. Eleven of the 14 Wall Street analysts covering HPP recommend a Hold. The average price target is $16.23, implying 51% upside, along with 9.3% yield.
As always, the opinion that matters most is yours.
Be the first to comment