

shapecharge/E+ via Getty Images
Thesis
The John Hancock Tax-Advantaged Global Shareholder Yield Fund (NYSE:HTY) is a global equities closed end fund focusing on dividend paying securities. The vehicle focuses on large capitalization value stocks with a global mandate. Currently 55% of the exposure is represented by U.S. domiciled companies while Canada and the United Kingdom are the next jurisdictions with a heavy ponderance. The fund has a good recent performance (up +19% on a 1-year basis), but longer term the trailing total returns are modest clocking 4.5% and 4.47% respectively for a 5- and 10-year lookbacks. These levels are achieved with a 0.21 Sharpe ratio and a 13.2 standard deviation, both measured on a 5-year basis. The Vanguard Total World Stock Index Fund (VT), which we use as a benchmark for HTY, achieves 11.42% and 10.26% trailing total returns for the same lookback periods with a much higher Sharpe ratio of 0.72 and a similar standard deviation of 15.44.
The vehicle has a 9.34% yield but currently overdistributes, with the real asset based yield closer to 4.7%. This high return of capital feature has resulted in an annual NAV give-up of around -5% in the past decade. We do not like funds with annual NAV give-ups of more than 1% because ultimately the dividend yield is just a marketing gimmick and long term buy-and-hold investors will pay up throughout time. The fund is currently trading at a massive premium to NAV of 7.2% with a 2.19 z-stat, while historically it has traded at discounts to par. Today’s level represents an extremely poor entry point, even if the global equities markets continue to rally. If you are a retail investor already owning the name then Hold, while new money entering the space would do well to just allocate to VT given the very poor analytics that HTY exposes long term versus the index.
Holdings
The fund holds the oil major Total (TTE) as its largest holding:
Holdings (Fund Fact Sheet)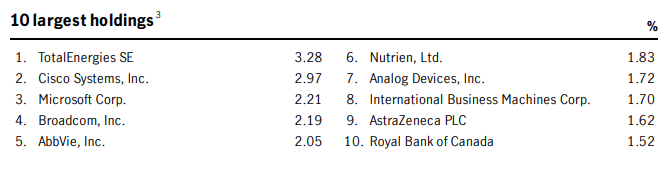
Although the largest fund holding is not U.S. domiciled, most of the fund names are U.S. companies:
Domicile (Fund Fact Sheet)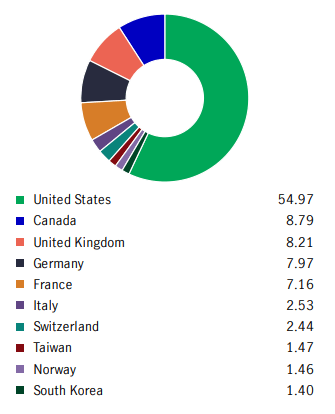
IT and Financials are the largest sectoral concentrations:
Sectors (Fund Fact Sheet)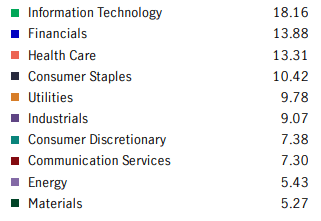
Although TTE is the largest name in the portfolio, the Energy sector is severely underweighted in the holdings matrix.
The fund exposes a very high portfolio turnover of 302%:
Turnover (Morningstar)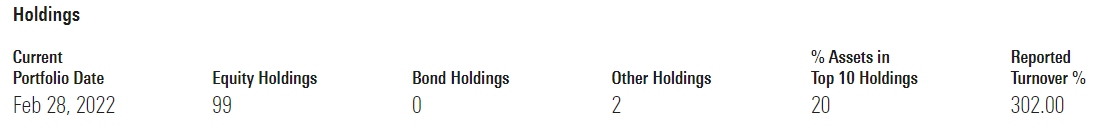
For true buy-and-hold names this is a substantial red flag. A very high turnover figure such as 302% indicates the propensity to time the market or even day trade, which are aspects that do not yield great results in the long term for CEF structures. We would like to see more stability here.
Performance
On a 1-year basis the fund has outperformed the global index Vanguard Total World Stock Index Fund:
1-Year Performance (Seeking Alpha)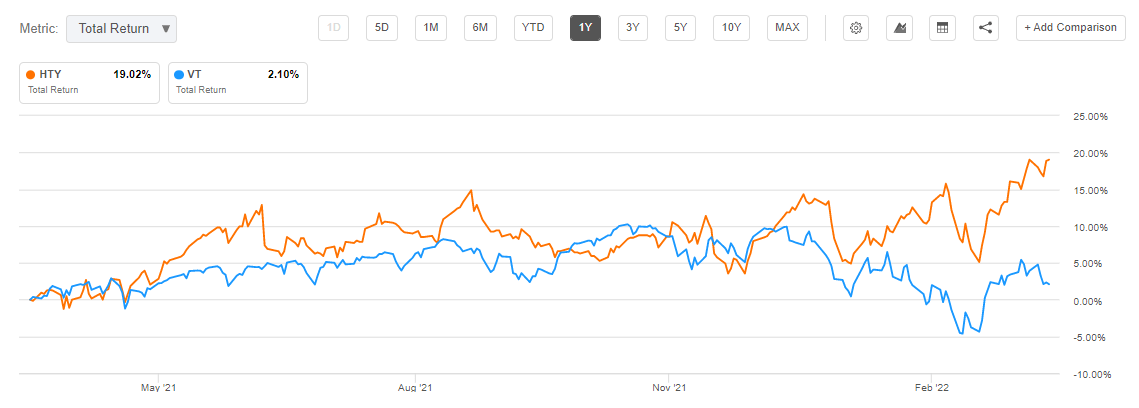
On a longer term basis the fund nonetheless underperforms the index substantially:
5-Year Performance (Seeking Alpha)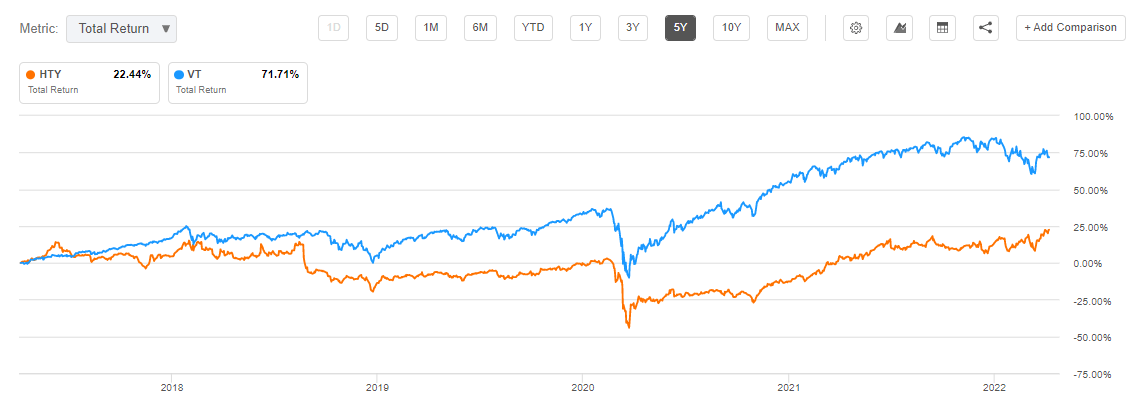
A 10-year chart paints a similar picture:
10-Year Performance (Seeking Alpha)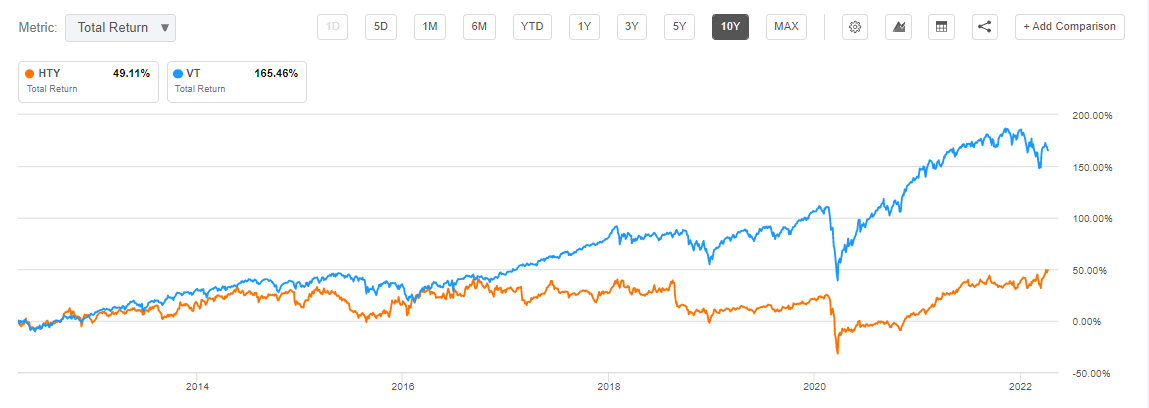
We can see that the fund only recently started outperforming the index, with longer term returns being much more modest:
Trailing Total Returns (Author)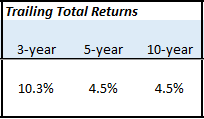
There is nothing in the fund’s performance that gives us a reason to buy this name versus the index outright. The CEF structure management fees should only inflict a small drag on performance throughout time and we would expect a good equity CEF to post 5- and 10-year trailing total returns closer to 9-10%.
Premium / Discount to NAV
The fund is currently trading at an astounding 7.20% premium to NAV when historically it has traded at discounts:
Premium to NAV (Morningstar)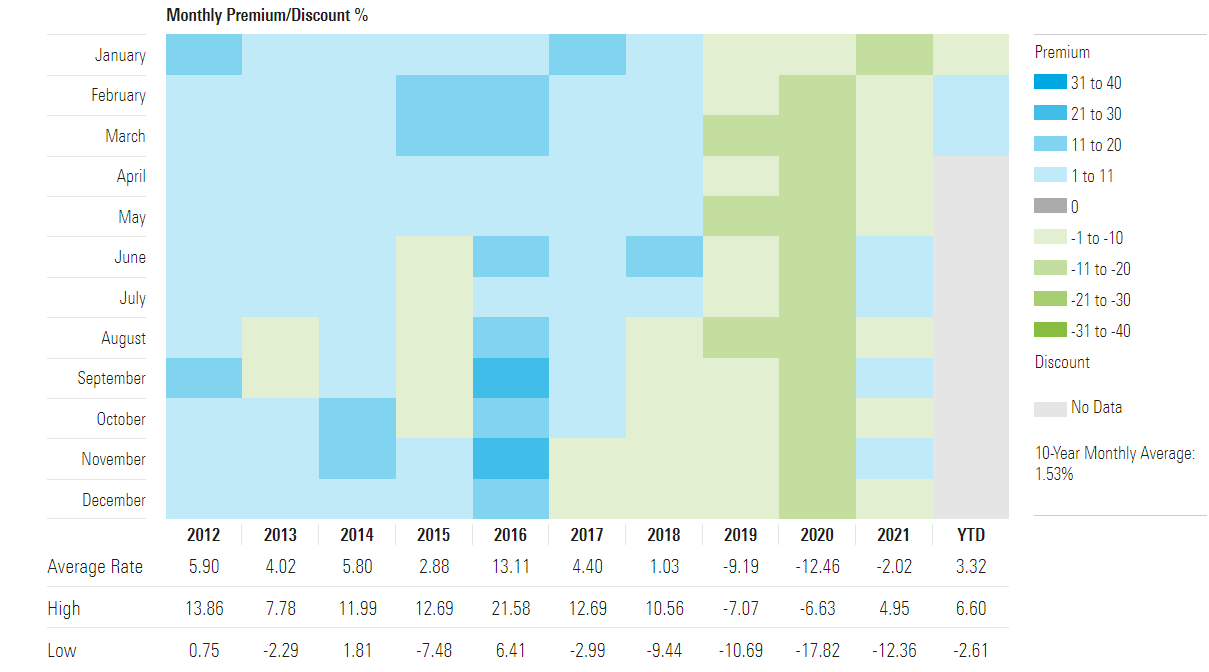
We can see from the above matrix that between 2018 and 2021 the fund mostly traded at discounts to NAV, the most severe ones during 2020. Even in the periods when the fund had a premium to NAV it only averaged 4%-5%, much lower than the current level of 7.2%.
What is interesting to note is that in the past year the price components have closely tracked the NAV, outside the current period starting February 2022:
Premium/Discount to NAV (CEFConnect)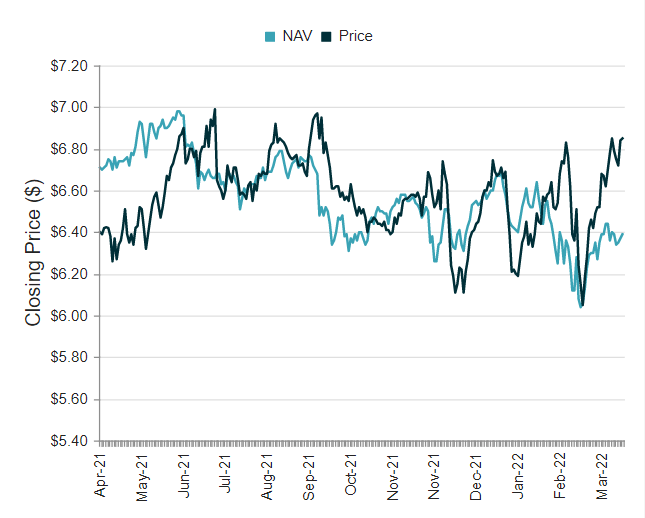
We expect a mean reversion here with the premium to NAV to fall to more normalized levels. We can see a similar historical occurrence from January to February 2022 when the premium to NAV spiked significantly, only to retrace its move.
Distributions
For the most recent reporting period we can see an astounding 74% return of capital figure:
Dec 2021 Section 19.a. (Section 19a)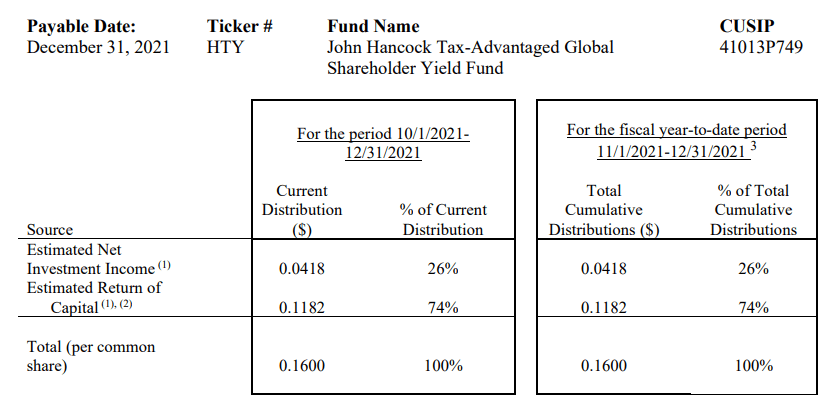
However, when looking at other historical reports we can see that actual ROC comes closer to 50%, which ties out with the data we see in terms of annual NAV give-up:
September Section 19.a (Fund Data)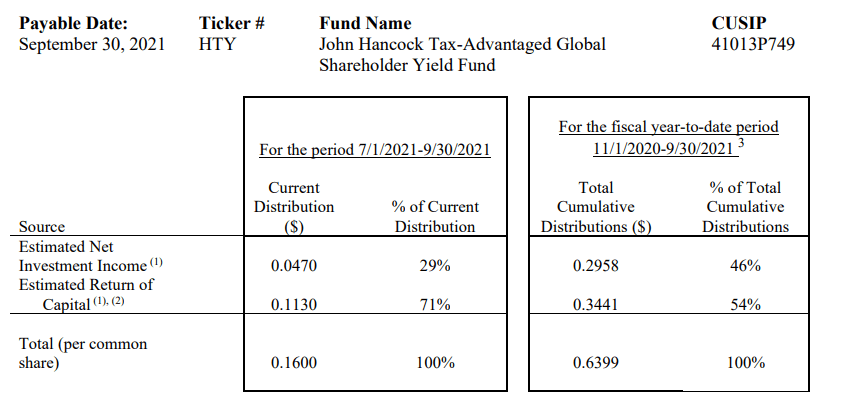
This is a fund that overdistributes significantly. We do not like to see annual NAV give-ups that exceed 1%, and this fund posts a 5% figure. In our opinion, we see these eye-popping dividend yields as a marketing gimmick by the management team to attract AUM. The fund currently has a $75mm level of assets under management.
Conclusion
HTY is a global equities closed end fund focusing on dividend paying securities and providing a 9.34% yield. The yield is unsupported, return of capital accounting for approximately 5% of that. The fund has robust 1-year returns but shows only modest 5- and 10-year returns with very poor risk/reward metrics. The fund is also currently trading at a massive premium to NAV of 7.2% while historically it has traded at discounts to par. If you are a retail investor already owning the name then Hold, while new money entering the space would do well to just allocate to VT given the very poor analytics that HTY exposes long term versus the index.
Be the first to comment