

Dilok Klaisataporn
What to wait for in 2023?
As I analyze many different sources every day – reports from investment banks, boutiques, research firms, and independent analysts – I am increasingly confronted with opinions that:
- Europe will not be able to avoid a recession in 2023;
- The USA will probably also experience a recession in 2023, but it will be much milder than in Europe;
- China is closing itself off to more and more foreign investors, especially Western ones, who will continue to withdraw funds from the country in large figures as soon as the opportunity arises (they’re “selling the rips”);
- Other emerging countries – especially Latin America (Mexico, Brazil, Chile), India and Indonesia – will receive a new influx of investment out of China, which will contribute to the real growth of their economies.
The above points are primarily about the stock market – the risky assets of developed markets will probably continue to show a downward trend in 2023, even from the time when the Fed’s interest rate reduction policy actually starts. And this was already the case during the last crisis in 2008 – at that time, the Fed’s interest rate hike cycle marked the beginning of a full-blown “bear market”, at the low point of which the SPX fell by 56%:
Taken from Twitter, data provided by Bloomberg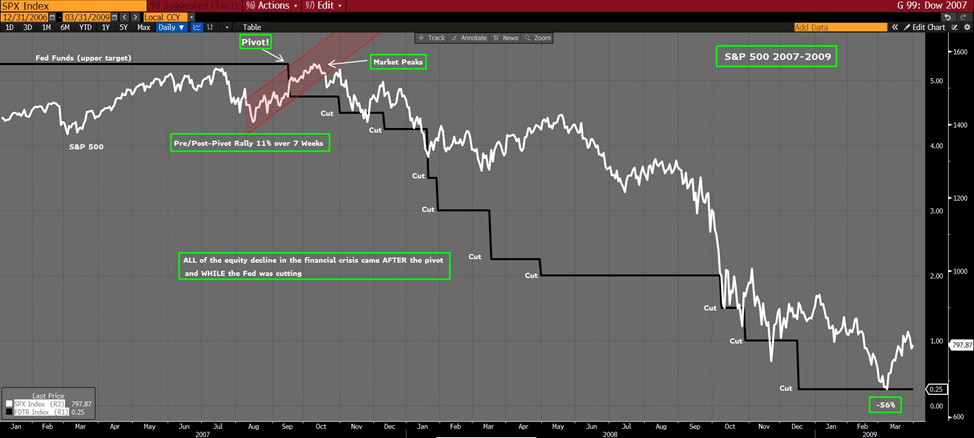
As you know, the 2008 depression was the result of the inflated mortgage market bubble that burst at the first sign of a slowdown in economic activity due to high debt levels. Today, we no longer see most of the conditions that became the trigger for that crisis. However, many leading indicators today suggest that unemployment in the U.S. labor market will rise thanks to a slowdown in the construction sector – the latest data on the supply of new homes points to a minimum doubling of the unemployment rate by 2024.
Jeff Weniger, WisdomTree Head of Equities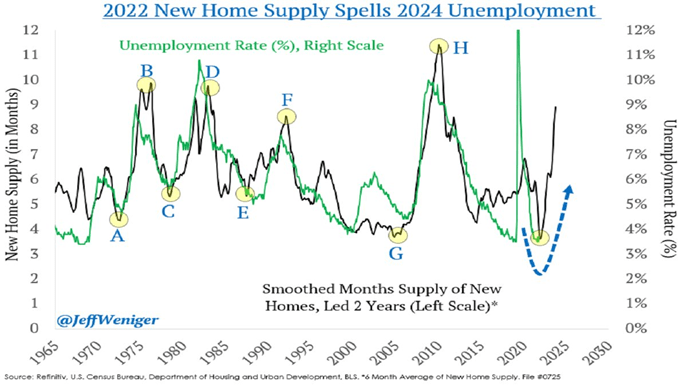
The NAHB Housing Index (black line) leads the unemployment rate trend (green line) by about 12 months. Under Sam’s Rule, a recession begins when the 3-month moving average of the unemployment rate rises more than 50 basis points from the previous 12-month low. Based on the current trend, I, therefore, expect the unemployment rate to double by the 2nd quarter of 2023.
Jeff Weniger calculated that in the pre-covid time the average mortgagee had to pay $507 per month (interest + principal). Today, due to rising interest rates, that amount is $1,721 – a 239% increase in just 3 years. This dynamic is gnawing away at the demand for new homes, which should eventually lead to a decline in new construction projects, and with 12% to 15% of the total U.S. labor force associated with this sector, unemployment seems inevitable.
Higher unemployment means lower purchasing power, which growth companies have relied on in 2020-2021 to attract investor money in IPOs and venture capital rounds. Since the beginning of 2022, their valuations have dropped 40-70% and it appears they have already factored in the coming decline in profits and growth rates.
However, Michael Kantro, chief investment strategist at Piper Sandler, disagrees with this conclusion. He argues that the stock market’s decline in 2022 was the result of problems in the bond market, which was shocked by the fastest rise in Fed interest rates in decades. Michael sees a large number of negative revisions to EPS estimates for most companies in the major U.S. indexes – this, he believes, is not yet priced in. I think this is especially true among representatives of growth companies and the technology sector.
The current state of affairs should result in a 10-15% decline in EPS by Q2 2022, concludes Alfonso Picacciello from The Macro Compass, a former portfolio manager of a huge bond portfolio at ING Bank. At least, that’s what his macro model, which he updated a few days ago, predicts:
The Macro Compass, November 23, 2022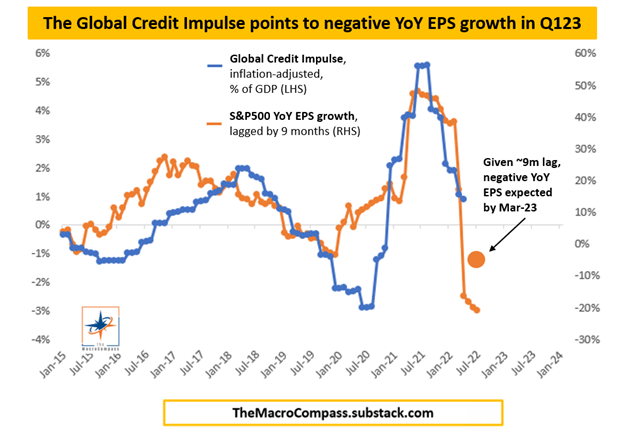
The U.S. Conference Board compiles a special index that includes the 10 most statistically significant leading indicators of the nation’s economy. Its track record in predicting recessions is quite solid: over the past 50+ years, every time this index showed a negative value for 2 or more consecutive months, a recession occurred with an average lag of 7 months. This trigger occurred in August 2022. So if we follow the “median trend” this time, the recession should occur somewhere in March 2023.
The Macro Compass, November 23, 2022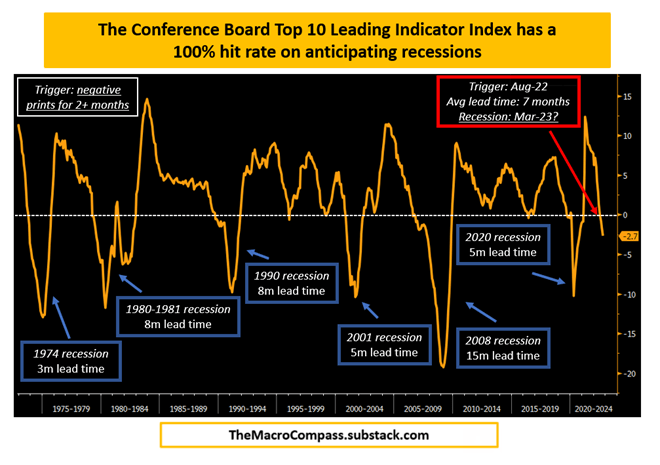
Analysts at Fundstrat Global Advisors came to a similar conclusion, but based on a different indicator – according to their regression model, the current value of the CEO Confidence Index should translate into a decline in EPS of around 10% (year-on-year):
Fundstrat Global Advisors, November 23, 2022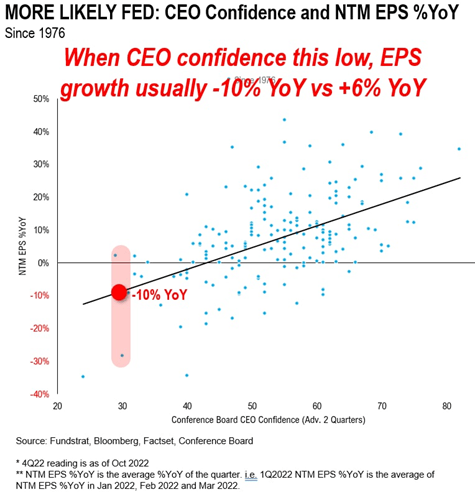
Most remarkably, these indicators continue to contract even though the S&P 500 Index has risen sharply again in recent days.
The main question is to what extent the macro indicators are now priced in
In my view, risky assets still do not take into account the growing risk of a sharp EPS drawdown in the first quarters of 2023, as described above.
Consensus forecasts agree that EPS and GDP growth will indeed slow down, and bond markets have priced in a slight widening of credit spreads. At the same time, the market expects the Fed to cautiously cut rates by about 50 basis points in the 2nd half of the year (2023). In other words, as Alfonso says, the markets’ line of thinking is correct, but the assessment of the consequences for these markets is wrong.
By analogy with 2001, when the Fed reversed its rate hike and saved the economy after tightening monetary policy in 2000, 2023 should also reflect the massive transition from monetary and fiscal tightening a year earlier (2022). Here are the assets that generated real returns in 2001 which 2023 could look like:
The Macro Compass, November 23, 2022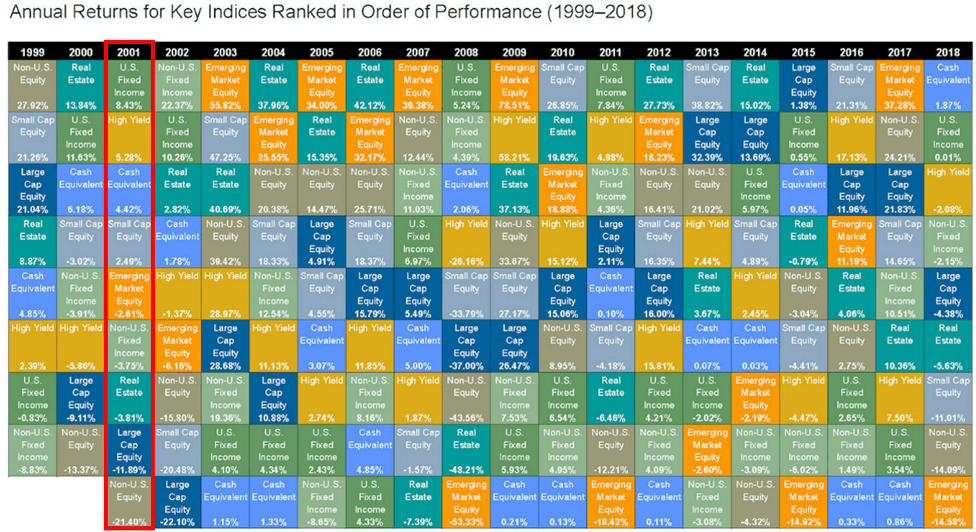
That is, when the Fed “flipped” in 2008, the stock market (Large Cap Equity, table above) could not resist the 2001 turnaround and corrected another 12% (YoY). A year later, in 2002, that decline nearly doubled, and the dominance of Treasury bonds (and blue-chip corporate bonds) intensified even further.
BofA analysts come to much the same conclusion in their latest report [Year Ahead 2023 report], published a few days ago:
We stay bearish risk assets in H1, set to turn bullish H2as narrative shifts from the inflation and rates “shocks” of 2022 to recession and credit “shocks” in H1 2023, then bullish “peak” inflation, Fed, US$ in H2 2023; recession… long bonds in H1 2023, maintain SPX nibble at 3.6k, bite at 3.3k, gorge at3.0k entry points; Fed rate cuts… long stocks and credit in H2 2023.
Source: BofA, November 22, 2022
Morgan Stanley seems to agree with BofA:
MS, November 13, 2022 [author’s notes]![MS, November 13, 2022 [author's notes]](https://static.seekingalpha.com/uploads/2022/11/26/49513514-166945163297929_origin.png)
Positioning for 2023
In my view, the ideal thing to do now would be to accumulate cash via conservative instruments (alternative hedge funds or fixed-income investments) to ensure an absolute return that, adjusted for inflation, is likely to be positive (I believe it already passed its local peak a few months ago).
There are exceptions to this rule, however, namely individual names among small- and mid-cap companies (“value stock”) that a) will continue to generate growing free cash flow or b) have a unique characteristic. We believe some of our stocks [in the model portfolios of Beyond the Wall Investing] remain undervalued by at least 30-40% despite recent growth. This is the type of company I try to find and study in-depth for Seeking Alpha readers.
If we are talking about tactical positioning, as is common among institutional investors, then I would suggest beating the “long bonds, short stocks” idea by constructing +3x (IEF) versus -1x (SPY) – i.e. long 3 units IEF versus short 1 unit SPY. Alfonso Picacciello from The Macro Compass gave this idea on October 22 and since then the trade brought +5.29% – more to come in 2023, in my view:
YCharts, author’s notes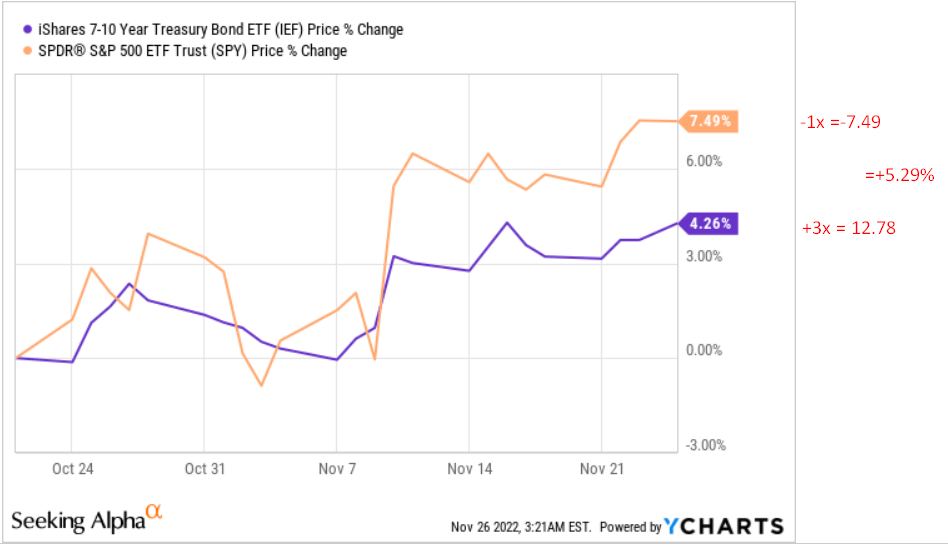
Thank you for reading!
Be the first to comment