

oatawa/iStock via Getty Images
US stocks (SPY) have had their worst first half in more than 50 years.
For the Nasdaq (QQQ), it was the worst first half ever.
S&P 500 Performance in first six months each year (The New York Times)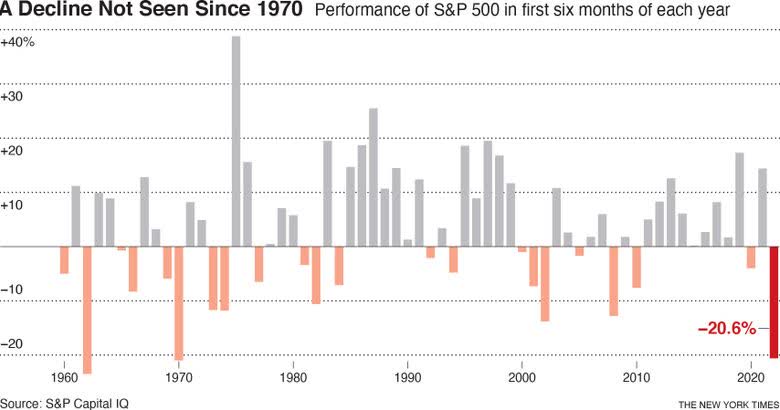
According to the American Association of Individual Investors, bearish sentiment has been at its highest since the Great Recession in the past few weeks.
In this context, many individual stocks are down 40%, 60%, or even 80% from their previous high. In addition, most companies that went public in the past three years are hitting all-time lows, regardless of their earnings since IPO.
It can become increasingly hard to manage a portfolio in a time like this.
With many stocks cut in half, most positions can look like big losers — especially if you only started investing recently.
What’s a big loser? I’m talking about stocks that significantly underperform the index in your portfolio. You know the ones.
- How do you know if you are holding a broken business or a broken stock?
- Are you a bag holder or simply suffering a temporary setback?
- When is it time to call it quits and sell your position?
Let’s review.
The odds of having a big loser
To appreciate your odds of success in the stock market, one of the most impressive research pieces I came across over the years is the work done by Blackstar Funds via Meb Faber.
They have reviewed the historical distribution of 8,000 stocks trading on the NYSE, AMEX, and NASDAQ over 23 years (1983-2006).
The takeaways are fascinating:
- 2 out of every 5 stocks are money-losing investments.
- 1 out of every 5 stocks is a terrible investment (losing 75% or more).
Lifetime Returns of 8,000 stocks over 23 years (Blackstar Funds)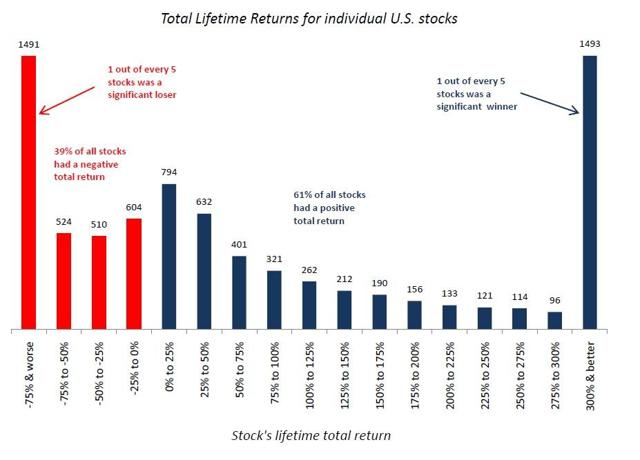
Looking more specifically at individual stock returns compared to the Russell 3000 index, other conclusions emerge:
- Most stocks can’t keep up with a diversified index (64% under-performed the Russell 3000 during their lifetime).
- 4% of stocks underperformed the index by 500% or more.
Total returns of individual stocks vs. Russell 3000 index (Blackstar Funds)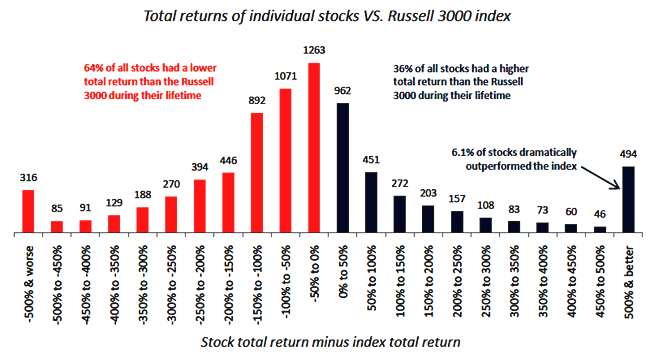
About two-thirds of stocks underperform the index. As a result, if 40% of your investments beat the index, you are already an above-average investor.
Two essential factors will drive your returns:
- Batting average: The percentage of your stock selection beating the market. Again, anything above 36% is already above average.
- Slugging percentage: The average gain on your winning investments, divided by your average loss on your losing trades.
Realizing that even legendary investors are wrong about half the time is an essential step in any investing journey. However, what truly matters is the slugging percentage.
The outliers — the stocks that beat the market by 500% or more — are the core drivers of the indexes’ performance. They compensate for the losses generated by the majority of the market. Conversely, missing them can lead to dramatic underperformance, leading many investors to embrace passive investing via mutual funds or broadly diversified ETFs.
The top five stocks in the S&P 500 — consisting of Apple (AAPL), Microsoft (MSFT), Alphabet (GOOG) (GOOGL), Amazon (AMZN), and Tesla (TSLA) as of this writing — have been among the main drivers of the market returns over the past decade.
Let’s assume a 20-stock portfolio with a mix of investments spread evenly on the returns distribution charts above over 23 years:
- 13 stocks would underperform the index.
- 8 of them would lose money.
- 5 of them would drop by 50% or more.
- Only 1 stock would dramatically outperform the index.
The return distribution of equities illustrates how a few winners can offset the losses driven by the majority of a portfolio. Winners compounding to a more prominent position are a portfolio’s primary source of alpha. Losers are, on the other hand, merely a fact of life.
You might already own a few big winners right now, even though they may be beaten down in this bear market. However, you have no way to know which ones. The solution to this problem is straightforward: don’t sell any of them.
The distribution of stock returns also illustrates why I would rather own too many stocks than too little:
- Many investors believe owning too many stocks leads to only matching market returns. However, I’m sure it doesn’t sound like such a bad outcome in the current challenging macro environment.
- Owning only a few stocks cuts both ways. If only 1 in 20 stocks is supposed to drive the returns of the entire portfolio, the odds look pretty bleak if you only own 5 or 10 stocks. What if there is no outsized winner among these stocks? That’s not a position I would want to be in.
My conclusion from this research has been driving my investing philosophy:
- A small number of outstanding performers drives the alpha.
- Accept that you’ll have many losers. Probably about half of your picks.
- Don’t sell your winners. Instead, add to them over time.
This approach has helped me hold strong even when trimming some of the best performers in the App Economy Portfolio could have been tempting. Moreover, since portfolio inception at the end of 2014, it has helped me keep a long-term perspective and favor a passively active strategy.
The premise is simple: staying away from leverage, the maximum you can lose is 100% of your principal. However, there is no ceiling to how much you can gain.
The return distribution chart shows the many losers at the bottom of my portfolio. However, a few winners such as The Trade Desk (TTD), Advanced Micro Devices (AMD), Apple (AAPL), MongoDB (MDB), HubSpot (HUBS), and Amazon (AMZN) have driven most of the alpha in my portfolio.
App Economy Portfolio Return Distribution as of July 2022 (App Economy Insights)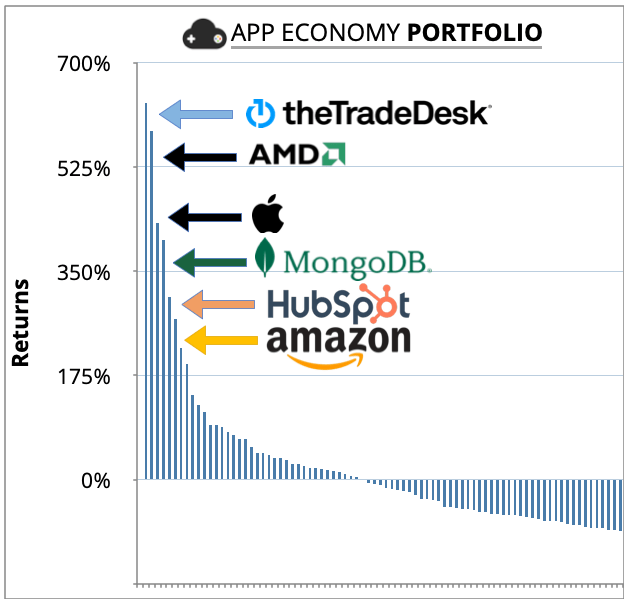
If you let your winners run, a market-beating portfolio will look like this after 7+ years. Countless losers at the bottom, more than offset by the top performers.
I’ve previously covered the benefits of letting a portfolio concentrate over time through its sheer performance. It resembles the way VCs invest in individual companies. They have a diversified approach with investments in many start-ups. But their performance is driven by the few of them that turn into unicorns.
A broken stock is not a broken business
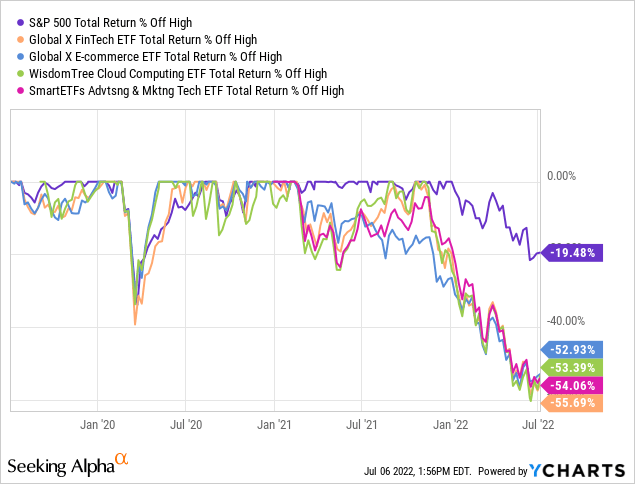
If you have invested in fast-growing categories benefiting from COVID tailwinds, the returns have been catastrophic in the past year.
Let’s look at the drawdowns from the previous high using various benchmarks:
- Fintech (FINX): -56%.
- E-commerce (EBIZ): -53%.
- Cloud computing (WCLD): -53%.
- Ad-tech and mar-tech (MRAD): -54%.
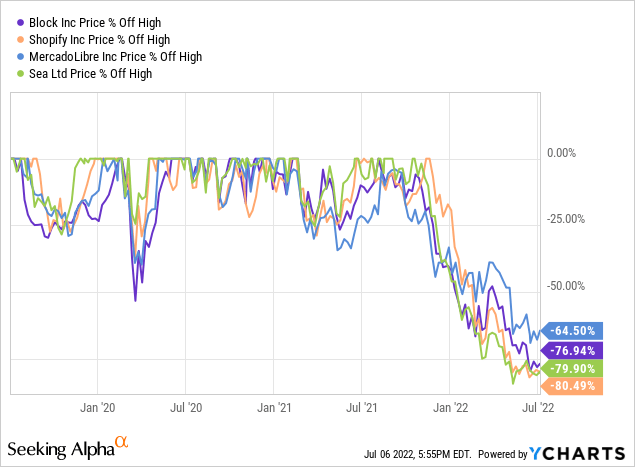
Stocks tend to fall in unison with the rest of their category. For example, look at stocks like Block (SQ), Shopify (SHOP), MercadoLibre (MELI), and Sea Limited (SE).
In my article about What It Takes To Hold Winners, I illustrated the heart-wrenching drawdowns we have to deal with if we plan on holding individual stocks over multiple business cycles.
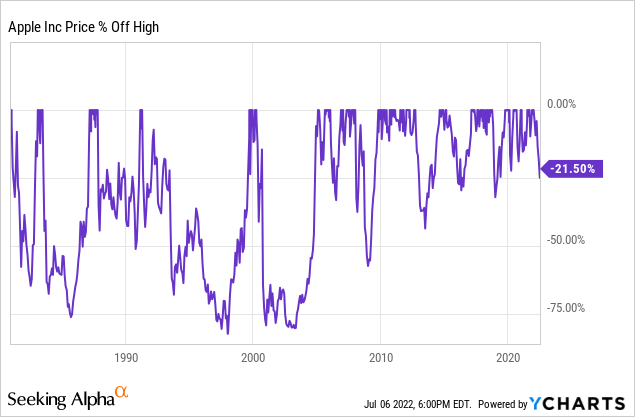
Take Apple in the past 40 years:
- The stock fell more than 75% from its previous high several times.
- In January 2009, the stock fell more than 60%.
- In January 2019, a year before COVID, AAPL was trading almost 40% down from its previous high due to tariffs on Chinese goods and lower revenue guidance.
- Today, the stock is down more than 20%, in line with the S&P 500.
Morgan Housel puts it perfectly:
“The whole reason stocks tend to do well over time is because they make you put up with stuff like this. It’s the cost of admission.
A feature, not a bug.”
So if large drawdowns affect all stocks (including the biggest winners), a sell-off cannot possibly be a reason to sell. Otherwise, you would eventually be guaranteed to part ways with all of your investments at the worst possible time.
If price movement cannot educate our investing process, we need to shift our attention to the fundamentals.
Re-assessing the thesis
Setting aside market sell-offs and sector rotations, a stock usually underperforms for a reason.
It’s critical to Know What Game You’re Playing and distinguish noise from signal. Not all negative headlines are worth discussing. Some may have nothing to do with the sustainability and long-term potential of the business.
There are three ways to handle an investment turning against us:
- Buy more (possibly due to a blinding conviction).
- Hold until you can gather more information.
- Sell (possibly due to an emotional reaction).
There is always a risk of making a decision and then working backward to justify it. It’s a natural tendency called confirmation bias.
Netflix (NFLX) is one of the worst-performing stocks in the S&P 500 this year. If you are a Netflix shareholder, you likely had to go through this decision process earlier this year.
Brad Slingerlend of NZS Capital offered six steps to gain perspective, using the collapse of Netflix as an example:
- Assume that you don’t own the stock. Try to dissociate from the investment and think as if you analyzed it for the first time.
- Update the thesis. Why would you want to own the stock today?
- Identify the broad prediction. Are you still directionally correct (e.g., the secular shift to streaming)?
- Identify the narrow prediction. Are current circumstances still favorable (e.g., price hikes, ad-platform potential, games, password crackdown)?
- Assess the margin of safety based on valuation. How right do you need to be for the investment to work out?
- Work through the pre-mortem scenarios. Assume success or failure, and work backward to imagine what may have caused it.
Brad’s steps have the benefit of defining the range of outcomes. It makes us review the opportunity with a fresh pair of eyes.
Luck is an essential factor in investing, and this exercise forces us to recognize ahead of time what we can and cannot know today.
I always loved the idea of being directionally correct. So many things can go right or wrong, and we tend to overestimate our capacity to anticipate the unforeseeable. Identifying what makes us a shareholder today is how we can decide confidently if the thesis is truly broken when the time comes.
Ultimately, position sizing should reflect our degree of certainty. The more things have to go right for the stock to deliver strong returns, the smaller the position should be. Conversely, the fewer assumptions we need to make about the future for the thesis to work out, the larger the position can be.
And, of course, if the six steps above show that the investment doesn’t work anymore, we have to accept and let it go.
I love this analogy by Charlie Munger:
Life, in part, is like a poker game, wherein you have to learn to quit sometimes when holding a much-loved hand—you must learn to handle mistakes and new facts that change the odds.
Know when to hold them, know when to fold them.
Two truisms and a lie
David Gardner often mentions two numerical claims you’ll hear analysts and investors make about past market crashes.
Truism 1) If you bought stocks at the peak, it took you ____ years to get back to even.
This type of observation might make you feel like you shouldn’t invest because the risk of facing one or two “lost decades” is not worth it.
However, this reasoning is inherently flawed because it assumes that you somehow dumped all of your money in the stock market at its peak and then did nothing for the entire time it took for the index to return to the previous high.
No one invests like this.
What happens if you are a net buyer of stocks over the years?
You invest both at the peak, the trough, and everywhere in between. As a result, it takes much less time to be back to even than a market chart seems to indicate. That’s the power of dollar-cost averaging.
Truism 2) When a stock falls 50%, it has to double to get back to even.
The chart below shows the amount a stock must rise after a drop to return to the breakeven point.
| Percentage Loss | Percent Rise To Break Even |
| -10% | +11% |
| -20% | +25% |
| -30% | +43% |
| -40% | +67% |
| -50% | +100% |
While the statement above is mathematically correct, it’s not a helpful way to look at returns. Movements 50% down can be just as common as movements 100% up. A double might sound like a daunting task in the short term, but there is nothing exceptional or unusual about a stock doubling, especially over multiple business cycles.
Even the best-performing stocks will drop 50% or more at some point. The fact that they need to double or more to get back to an all-time high is somewhat irrelevant. It gives the illusion that such a performance is unlikely or a distant dream.
A lie: I saw it coming!
As investors, we all tend to attribute good outcomes to our skills and bad outcomes to sheer luck.
So when it comes to big losers, it’s very tempting to re-write the story.
We choose how to explain the cause of an outcome based on what makes us look best. Unfortunately, this type of bias limits our ability to learn from our mistakes.
Maybe you caught yourself thinking, “I knew it all along!” We tell ourselves that we saw things coming, even when observing unforeseeable events.
Hindsight bias can be very damaging over time since it can:
- Prevent us from learning from experience (I did nothing wrong!).
- Cause us to wrongly assign blame (I couldn’t have known!).
- Cause us to judge others too harshly (they only have themselves to blame!).
- Cause us to be overconfident (perceived vs. actual performance).
There is no learning if you shift the blame on others or the market. So the most critical step is to identify what you knew and whether or not you could/should have made a different decision at the time.
- Sometimes you win.
- Sometimes you learn (if you are willing to be vulnerable).
- And sometimes, you lose (if you are willing to accept it).
Handling big losers starts with humility.
Losers don’t have to be big
As a basketball fan, I’ve often heard, “the best offense is a good defense.” That’s how many teams win championships.
In investing, having a well-thought-out defensive plan is how you keep losers in check and avoid irreparable losses. In addition, a clearly defined strategy is the only thing protecting you from emotional reactions.
I’ve defined “big” losers as stocks that significantly underperform the index over the years. Their underperformance is big. However, their adverse impact on your returns doesn’t have to be significant.
If you stay away from leverage, the damage a stock can do to a portfolio always comes down to position sizing.
In my article about 4 Simple Rules to protect your portfolio, I cover two rules that pertain to managing the size of losers.
Rule #2 is “define your max allocation to a stock:”
One of the easiest ways to avoid being carried away by your own convictions is to cap your maximum exposure to a single company from a cost-basis perspective. What really matters is not so much the number of stocks you own, but rather the largest amount you are letting yourself add to a given stock.
Rule #3 is “don’t add to your losers:”
Leaving your losers well below the maximum allowed could make a critical difference over time in your portfolio construction and its resulting performance.
Letting yourself average down all the way to your maximum allocation on all your losers is how you end up with a well-balanced portfolio… of losers. Not a great proposition, if you ask me.
It’s perfectly natural to be willing to add to losing positions because of this illusion that they will quickly recover to our initial cost basis. Yet, avoiding this practice can virtually guarantee that your losers will remain infinitely small. They should all lie at the bottom of your portfolio, with little funds added to them and little impact on your overall returns.
If you have done the above right, you won’t have a “big” loser. At least not one that would compromise your long-term portfolio returns.
If your starting position is relatively small and you don’t add to losing positions, big losers that are down 80% are likely to represent a small allocation in your portfolio. As a result, there is no urge to reallocate the position, and the selling strategy can be focused on tax-loss harvesting when applicable.
Buying or selling is a false dichotomy
Charlie Munger explained:
The big money is not in the buying and selling… but in the waiting.
Losers are inevitable, but they can be kept in check with diversification and proper portfolio strategy. If you have designed a stringent buying strategy, you don’t need a fancy exit strategy. Losers take care of themselves and become smaller over time.
Too often, investors lean toward action when they should lean toward inaction. Portfolios have a way of taking care of themselves if you let them. As they underperform, big losers become infinitely small.
This natural selection process is not something you have to tinker with. You don’t need to have an opinion on Meta (META) or Netflix (NFLX) every day of the week. You can also accept their underperformance and let the story play out. The market has its ways of adjusting your position size, eventually.
What about you?
- Do you have big losers in your portfolio?
- What would you do differently based on what you know today?
- How do you manage underperforming positions?
- How do you separate a broken stock from a broken business?
Let me know in the comments!
Be the first to comment