

da-kuk/E+ via Getty Images
The best portfolio is one where all assets have equal risk. Using equal risk takes away the need to decide which asset will outperform the others. It also maximizes diversification.
To create this balanced portfolio, we need to measure the risk of each asset. That is done differently for equity and futures traders:
- Equity traders use the annualized volatility, preferred by financial analysts
- Futures trades use volatility parity, based on the average true range, considered the best measure for many applications
I will show how to calculate these two methods, then apply them to a portfolio of stocks or futures. From that, we can see how much cryptocurrencies to trade to have a risk-balanced portfolio.
Adding Cryptocurrencies
Most cryptocurrencies (“cryptos”) do not have a long trading history, so we will look only at the last six years for equities. We will compare the volatility of cryptos and crypto exchanges to see how they need to be balanced when added to a portfolio.
Futures have a much shorter history, but we will see how the volatility (therefore, the risk) of futures contracts for Bitcoin (BTC-USD) and Ethereum (ETH-USD) compare with futures for the S&P 500 (SPY) and Nasdaq (QQQ).
We know from watching crypto price moves that they are more volatile than the average stock or equity index, so we expect to need fewer shares or contracts to have the same risk in our portfolio.
Eye-Balling Volatility
Figure 1 shows the price history of SPY and QQQ from 2017 and Figure 2 shows the price history of BTC-USD for the same time period, both have been adjusted to 100 on January 4, 2016. SPY gains 150% to a NAV of 250, QQQ gains 250% to 350, and BTC gains 44,900% to about 45,000. Quite a difference.
Figure 1. Price history of SPY and QQQ from 2016. (Data source: CSI)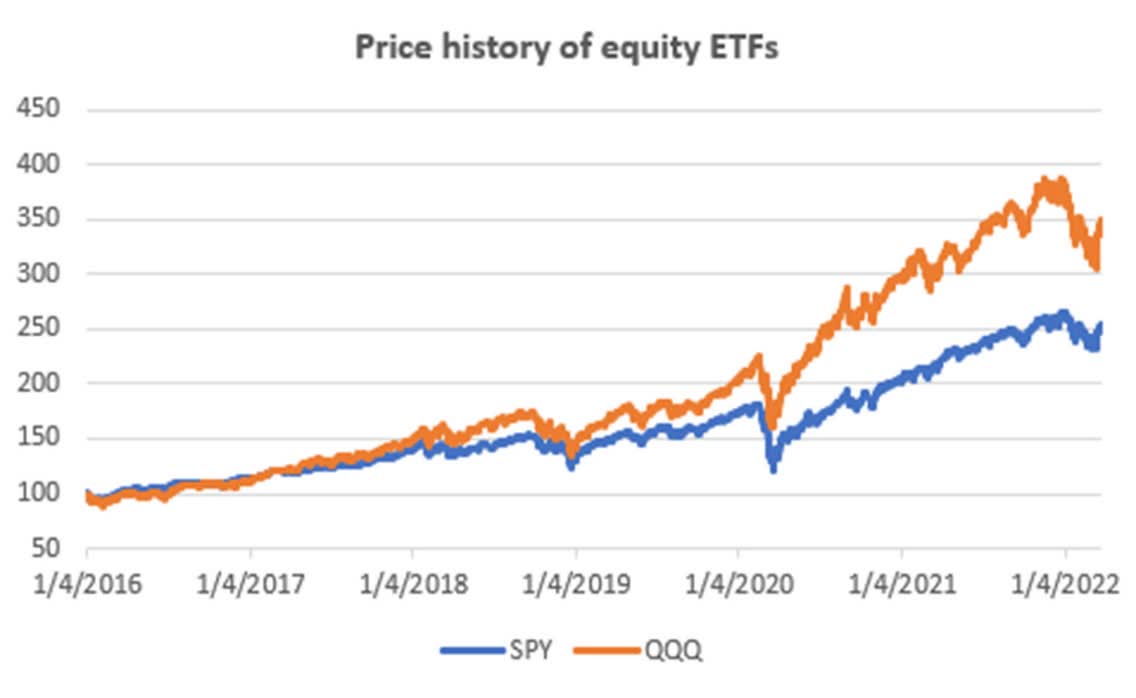
Figure 1. Price history of SPY and QQQ from 2016 (Data source: CSI)
Figure 2. BTC-USD from 2017 showing recent volatility. (Data source: CSI)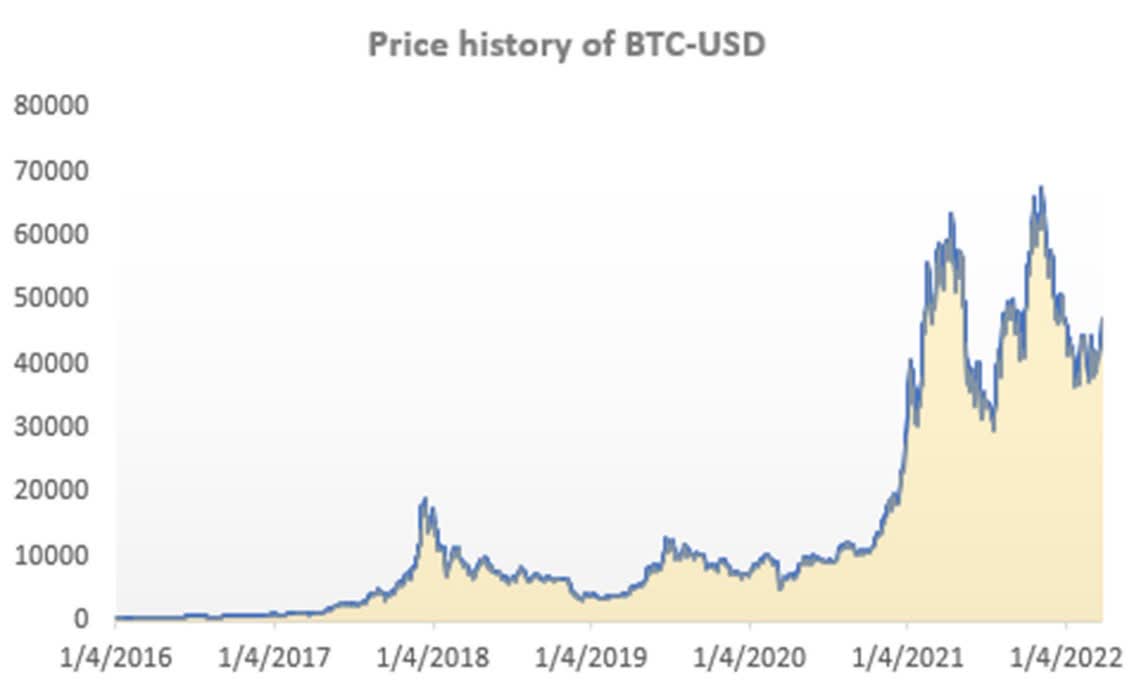
Figure 2. BTC-USD from 2017 showing recent volatility. (Data source: CSI)
Clearly, BTC-USD is more volatile. But the chart can be deceiving because the daily ranges get bigger when prices are higher, but not on a percentage basis. To show that, we plot the BTC-USD prices on a semi-log scale, where the price is on a log scale (a percentage) but the time scale remains the same. Figure 3 shows that the price fluctuations are more uniform and smaller (in percentage terms) at the higher prices.
Figure 3. BTC-USD shown on a semi-log scale. (Data source: CSI)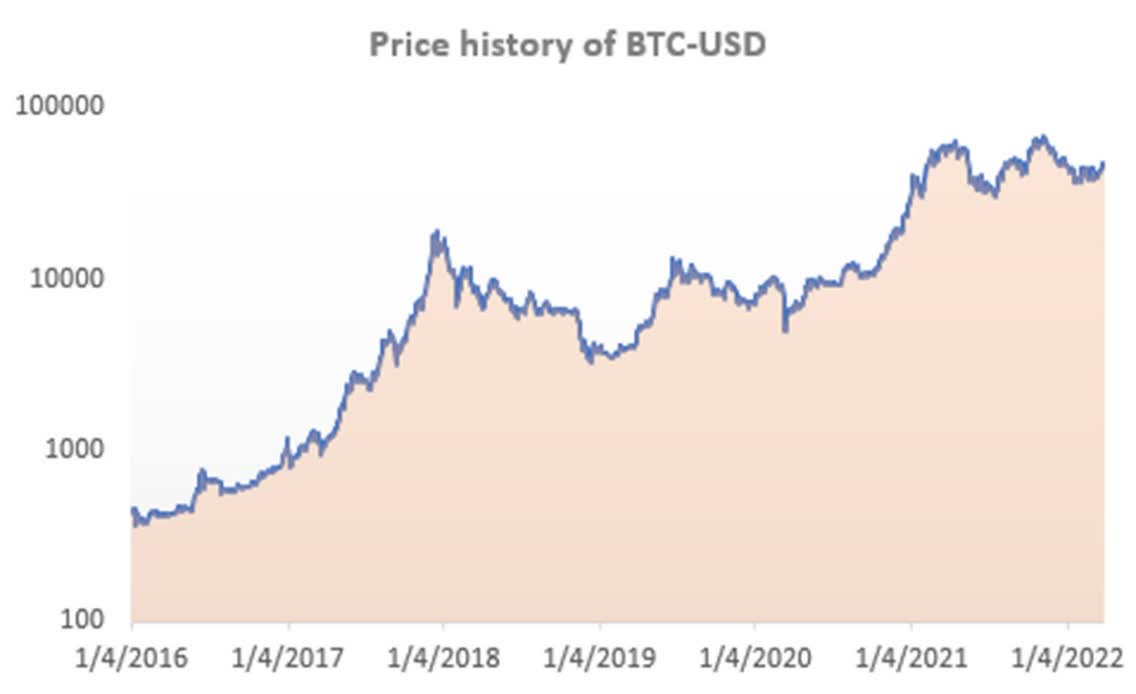
Figure 3. BTC-USD shown on a semi-log scale. (Data source: CSI)
Seeing the percentage changes is important to understand the final portfolio allocations. They may not look as extreme as you might first expect.
Equity Volatility
When trading cryptos, volatility means risk, and cryptos are very volatile, as you have seen in Figure 2. We will use the average annualized volatility of SPY and QQQ as our benchmark and assume that many investors have a combination of regular and tech stocks in their portfolios. Figure 4 shows that QQQ is more volatile than SPY but they both have similar patterns. The average volatility of the combined SPY-QQQ portfolio is 0.163, or 16.3%.
Figure 4. Annualized 20-day volatility of SPY and QQQ. (Data source: CSI)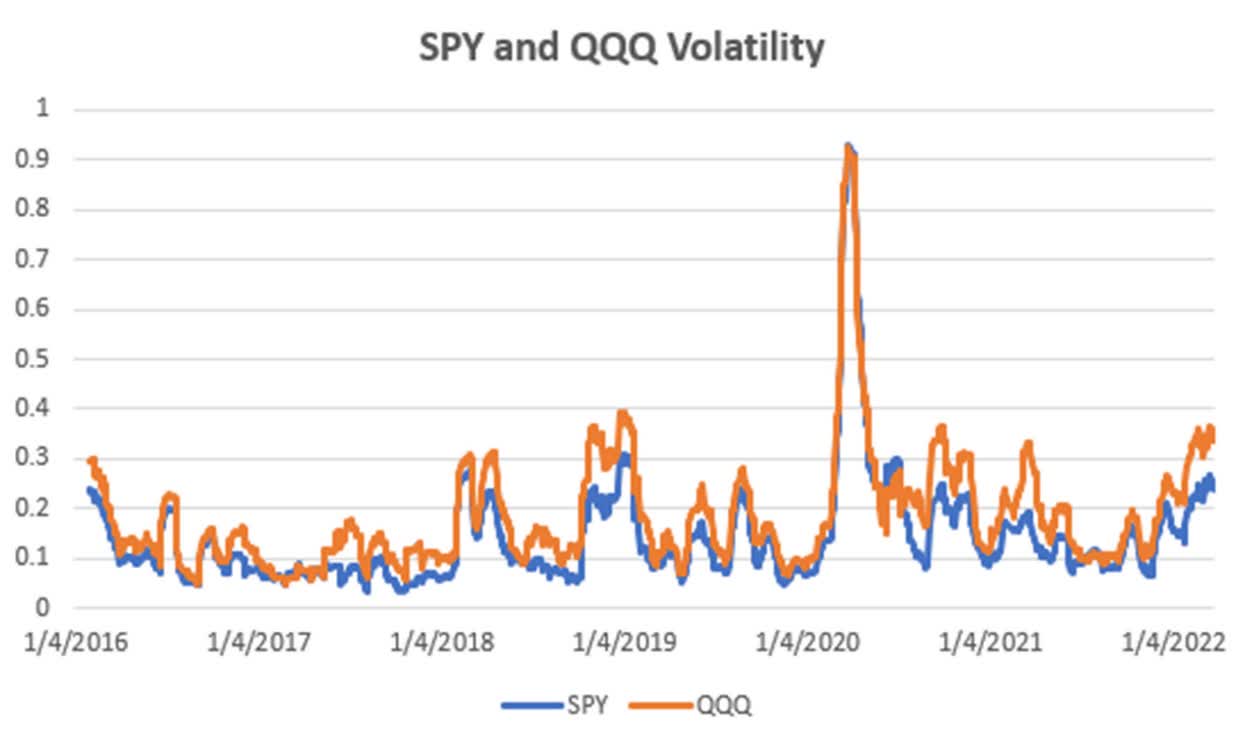
Figure 4. Annualized 20-day volatility of SPY and QQQ. (Data source: CSI)
Annualized Volatility
For equities, we use the 20-day annualized volatility (“AVOL”). It is the way financial analysts calculate risk and the way VIX volatility is calculated.
The calculation for annualized volatility is the standard deviation of the past 20 day returns times the square root of 252. In Excel that would be
AVOL = STDEV(C3:C22)*SQRT(252)
where column C holds the daily price returns, Close(n)/Close(n-1) – 1 and the square root of 252 changes the daily values to annualized.
If AVOL is 16% for the SPY-QQQ combination, and BTC-USD is 67.1%, then dividing 16 / 67 gives 23.9%. You would trade only $2,300 worth of BTC-USD for every $10,000 of your SPY-QQQ position. About one-quarter of the value.
Crypto Exchanges
Equities have both cryptocurrencies and crypto exchanges that can be traded. The most active exchange is Binance (BNB-USD), with Coinbase (COIN) gaining popularity. Using the same volatility measure, Figure 5 shows the 6-year history of volatility.
Figure 5. Volatility of crypto exchanges. (Data source: CSI)
Comparing Volatility
Getting the right balance of cryptos in your portfolio is going to reduce risk. Let’s look at the comparable position size you would get by combining a SPY-QQQ portfolio with either BTC-USD or a crypto exchange. Figure 6 shows that the combined SPY-QQQ has a volatility of 16.3%, much lower than any of the crypto-related markets.
If we reverse the ratio, we find that for every $10,000 invested in SPY-QQQ, we should invest 24% of that, or $2,400 in BTC-USD. Similarly, we would invest 26% in COIN and 16% in BNB-USD.
Figure 6. Relative volatility of BTC-USD, COIN, and BNB-USD compared to an average of SPY and QQQ. (Data source: CSI)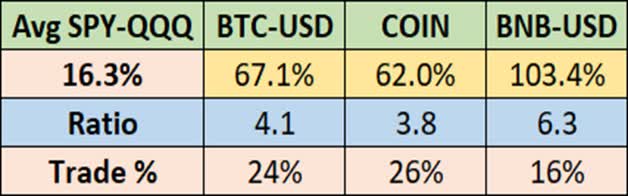
To prove that these position sizes work, we calculated the returns of the four markets in Figure 7 from the beginning of 2021. We will hold $100,000 of SPY, $24,000 of BTC-USD, $26,000 of COIN, and $16,000 of BNB-USD. The position sizes are determined on the first day of trading. BNB-USD outperformed the other markets and is shown on the right scale. It did, however, have a similar pattern.
Figure 7. Returns of sample equity markets using volatility-adjusted position sizes. (Data source: CSI)
Futures Markets
Now let’s look at the volatility of BTC-USD (equities) and the two futures markets, BTC and Ethereum (ETH). Figure 8 shows that BTC-USD has been the most volatile, at an average of 67%, but Ethereum, which has only a short amount of data, has shown a higher volatility of 84%. BTC futures have been less volatile as can be seen during the spikes of 2019 and 2020. BTC futures have an average volatility of 50%.
Figure 8. Volatility of Bitcoin compared to the futures markets for Bitcoin and Ethereum. (Data source: CSI)
We cannot use the calculation for annualized volatility for futures because the data is back-adjusted. The prices you see are not the prices at the time; therefore, the returns would be wrong. Instead, we use the average true range, similar to the daily high-low range, to define volatility.
Volatility Parity
Volatility parity is a more accurate measure of risk because it uses the high and low prices while annualized volatility uses only the closing prices. It is commonly used for futures position sizing. Its calculation is
VP = Allocation / (20-day ATR x contract size for futures)
If you have 10 markets in your portfolio, divide your equity by 10 to get the allocation, and divide the allocation by the average true range (“ATR”) times the contract size. For BTC futures, the size is 5, for Ethereum 50, for the S&P 25, and for Nasdaq 20.
To get the average true range you need to calculate the true range, which is the daily high-low range extended to the previous closing price when there is an unfilled gap. If columns C, D, and E have the high, low, and closing prices, then
True range (“TR”) F3 = MAX(C3-D3,C3-E2,E2-D3)
And the 20-day average true range is
ATR = AVERAGE (F22:F3)
Having done that, we get the values shown in Figure 9. For every 10 contracts of S&P futures, we would trade 2.75 contracts of NQ, 1 of BTC, and 1.25 of ETH.
Figure 9. Relative volatility of futures using volatility parity. (Data source: CSI)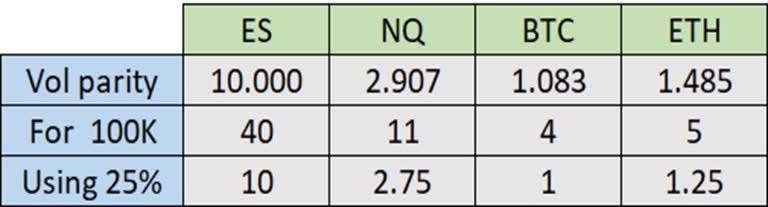
Verifying Volatility Parity
Again, we will verify our results by charting the returns of these futures markets using the position size determined by volatility parity. Figure 10 shows those results. All four markets have similar patterns and similar volatility.
Figure 10. Returns of futures markets using volatility parity. (Data source: CSI)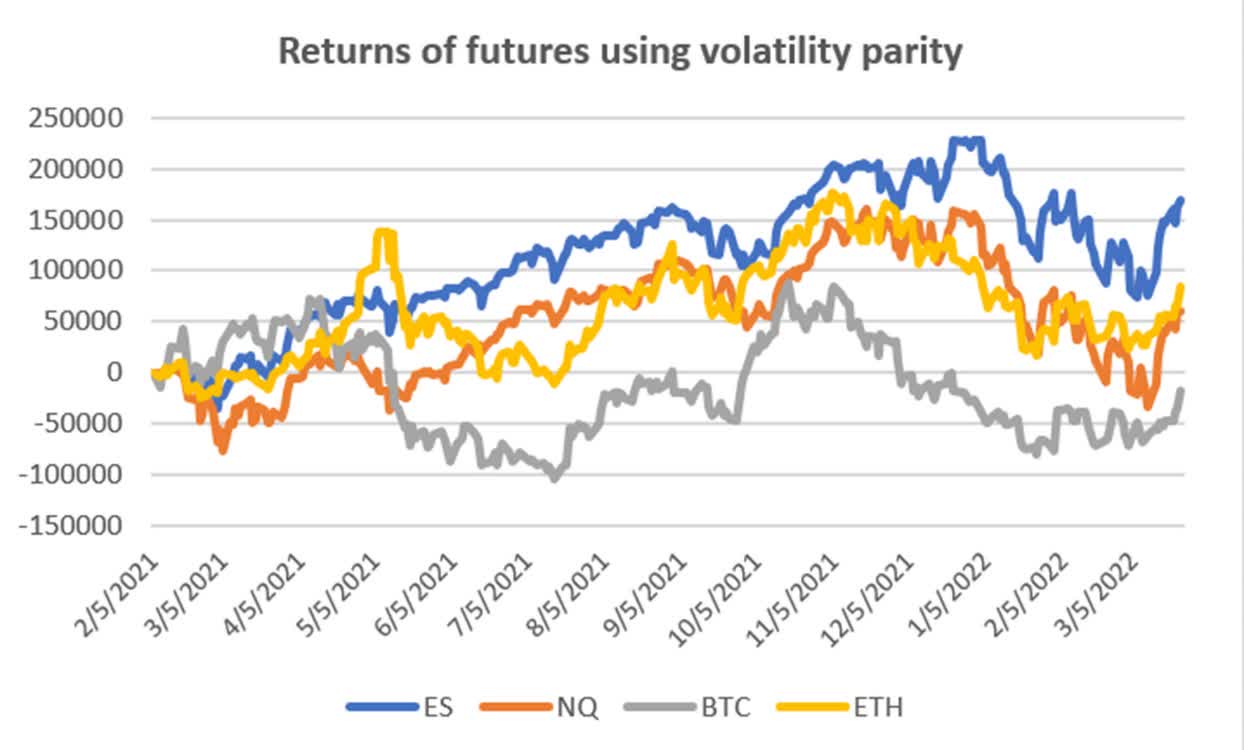
Summary
If you trade a market with more risk than the other markets in your portfolio, then that market must return more than the others; otherwise, you are just adding risk without returns. Equal risk maximizes diversification.
When calculating position size, use annualized volatility for equities and volatility parity for futures. Be sure to scale your positions to reflect volatility.
Be the first to comment