

ArLawKa AungTun
Holy-moly mortgage rates of 7% slash demand for new houses due to super-inflated prices, but prices are now coming down.
Traffic of prospective buyers of new single-family houses plunged to the lowest since 2012, excluding the two lockdown months April and May, and is now approaching even the levels of those two lockdown months, according to data on Tuesday from the National Association of Home Builders.
The NAHB index for traffic of prospective buyers dropped to 25, about where it was in mid-2007, well on the way down into Housing Bust 1. From 2008 through 2011, the index hovered around 10. Only this time, the descent is happening a lot faster than in 2005-2007:
NAHB/Wells Fargo: Traffic Of Prospective Buyers (Author)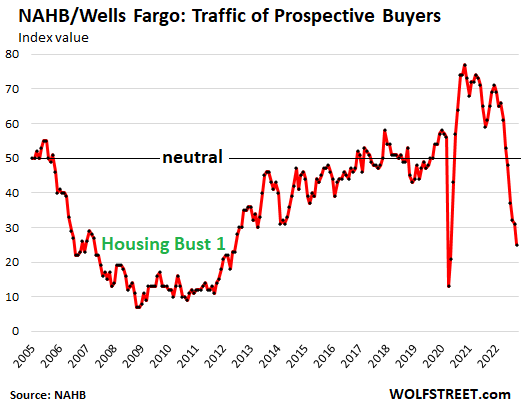
Traffic is a sign of interest among potential homebuyers, but many of them lost interest amid still sky-high prices and holy-moly mortgage rates of around 7%. The response from homebuilders is to reduces prices and offer incentives (including mortgage rate buydowns – anything to avoid the stigma of a price reduction).
The overall confidence of builders of single-family houses fell for the 10th month in a row in October, as “rising interest rates, building material bottlenecks, and elevated home prices continue to weaken the housing market,” the NAHB report said.
With the latest index value of 38, the NAHB/Wells Fargo Housing Market Index is now nearly where it had been in May 2020 during the lockdown and below where it had been in February 2007, on the way down into Housing Bust 1.
NAHB/Wells Fargo Housing Market Index (Author)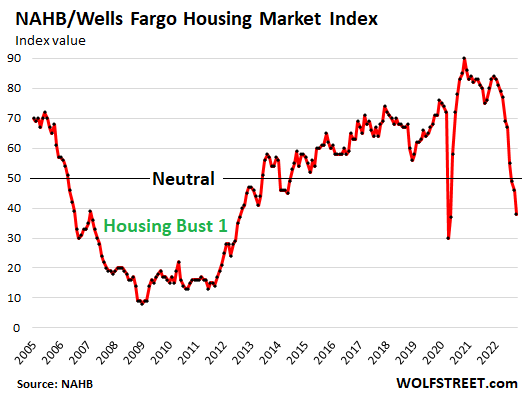
Current descent much faster than during Housing Bust 1
From April this year, when mortgage rates began to bite, until October, the index dropped by 39 points in six months (from 77 in April to 38 in October).
When Housing Bust 1 took off for homebuilders in October 2006 (index at 68), the index dropped in six months by 17 points. There was never any 6-month period during Housing Bust 1 when the index dropped anywhere near 39 points. The fastest drop was 24 points in the 6-month period that ended in September 2009.
The current 6-month drop now nearly matches the 6-month plunge through lockdown April 2020:
NAHB/Wells Fargo Housing Market Index: 6-Month Change (Author)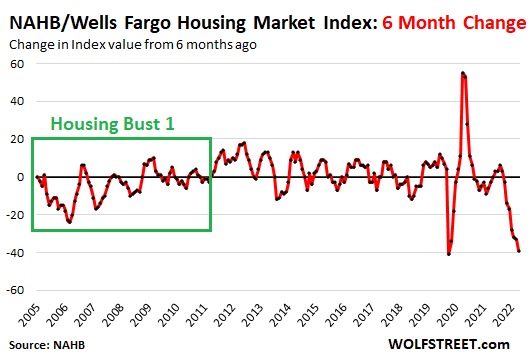
Homebuilder confidence by region
The NAHB’s regional Housing Market Index plunged the most and the fastest in the West (red line in the chart below). From its high this year in March (91), it plunged by 66 points in seven months.
The speed of the descent since December:
- West – by 62 points (red)
- South – by 48 points (green)
- Midwest – 38 points (purple)
- Northeast – by 32 points (yellow)
Regional Housing Market Index: NAHB/Wells Fargo (Author)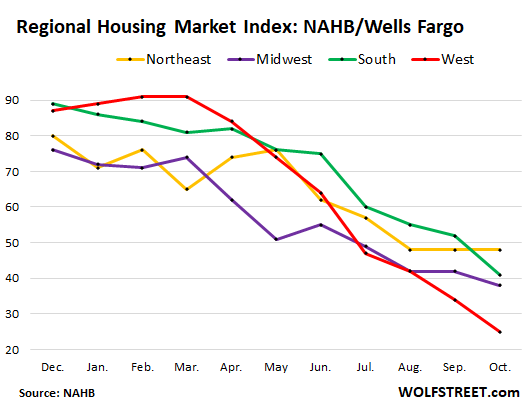
The NAHB index for current sales dropped by 9 points to an index level of 45, the eighth month in a row of declines. This means that more builders rated current sales as “poor” rather than “good” (50 is even).
The NAHB index for future sales dropped 11 points to an index level of 35, the lowest since June 2012, coming out of Housing Bust 1. And on the way down into Housing Bust 1, the descent reached that level in July 2007.
Price declines
Homebuilders can improve sales by cutting prices and by using various incentives and mortgage rate buydowns (when the builder subsidizes the mortgage). Homebuilders cannot just sit on the homes they’ve started building or have already completed. They must sell them one way or the other.
According to the Burns Home Builder Survey for September, by John Burns Real Estate Consulting, prices net of incentives had started to decline from month to month in late spring, with year-over-year price increases falling from the 20%-range in May to 11% in September.
“Very likely this chart [of year-over-year price changes net of incentives] ends the year flat to slightly down given market momentum we’re picking up on the ground, tweeted Rick Palacios Jr., Director of Research at John Burns:
Home Builder YoY Price Increases (Net Of Incentives) (John Burns Real Estate Consulting)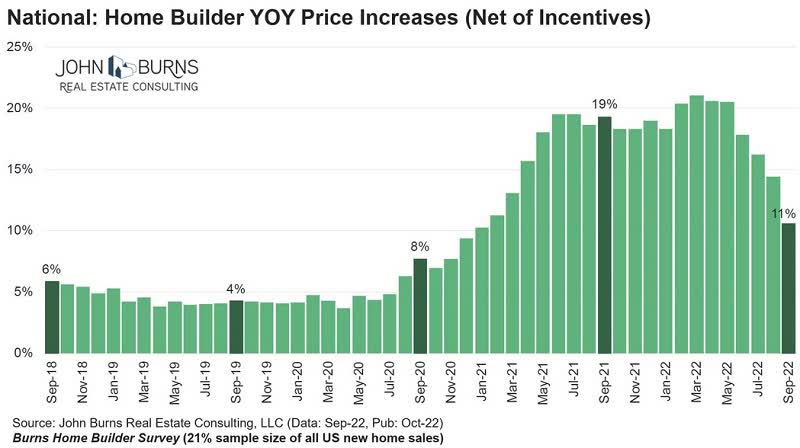
Holy-moly mortgage rates
The average 30-year fixed mortgage rate rose to 6.92% last week, the highest since February 2002, according to the weekly measure by Freddie Mac, which was released last Thursday, reflecting mortgage rates earlier last week. The daily measure by Mortgage News Daily has been just above 7% for days.
30-Year Fixed Mortgage Rate (Author)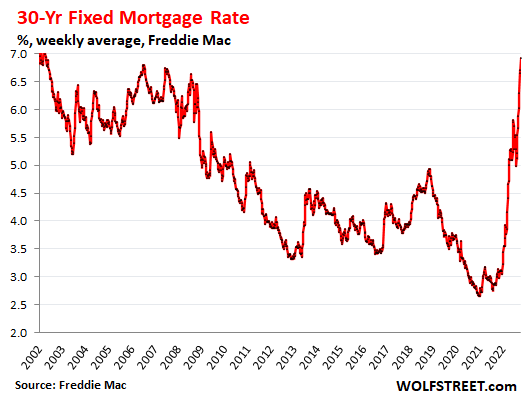
“Holy-moly mortgage rate” is my technical term based on the utterances potential homebuyers make when they see the mortgage payment of the house they’re trying to buy at these still sky-high prices.
Sure, rates were a lot higher back in the day, say in the 1970s and 1980s, but home prices were a whole lot lower compared to income levels. So I can’t say that 7% mortgage rates are no big deal because my first mortgage was 8% in the late 1980s, and it was just fine. And others who’d bought their home years before with a 15% mortgage and came out of it OK can’t say that 7% today is no big deal.
High prices and high mortgage rates don’t go together – and prices have been inflated to ridiculous levels amid years of the Fed’s QE and interest rate repression, which are now unwinding.
At today’s sky-high prices, the 7% 30-year fixed-rate mortgage does a job on home sales and on prices, as we’re already seeing.
Homebuilder stocks are down between 27% and 46% so far this year (data via YCharts):
Major Homebuilder Stocks % Drop YTD (Author)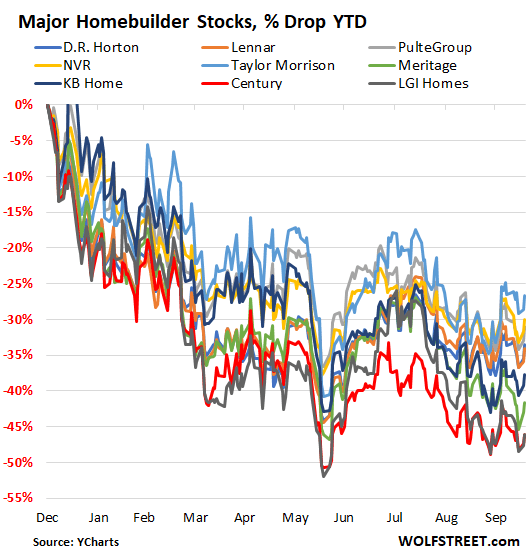
Editor’s Note: The summary bullets for this article were chosen by Seeking Alpha editors.
Be the first to comment