

artisteer/iStock via Getty Images
Investment Thesis and background
Let me start by sharing a chart we’ve been tracking for years, the dividend yield of the dividend champions as shown below. The dividends champs are companies who have been consistently increasing their calendar year dividend payout for at least 25 years consecutively. Thus, I view their dividends as the most reliable indicator of their owners’ earnings and their dividend yield as the most reliable valuation metric, and I view the parameters from this group as the most indicative of the state of the general market.
Source: author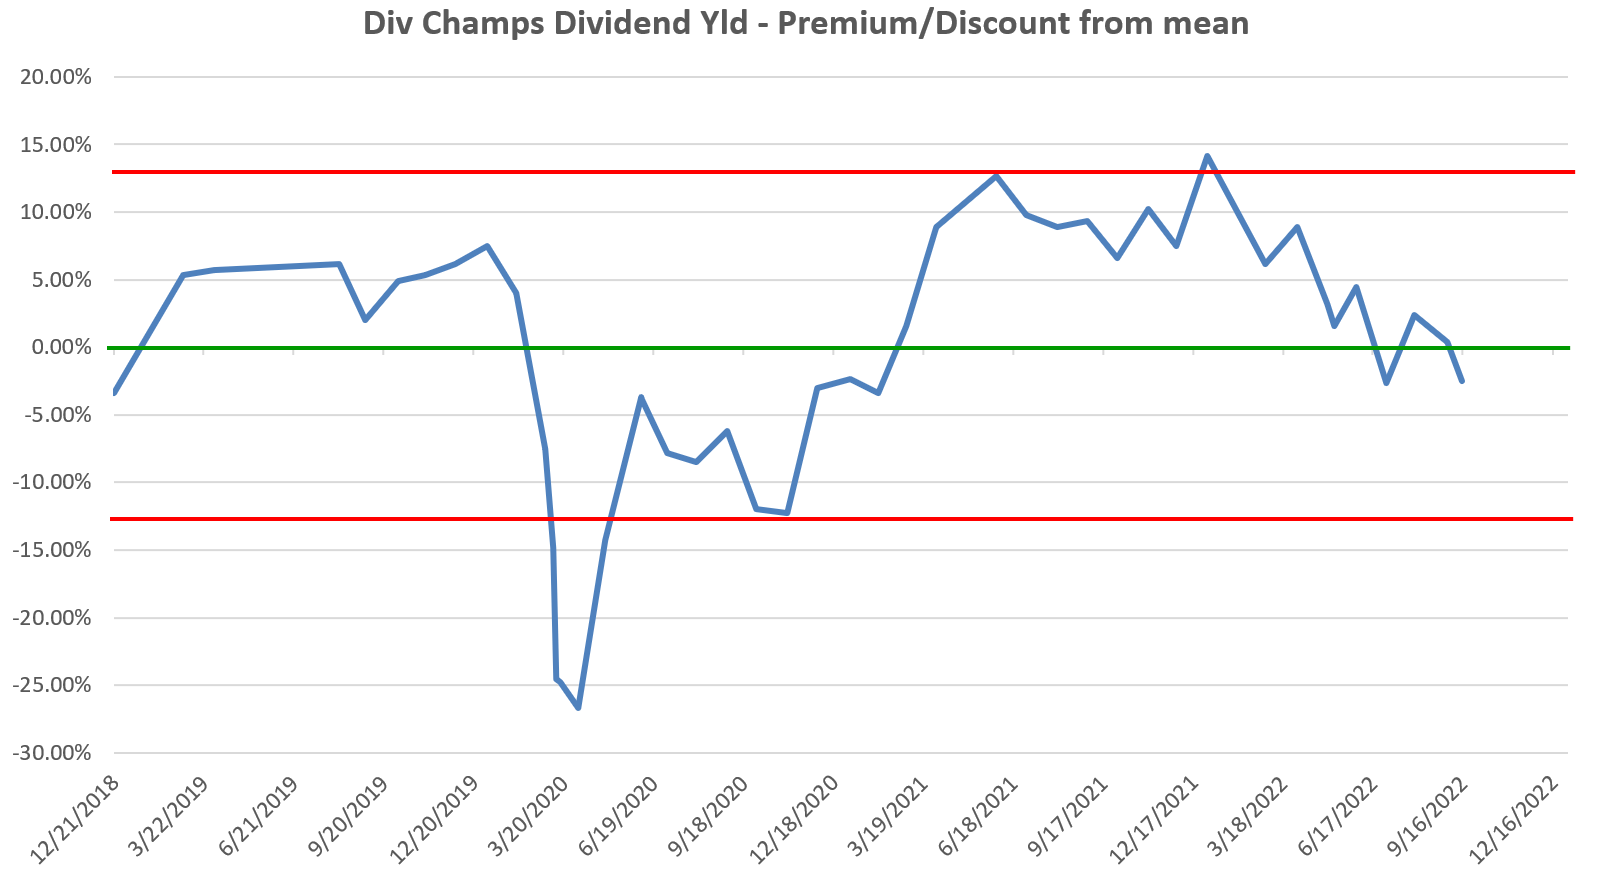
As you can see, the average yield of this group has surged above its historical mean for the first time in a year. More specifically, the chart shows the premium/discount of their yields relative to the historical mean (shown by the green line). To wit, the mean yield for this group of stocks is about 2.62% since 2018 and it is about 2.58% since 2011. So, you can see again the consistency and stability of this group of stocks. As of today, this group of stocks is yielding 2.65% based on my analysis. Therefore, the current yield is above the historical mean – by about 3% in relative terms. It’s not a huge discount, but not that small either if you consider that this group of stocks is so consistent that their maximum premium/discount had been within about 10% over the past few years (as you can see from the two red lines).
Against this background, we looked at these champs (a total of 143 of them) closely and screened 10 top picks as shown in the table below. And as you can see, the main topic for today, Lowe’s Companies, Inc. (NYSE:LOW), is the 8th topic candidate in this group. And of course, any discussion of LOW will inevitably involve The Home Depot, Inc. (NYSE:HD) – for good reasons as to be detailed next.
In the remainder of this article, I will first outline the screening method used, and then dive into a detailed comparison between LOW and HD.
Source: author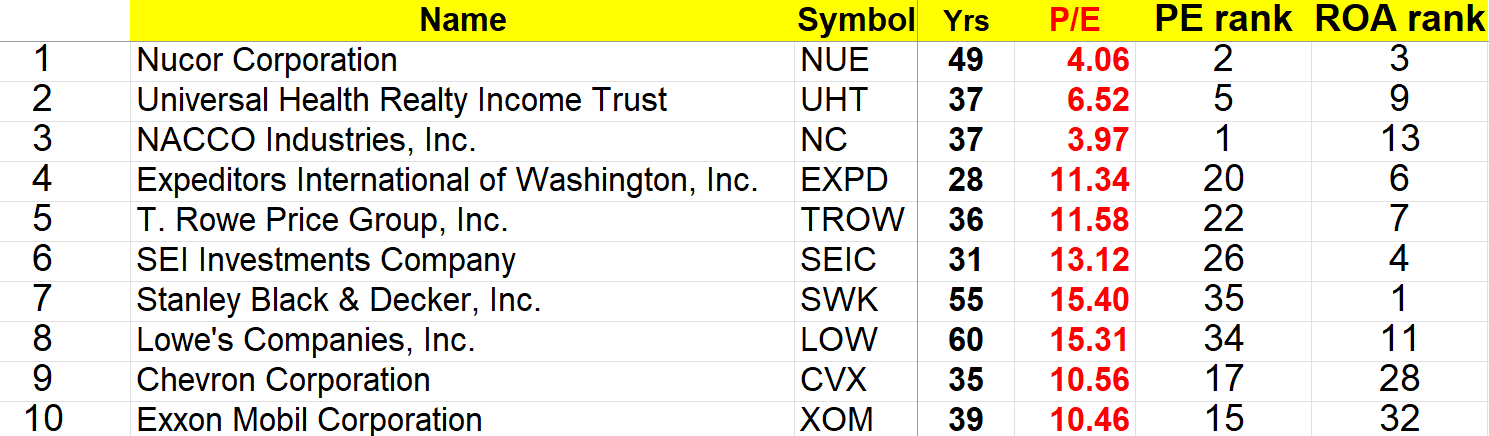
The Magic Formula and its performance
We performed the screening by the so-called Magic Formula (“MF”) method. The MF investing method was developed by Joel Greenblatt, a legendary investor and hedge fund manager. The method has been detailed in his book, entitled “The Little Book That Still Beats the Market.” The essence of the method is to use a set of simple rules to pick stocks that are an optimal combination of value and quality, in a methodical and unemotional process. The rules are simple and quoted below:
- To compute the valuation of a stock (e.g., by the P/E or EV/EBIT multiples). This number tells us how much we are paying to get a claim on one dollar of earning in that stock. Obviously, the lower this number, the better the deal (or bargain) we are getting in terms of the price we pay. We used P/E in our screening.
- To compute the quality of the stock (e.g., by some profitability metric, such as the return on capital, return on equity, or return on asset, ROA). This number tells us for every dollar we invest in the company (by buying its stock), how much of it can be turned into a profit. Obviously, the higher this number, the better (or more profitable) the business. And we used ROA in this screening.
- To rank all the stocks we are interested by both the valuation and the ROA (the last two columns in the above list.
- Then finally to add these two rankings to generate a combined rank and order the stocks by this combined rank. The stocks at the top of this final list represents the optimal combination of valuation and quality.
The MF method has been thoroughly backtested and showed superior returns compared to the broader market. For example, from 1988 to 2004, the MF method returned an annualized 33%, compared to 14% for the S&P500. During this period of time, following the MF for any 3-year period in a row, the MF beat the market averages 95% of the time.
Furthermore, it is a relative method that works under any overall market condition. A very important feature for a market that is overall significantly overvalued, such that absolute methods (e.g., limiting P/E to be below a threshold) would either lead to too few stocks or stocks with low quality.
Source: The Little Book That Still Beats the Market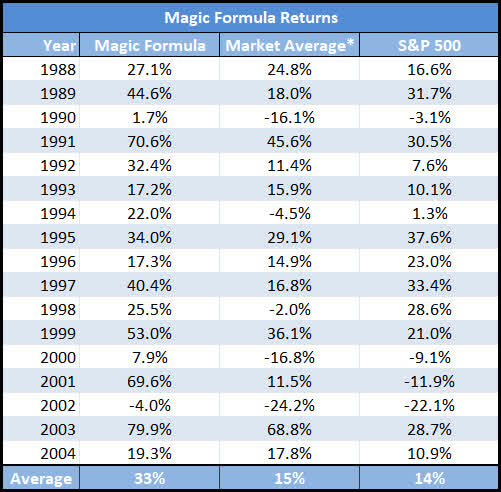
The Top 10 Picks – LOW and HD
Supported by the above previous work and our own experiences, we applied the MF+DG method to about 143 dividend champions and the top 10 candidates are here again.
Not all picks are suitable for all accounts considering that some of them are small caps and/or in special niche areas. However, we feel several of them could be of interest for conservative accounts such as the survival/withdrawal portfolio we use in our marketplace given the very reasonable valuation, strong financials, and also relatively high dividend yield. In particular, LOW is indeed and very attractive candidate. Its PE of 15.3x is the 34th lowest ranked PE among all 143 dividend champs, yet its ROA is the top 11th. As you will see next, its close peer HD is also at an attractive point too (note that HD is not a dividend champ).
But in the end, we still favor LOW better than HD as to be explained next.
Source: Author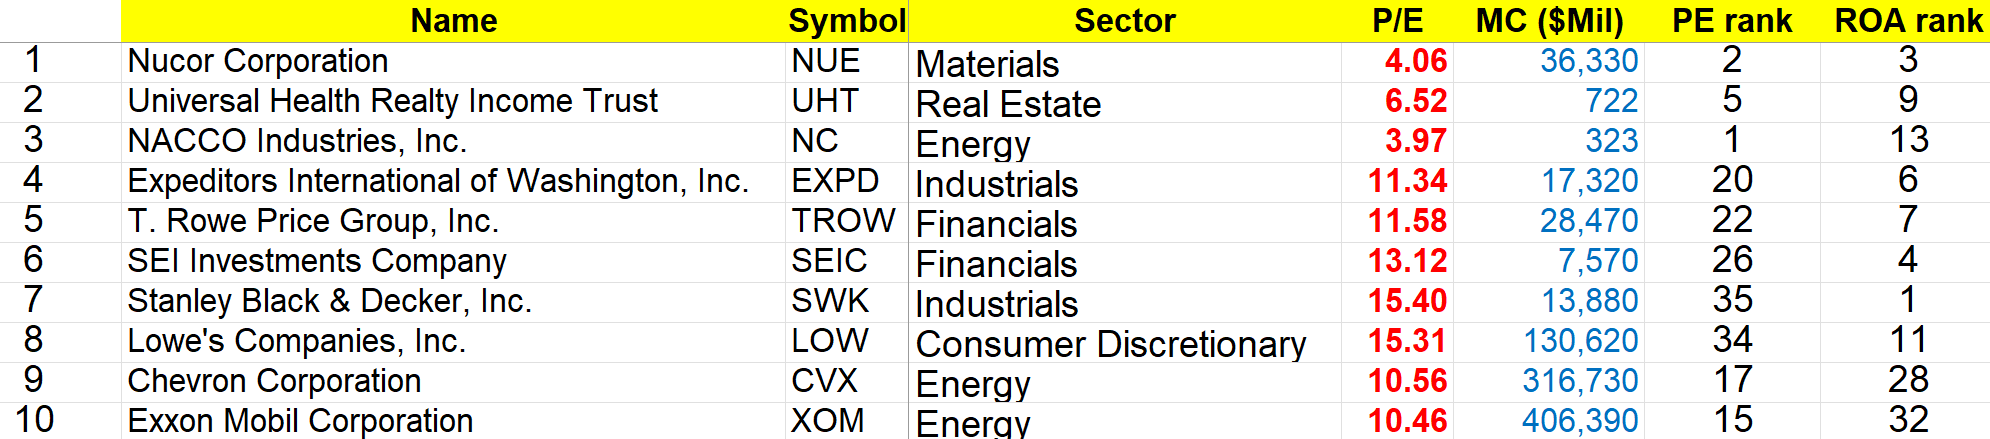
LOW and HD: Superb profitability and dividend safety
Both HD and LOW currently offer an attractive dividend yield of about 2.75% and 2.19%, respectively. dividends from both companies are supported by superior and consistent profitability as you can see from the following chart. Profitability comparison is such a multidimensional topic and ultimately will always involve some subjective judgment. And my overall impression here is that both enjoy healthy and remarkably consistent profitability, although HD is more profitable than LOW.
Take the net income margin as an example. HD features a net margin of around 10.9% and LOW around 8.8%. To put things under perspective, the average profit margin for the overall economy fluctuates around 8% and rarely goes above 10%. Of course, this is an average across all business sectors. Nonetheless, as a rule of thumb, 8% to 10% is a very healthy profit margin. You can see HD has an upper hand in most of the metrics below too. Its EBITDA margin is 17.3%, better than LOW’s 15% by 230 basis points. Its return on total capital is 32.4%, also better than LOW’s 28.67%. Finally, its asset turnover of 2.12x is also higher than LOW’s 1.98x.
Although, next you will see that I think what LOW lags in profitability is more than made up in terms of its dividend safety and its total return potential.
Source: Seeking Alpha data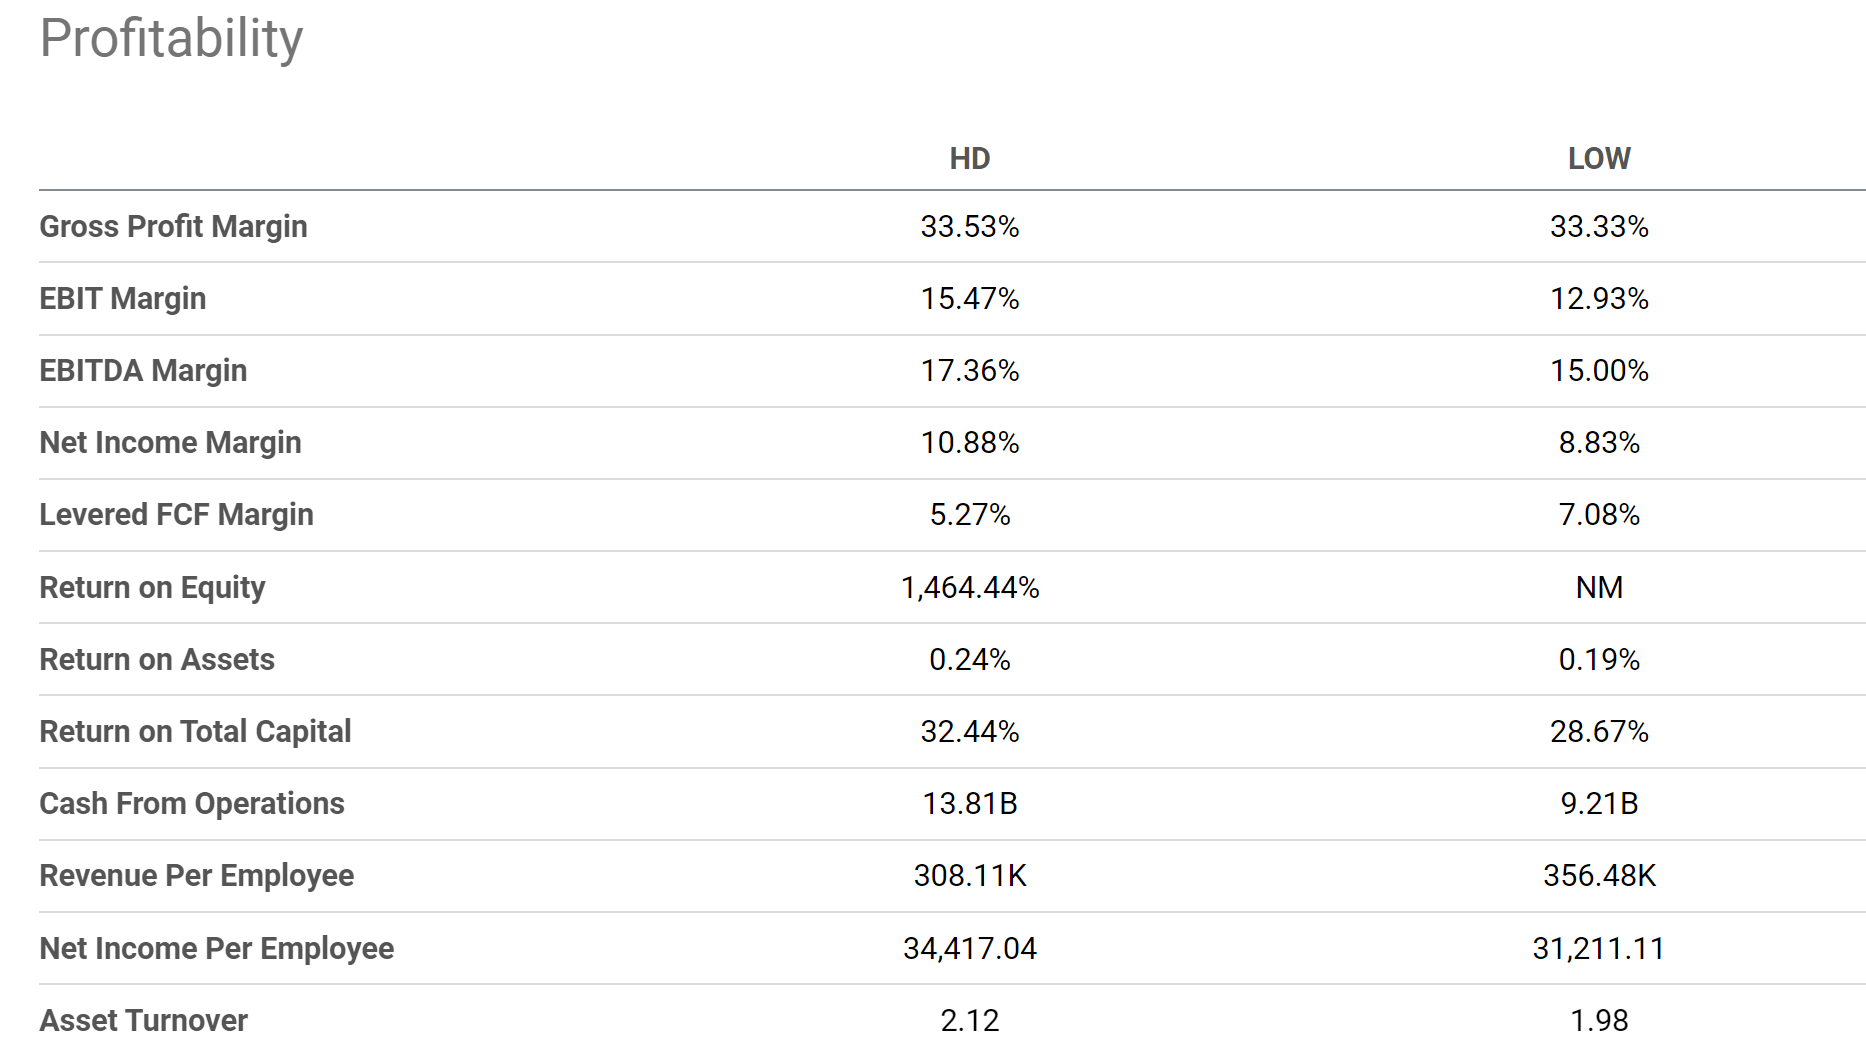
LOW and HD: dividend payout ratios
For dividend investors, I am sure all of us know all the typical metrics to gauge dividend safety such as payout ratio in terms of earnings, payout ratio in terms of cash flow, et al. The following chart shows HD and LOW’s payout ratios in terms of cash flow and earnings. As seen, both HD and LOW have been doing a consistent job of managing their dividend payout in the past. In terms of cash flow payout ratios, both have been maintaining a very conservative ratio: 24% for LOW and 38% for HD. In terms of earnings payout ratios, the picture is about the same. They have also been maintaining a very conservative ratio in the past: 36% for LOW and 45% for HD.
Although from this comparison, you can see that LOW’s payout ratios are not only lower than HD’s but also more consistent. Furthermore, LOW’s current payout ratios are lower than its historic averages (by a little bit in terms of cash payout ratios and by a lot in terms of earnings), while HD’s payout ratios are higher than its historical average (by a lot in terms of cash and a little in terms of earnings). In my mind, these considerations mean LOW has more flexibility to further increase further dividends and also provides better safety.
Next, we will see that LOW’s safety is actually better than on the surface when its financials are considered holistically.
Source: Author based on Seeking Alpha data Source: Author based on Seeking Alpha data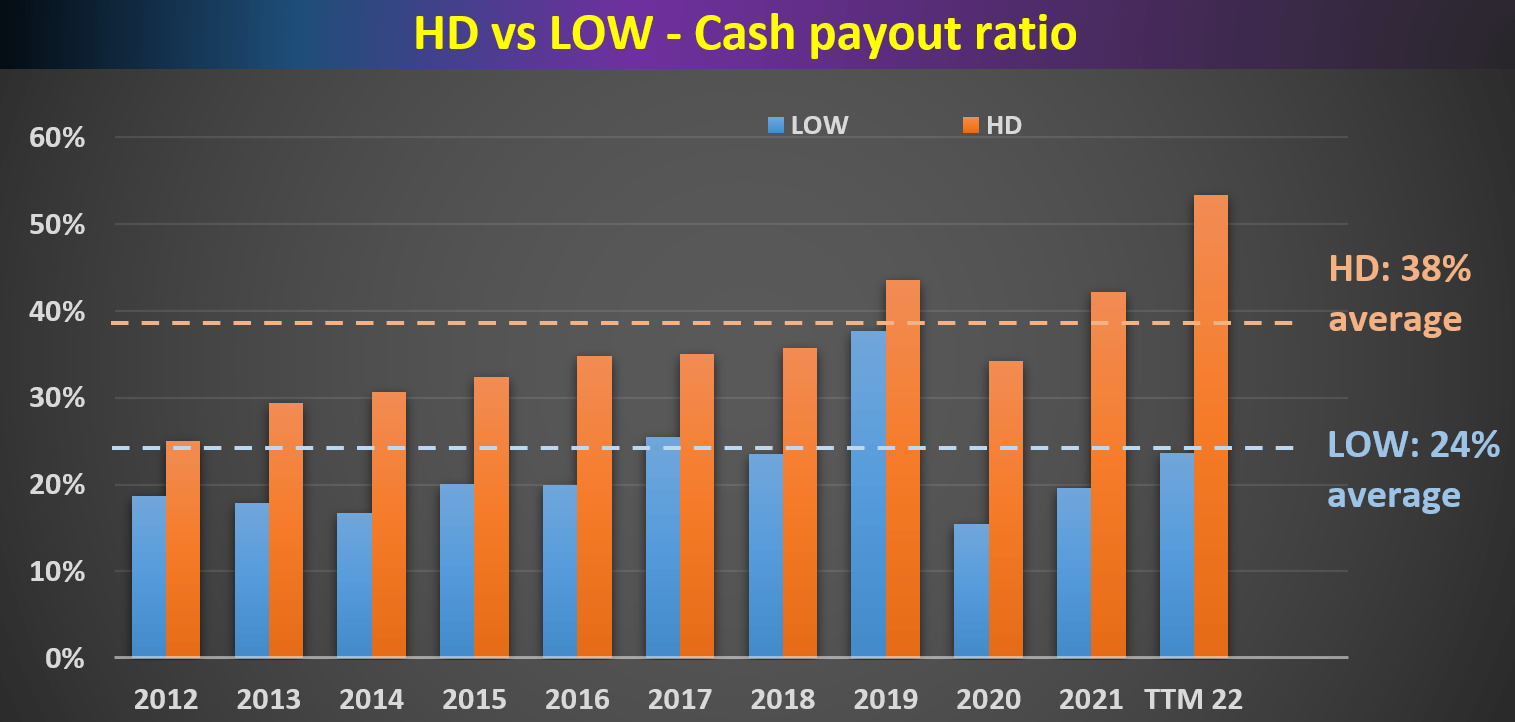
LOW and HD: Dividend cushion ratios
The above payout ratios we commonly quote enjoy simplicity, and we also like to go a step further for a more comprehensive assessment of dividend safety. As detailed in my earlier article here, the major limitations of the above simple payout ratios are twofold:
- The simple payout ratio ignores the current asset that a firm has on its balance sheet. Obviously, for two firms with the same earning power, the one with more cash sitting on its balance sheet should have a higher level of dividend safety.
- The simple payout ratio also ignores the upcoming financial obligations. Again, obviously, for two firms with the same earning power, the one with a lower level of obligations (pension, debt, CAPEX expenses, et al) should have a higher level of dividend safety.
The above simple payout ratios ignore all these important pieces. For a more advanced analysis of dividends stocks, we find the so-called dividend cushion ratio an effective tool. A detailed description of the concept can be found in Brian M Nelson’s book entitled Value Trap. And a brief summary is quoted below:
The Dividend Cushion measure is a ratio that sums the existing net cash (total cash less total long-term debt) a company has on hand (on its balance sheet) plus its expected future free cash flows (cash from operations less all capital expenditures) over the next five years and divides that sum by future expected cash dividends (including expected growth in them, where applicable) over the same time period. If the ratio is significantly above 1, the company generally has sufficient financial capacity to pay out its expected future dividends, by our estimates. The higher the ratio, the better, all else equal.
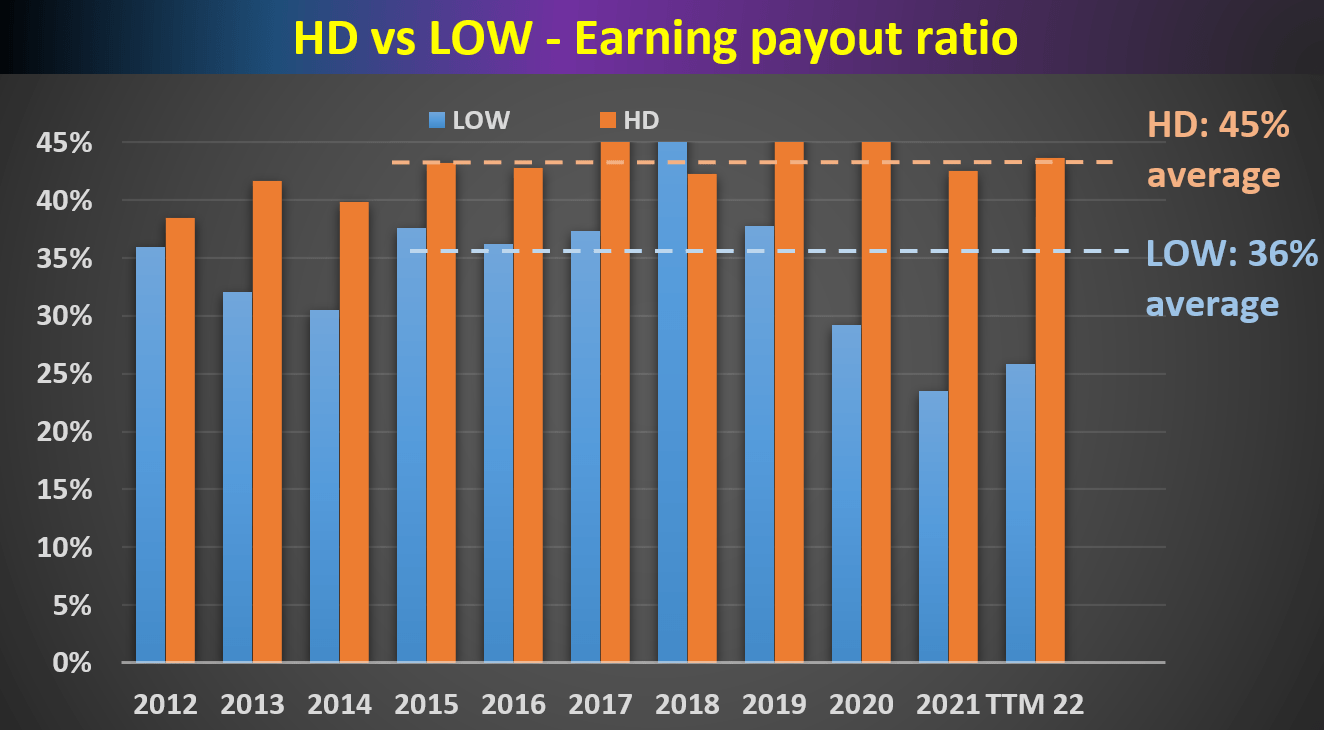
Note that our following analysis made one revision to the above method. Instead of subtracting the total long-term debt, we subtracted the total interest expenses over a past five-year period. The reason for this revision is to adjust the status of businesses such as HD and LOW. Mature businesses like these probably will never have the need to repay all of their debt at once. But it does need to have enough earnings to service its debt (i.e., cover the interest expenses). With this background, the dividend cushion ratios for HD and LOW are calculated and shown below.
As can be seen, HD has been maintaining an average dividend cushion ratio of 1.93x in recent years, and LOW has been maintaining an even higher cushion ratio of 1.99x. Both are significantly above 1, confirming their safe and conservative dividend payout in the past. However, two fine points are worth mentioning here. Firstly, LOW’s average cushion ratio of 1.99x is slightly above HD’s 1.93x. And secondly and more importantly, Lowe’s current cushion ratio of 2.06x is above its already excellent historical average. While in contrast, HD’s current cushion ratio of 1.51x is substantially below its historical average.
And such a divergence is another key consideration in my mind about Lowe’s superior dividend safety.
Source: Author based on Seeking Alpha data
LOW and HD: Valuation and Projected Returns
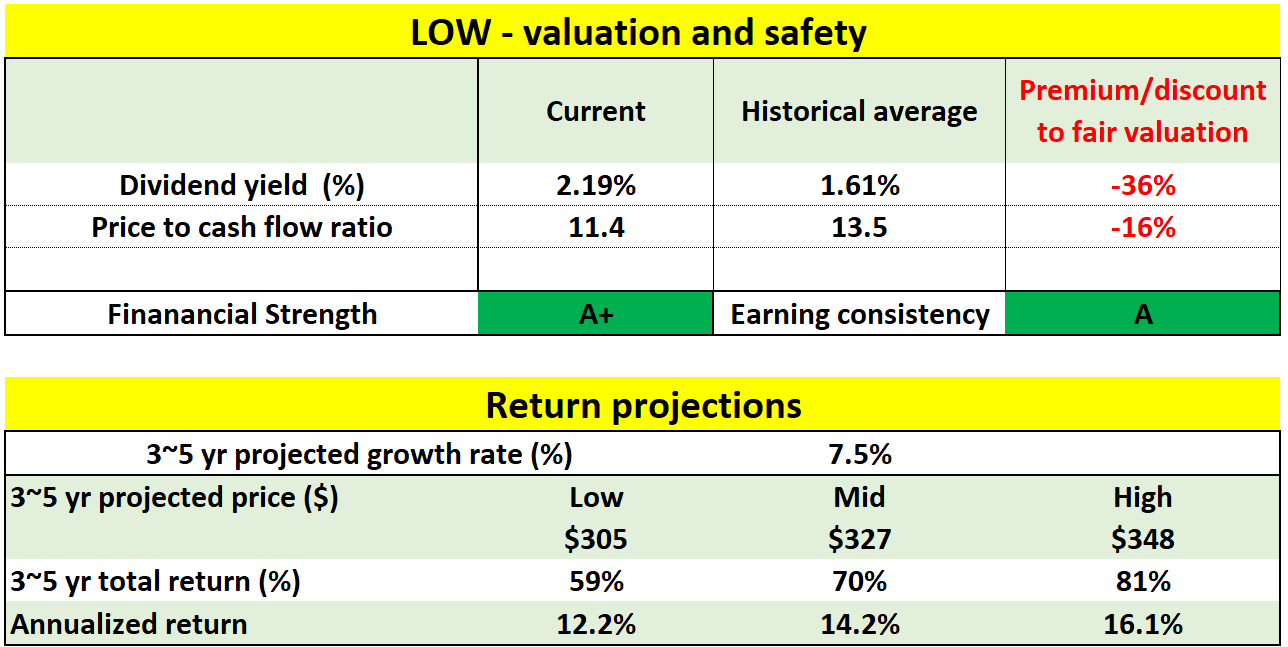
As can be seen from the following two tables, both LOW and HD are undervalued. And LOW’s valuations are more compressed in comparison, leading to larger return potentials.
To wit, at its current price level, HD is about 7% undervalued based on its historical price to cash flow multiples, and about 25% undervalued based on its historical dividend yield. LOW is about 16% undervalued based on its historical price to cash flow multiples, and about 36% undervalued based on its historical dividend yield.
As a result of the larger discount, I anticipate a larger return potential from LOW in the next few years. For the next 3~5 years, a mid-single-digit annual growth rate is expected for both (taken to be 7.5%). For HD, the total return in the next 3~5 years is projected to be in a range of 44% (the low-end projection) to about 67% (the high-end projection), translating into a solid annual total return ranging from 9.6% to 13.7%. For LOW, the total return in the next 3~5 years is projected to be in a range of 59% (the low-end projection) to about 81% (the high-end projection), translating into an even more attractive annual return in the range of 12.2% to 16.1%.
Source: Author based on Seeking Alpha data Source: Author based on Seeking Alpha data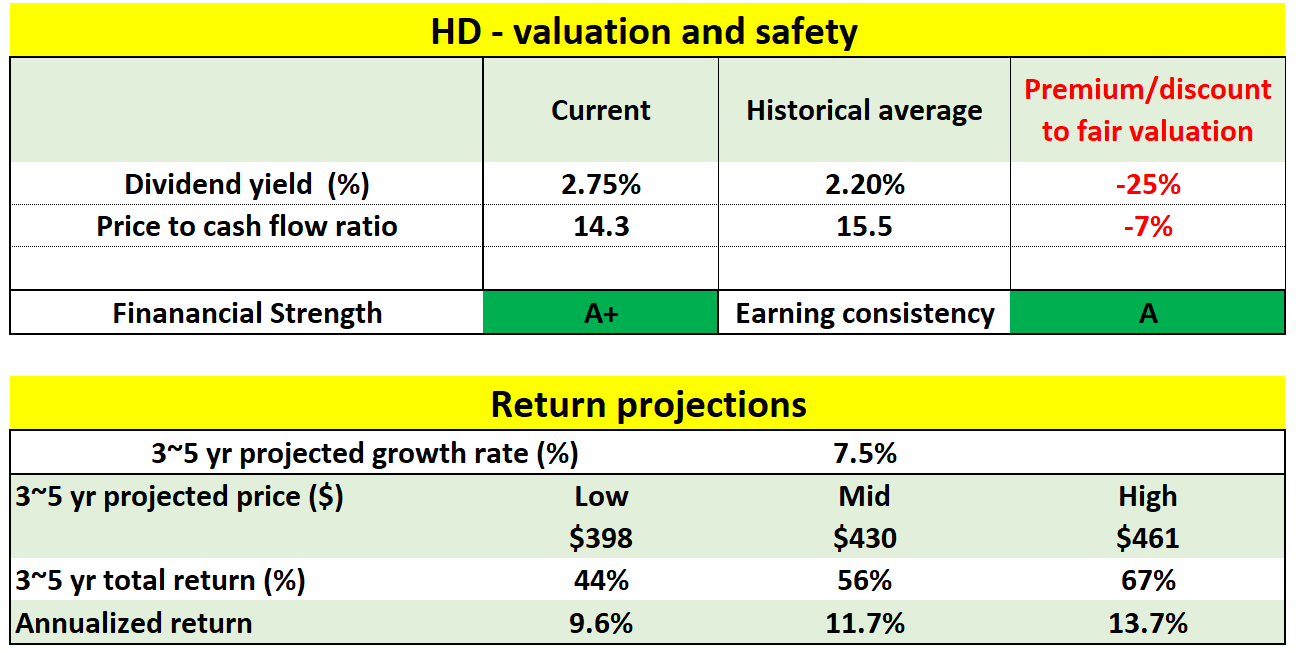
Risks and final thoughts
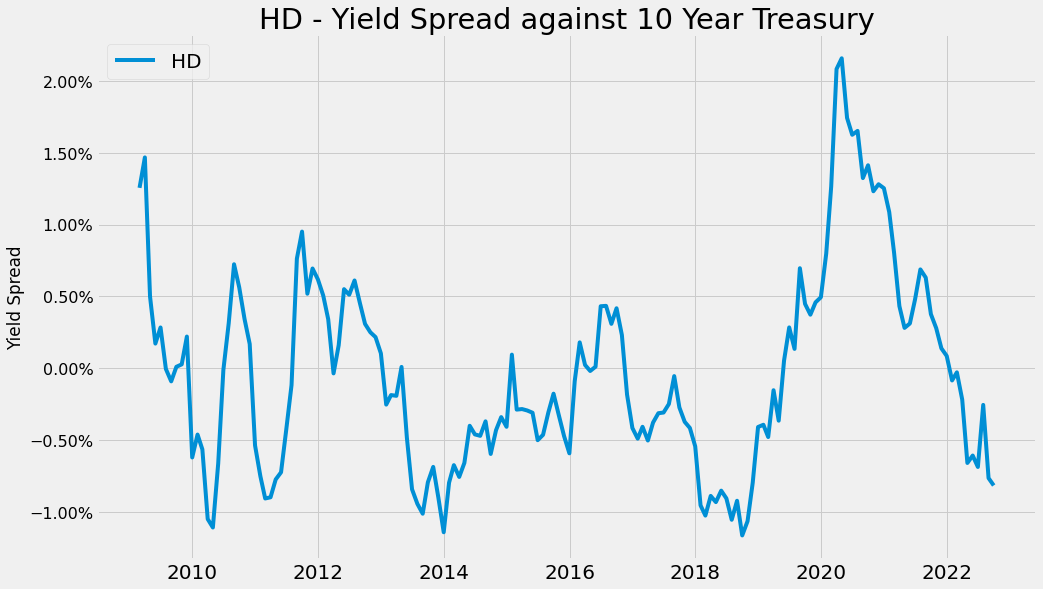
There are plenty of near-term risks to both LOW and HD (as many other Seeking Alpha authors have already eloquently argued and thoroughly analyzed). And I won’t further add to these existing discussions anymore. Here I will just point out one aspect that is less mentioned. The risk premium relative to risk-free interest rates is relatively high for both HD and LOW under the current conditions. The following two charts show the yield spread of LOW and HD, respectively, against 10-year treasury rates. Details of these concepts and approaches can be found in our earlier article. And as seen, despite their attractive valuation and dividend yields in absolute terms, their current yield spread relative to risk-free rates is near the thinnest level in more than a decade.
Source: Author based on Seeking Alpha data Source: Author based on Seeking Alpha data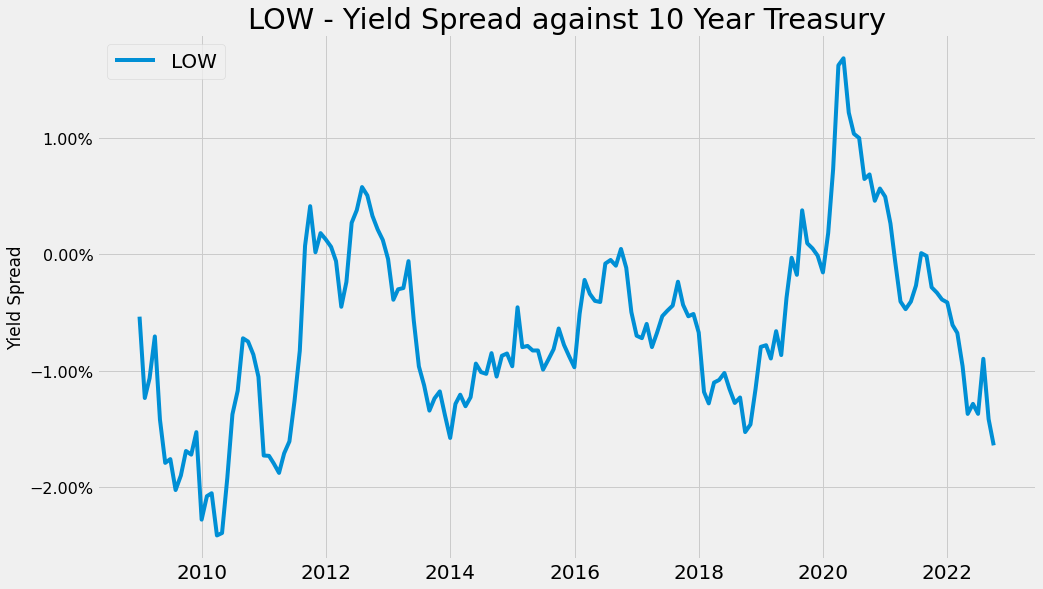
To conclude, I track and update the parameters of the dividend champs regularly not only because I like dividend stocks but also because of an even more fundamental reason. With their reliable earnings and dividends, I view the parameters from this group as the most indicative of the state of the general market. And currently, this group is at a discount, providing an opportunity for investors to strengthen their portfolio with stocks both from and beyond this group. Specific to LOW, it is a top candidate from this group, featuring an attractive combination of valuation and quality. A side-by-side comparison against HD further illustrates its attractiveness. My overall impression is what LOW lags in profitability compared to HD is more than made up by its dividend safety, its valuation discount, and its total return potential.
Be the first to comment