


Dejan Marjanovic
Cannabis stocks have been just about the worst niche of the global equity market over the last 20 months. Back in early 2021, it was a hot trade though. The ETFMG Alternative Harvest ETF (MJ) surged to nearly $35 as optimism permeated around positive regulatory changes and state elections that were seen as favorable for the industry. Bulls have seen their capital go up in smoke since then, however.
MJ now trades just above $5, a massive 85% drawdown off the ‘blue wave’ high from February last year. Is now the time to buy? Or are more new lows coming? One marijuana firm has earnings Tuesday afternoon this week that will provide clues.
MJ: Election Optimism Failed to Materialize
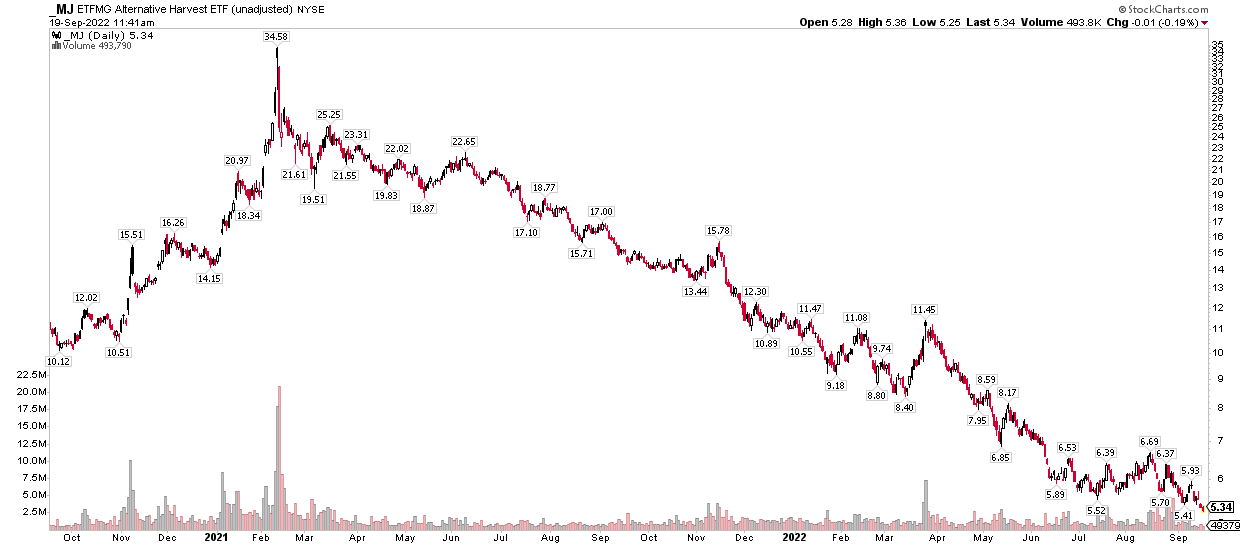
Stockcharts.com
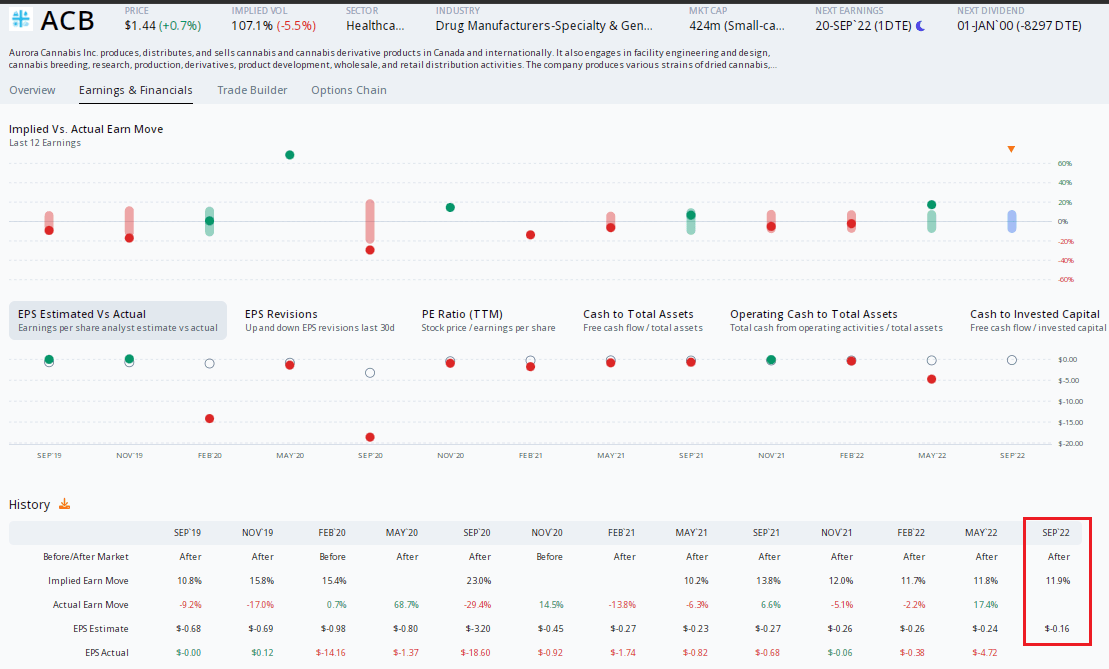
According to CFRA Research, Aurora Cannabis Inc. (NASDAQ:ACB) produces, distributes, and sells cannabis and cannabis derivative products in Canada and internationally. It also engages in facility engineering and design, cannabis breeding, research, production, derivatives, product development, wholesale, and retail distribution activities. The company produces various strains of dried cannabis, cannabis oil and capsules, and topical kits for medical patients.
The Canadian company has a market cap of $382 million and is part of the pharmaceuticals industry within the Health Care sector. It has had negative earnings over the past 12 months and does not pay a dividend, according to The Wall Street Journal.
On valuation, Aurora trades at 1.6 times last year’s sales and a multiple of 2.6 times next year’s forecasted revenues, according to Seeking Alpha. With negative EPS over the past several quarters and years, I look to the sales multiple valuation approach.
Aurora: Earnings Outlook & Profitability Ratios
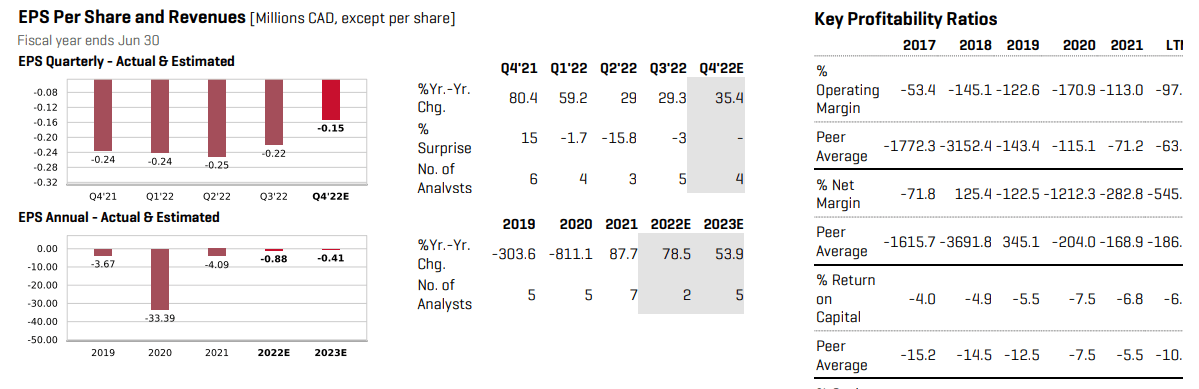
CFRA
ACB trades very cheaply compared to its historical price/sales ratio average. This is a low-confidence valuation indicator, however. Notice in the graphic above that earnings show no signs of turning positive any time soon. It’s hard to find a compelling valuation case given the current outlook, but the chart suggests value buyers might dip their speculative toes in around these levels.
ACB Historical Forward P/S History: Cheap Under 3x?
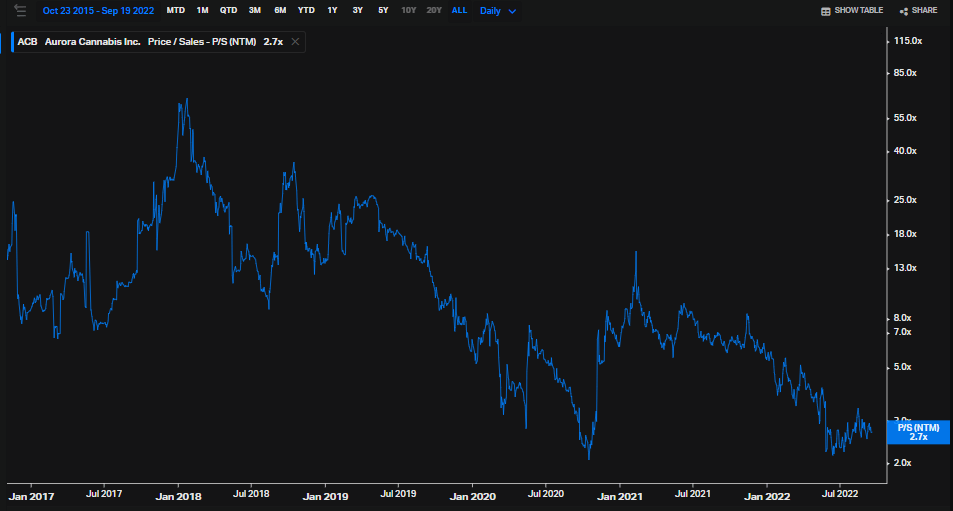
Koyfin
Looking ahead, Wall Street Horizon’s data show that ACB has a confirmed Q4 earnings date Tuesday, Sept. 20, after the closing bell with a conference call to follow – you can listen live here. The next reporting date is projected to take place on Nov. 8 and there is a shareholder meeting slated for Nov. 14.
Corporate Event Calendar
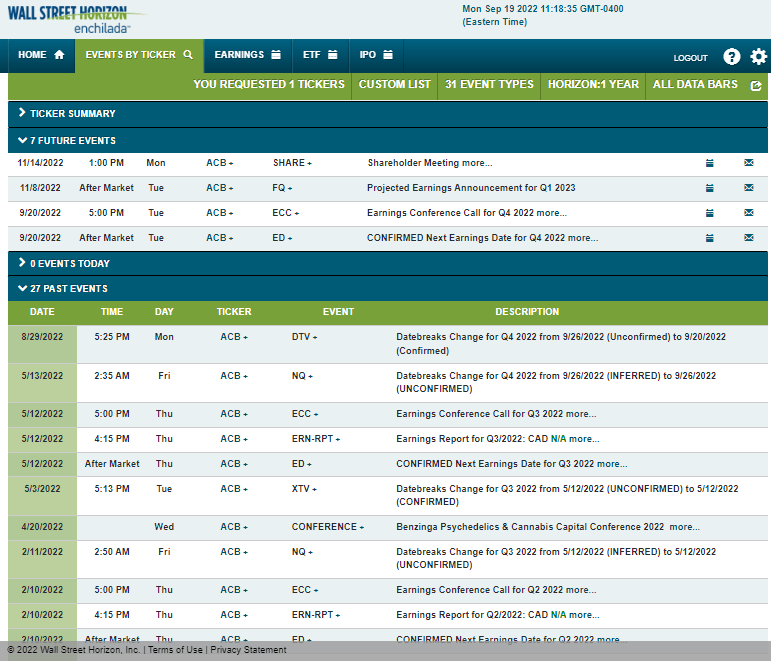
Wall Street Horizon
The Options Angle
Option Research & Technology Services (ORATS) data show high implied volatility in shares of Aurora. The options market has priced in an 11.3% post-earnings stock price swing using the nearest-expiring at-the-money straddle. Interestingly, a handful of share price changes after earnings have not been all that high.
For Tuesday’s earnings, analysts expect a loss of $0.16 per share which would be a smaller decline from the same quarter last year. Unfortunately for the bulls, ACB has a poor earnings beat rate history. The bar might just be low enough for ACB to hurdle above, but the options seem somewhat pricey based on previous price action.
Options Market Shows An 11% Earnings Move Expected
ORATS
The Technical Take
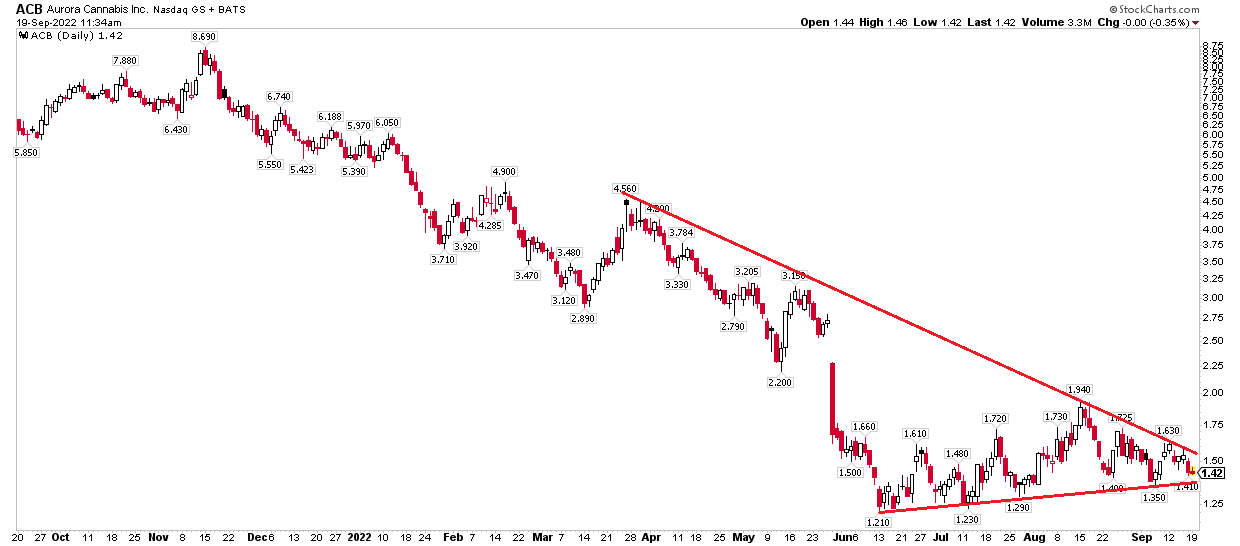
Aurora has been in a downtrend over the past few years, and the nearer-term trend shows a minor falling wedge pattern, which is a potential bullish reversal sign. If the stock can close above about $1.75, it could have upside potential to an old gap near $2.75.
On the downside, a break below $1.20 could portend a bearish move under a dollar. We’ll obviously know more after the earnings release, but based on the bullish descending wedge pattern, I actually lean bullish going into and through earnings.
ACB: Big Downtrend, Bullish Falling Wedge?
Stockcharts.com
The Bottom Line
ACB is for ultra-risk-seeking investors. The stock has fallen sharply over the last several years as the cannabis company continues to lose money. Analysts expect another quarterly per-share loss Tuesday, but the chart could be shaping up for a bounce here. Long-term investors should shy away until earnings move into the black, but swing traders might consider taking a bet on ACB here with a stop under $1.20.
Be the first to comment