

DenisTangneyJr
Core earnings of Hingham Institution for Savings (NASDAQ:HIFS) will likely continue to surge in the next year and a half thanks to moderate loan growth. On the other hand, the top line will suffer from rising interest rates as the margin is inversely proportional to interest rate changes. Overall, I’m expecting Hingham Institution to report core earnings of $28.47 per share for 2022, up 11% year-over-year. On a GAAP basis, earnings will likely decline 30% this year due to hefty losses on sales of equities reported in the first half of the year. The year-end target price is quite close to the current market price. Therefore, I’m maintaining a hold rating on Hingham Institution for Savings.
Economic Factors to Slow Down Loan Growth
Hingham Institution’s loan portfolio grew by a hefty 10.4% in the second quarter of 2022 (42% annualized), which beat my expectations. Growth will likely slow down as the second quarter’s unusually high growth is unsustainable, in my opinion. Moreover, certain economic factors will weigh down loan growth.
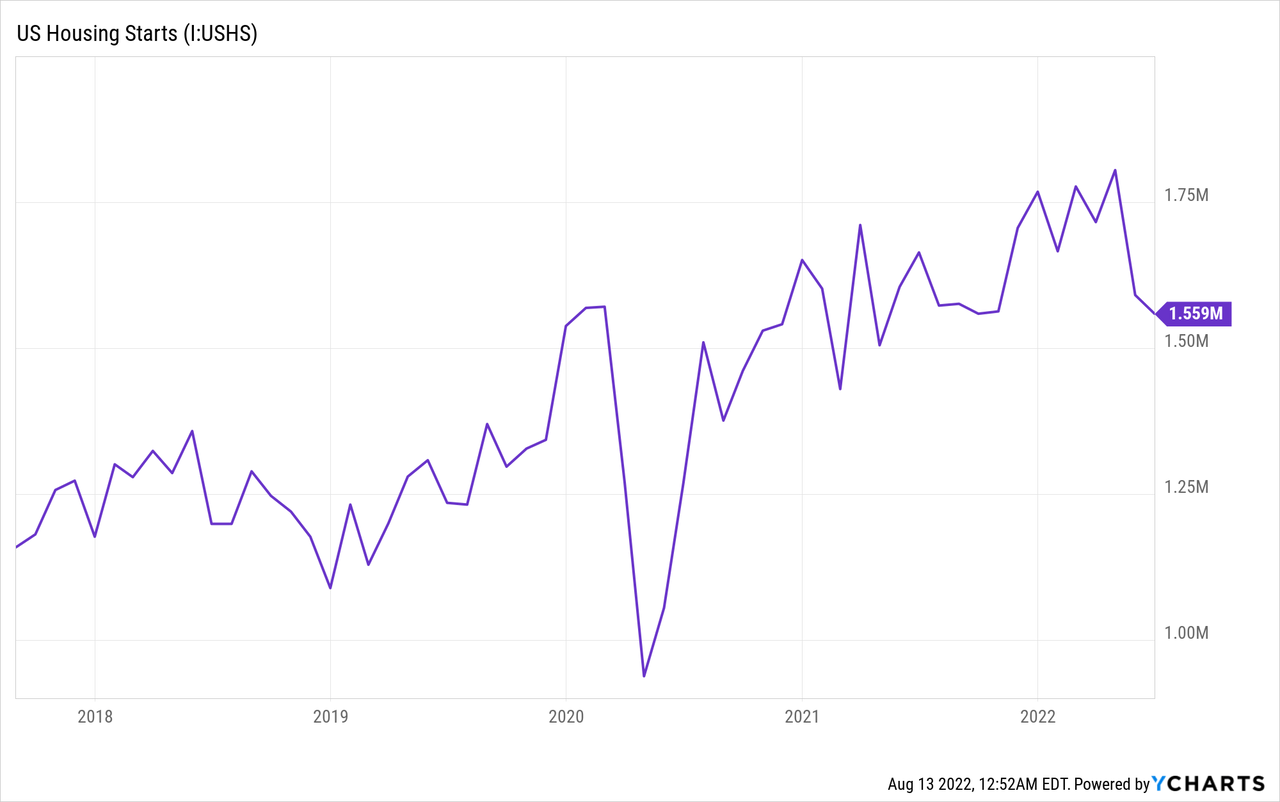
Almost all of Hingham’s loans are real estate-backed loans. Residential loans made up 15% of total loans, while commercial real estate loans (including construction) made up 85% of total loans at the end of June 2022, according to details given in the 10-Q filing. As a result, the number of housing starts is a good gauge of product demand. Further, Hingham has a presence in Massachusetts, Washington D.C., and California. As these regions are very different from each other, the national average is appropriate for Hingham Institution. As shown below, housing starts have dropped so far this year after doing quite well in the last few years.
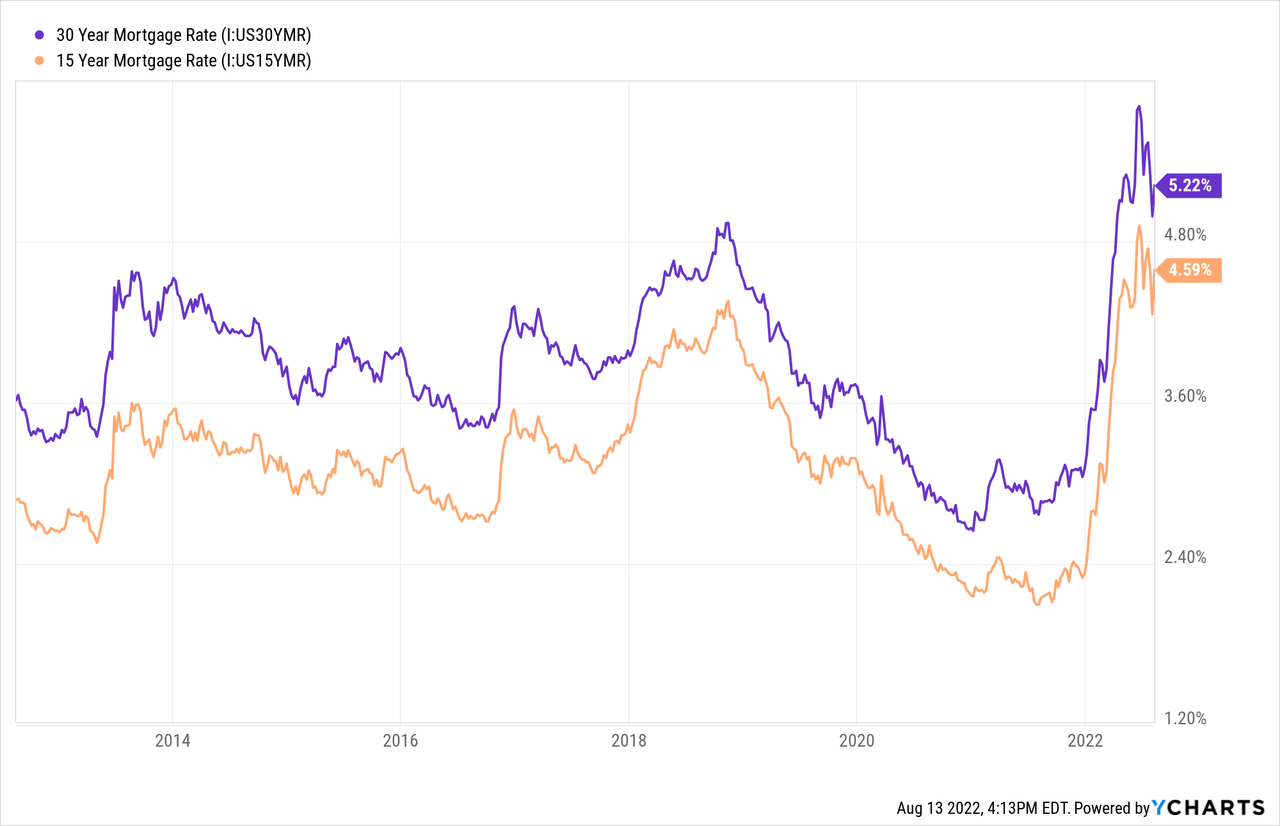
High mortgage rates will likely further slowdown loan growth in the year ahead. Mortgage rates have recently softened but they’re still quite high compared to a year ago period.
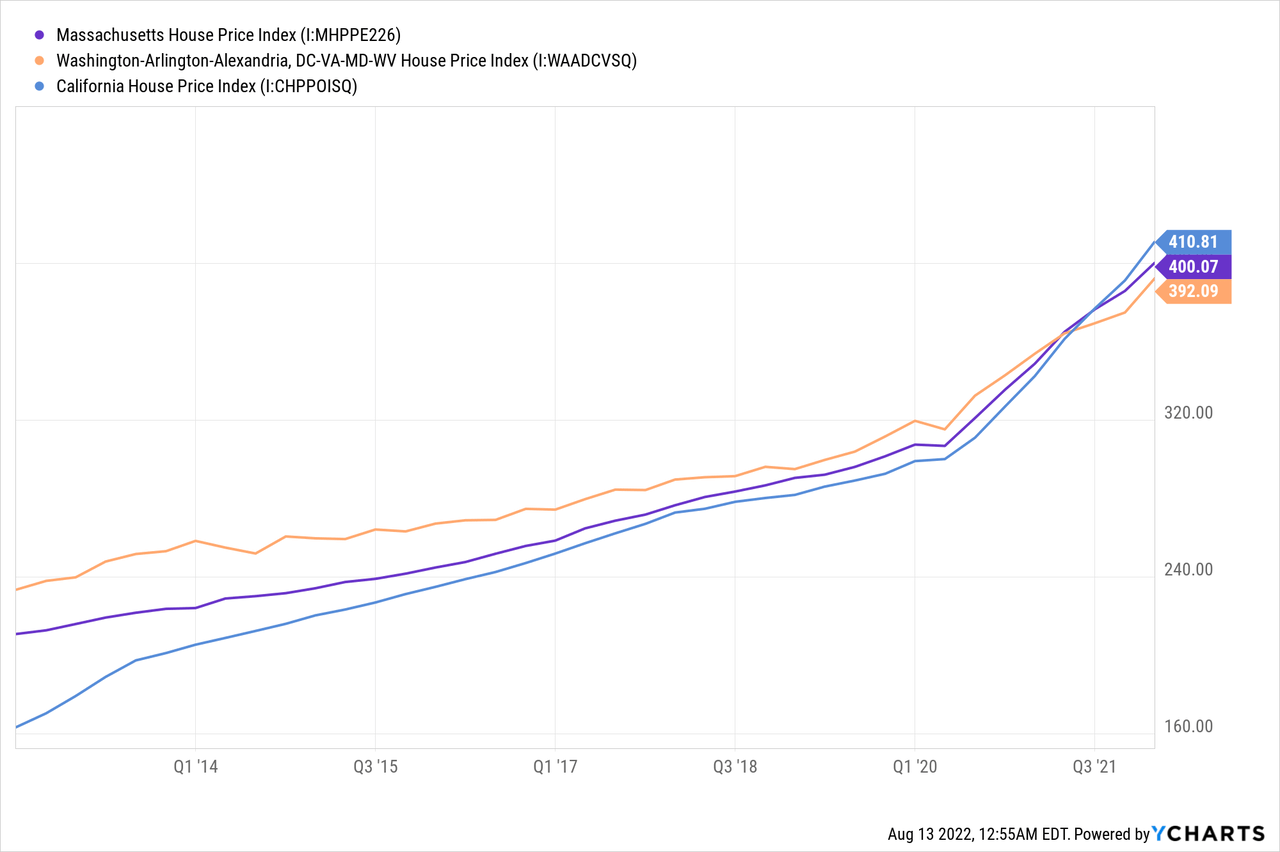
A steeper uptrend than usual for home prices also bodes ill for loan growth. First-time home purchasers will get discouraged by the high home prices and borrowing costs and therefore put off their home purchases until a more feasible time.
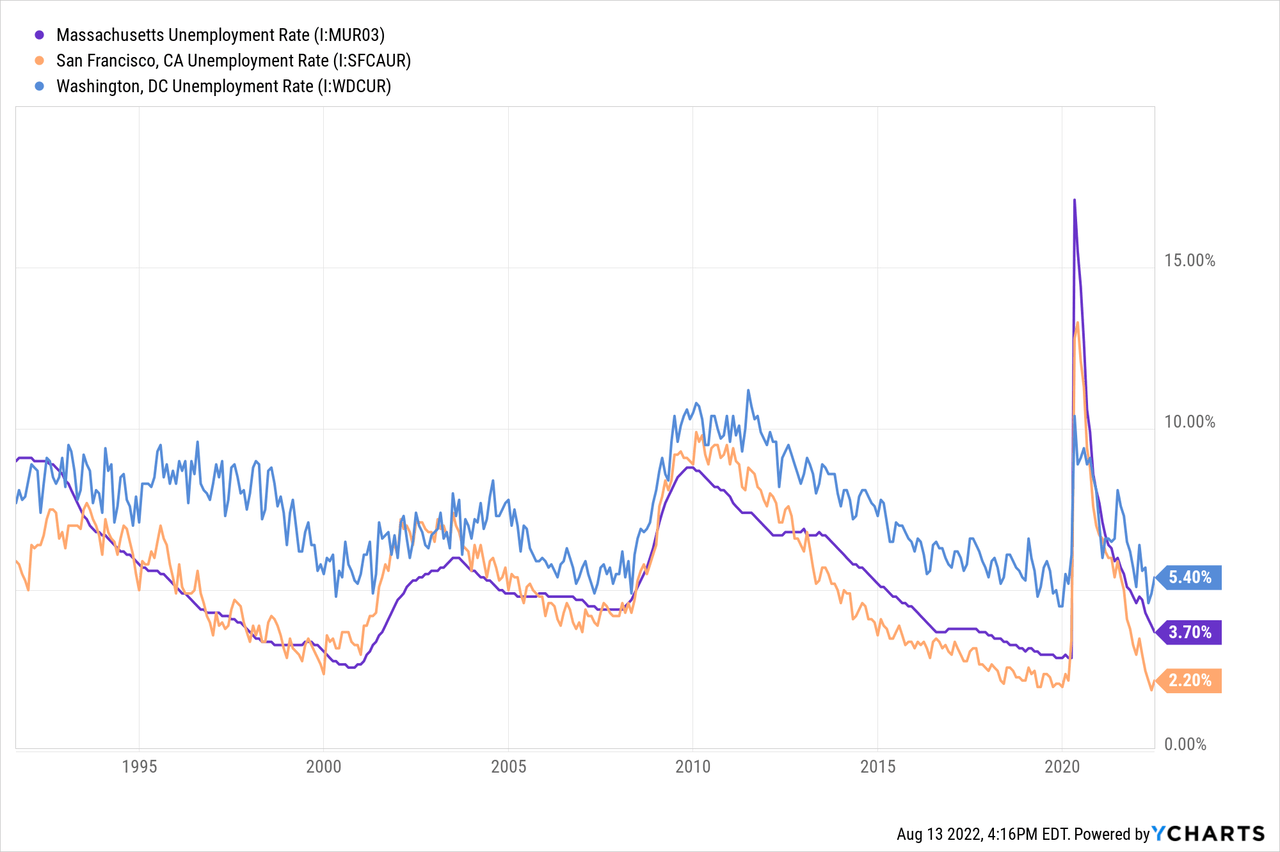
The only macroeconomic factor in favor of loan growth is the unemployment rate. The job market hasn’t been this strong in decades.
Considering these factors, I’m expecting loan growth to slow down to 3% in the third quarter of 2022 from 10% in the second quarter of the year. For full-year 2022, I’m expecting the loan portfolio to grow by 24%. For 2023, I’m expecting loan growth to continue at the same level as the latter part of 2022. Meanwhile, I’m expecting other balance sheet items to grow somewhat in line with loans. The following table shows my balance sheet estimates.
| FY18 | FY19 | FY20 | FY21 | FY22E | FY23E | |||
| Financial Position | ||||||||
| Net Loans | 2,009 | 2,227 | 2,495 | 2,999 | 3,722 | 4,189 | ||
| Growth of Net Loans | 9.6% | 10.8% | 12.0% | 20.2% | 24.1% | 12.6% | ||
| Other Earning Assets | 326 | 290 | 293 | 388 | 440 | 458 | ||
| Deposits | 1,573 | 1,821 | 2,139 | 2,393 | 2,618 | 2,947 | ||
| Borrowings and Sub-Debt | 615 | 514 | 417 | 674 | 1,163 | 1,187 | ||
| Common equity | 213 | 247 | 293 | 355 | 395 | 455 | ||
| Book Value Per Share ($) | 97.2 | 113.2 | 134.2 | 161.1 | 179.5 | 206.7 | ||
|
Source: FDIC Filings, Author’s Estimates (In USD million unless otherwise specified) |
||||||||
Margin to Take a Hit from Higher Interest Rates
The net interest income stands to suffer from higher interest rates because the deposit book is more rate sensitive than the loan portfolio. As almost all of the loan book is comprised of real estate loans, which are mostly fixed-rate based, the average earning-asset yield has a low beta (sensitivity to rates). At the same time, Hingham’s deposit book is moderately sensitive to interest rate changes because of its composition. Accounts that will re-price soon after a rate hike, namely regular, money market, and NOW, made up 36.6% of total deposits at the end of June 2022.
The management’s rate-sensitivity model estimates that net income would DECREASE by 10% over 12 months if rates rose by 200 basis points, as mentioned in the 10-K filing for 2021. As mentioned in the latest 10-Q filing, the rate sensitivity hasn’t changed much since the release of the 10-K filing.
Considering these factors, I’m expecting the net interest margin to dip by 35 basis points in the second half of 2022 and a further 10 basis points in the first quarter of 2023. Beyond the first quarter of next year, I’m expecting the margin to stabilize.
Normalized Provisioning Likely
Hingham Institution has remarkable asset quality as nonaccrual loans made up just 0.03% of total loans at the end of 2022. The allowances seem quite high in comparison to the nonaccrual loans. As of June 2022, allowances made up 0.68% of total loans.
As yields are unlikely to rise much on loans, heightened interest rates will have barely any impact on the borrower’s ability to service their debt. Heightened inflation and a possible recession could, however, lead to financial stress. Nevertheless, I’m not too worried because the loan loss coverage currently seems excessive.
Overall, I’m expecting the provisioning to return to a normal level through the end of 2023. Consequently, I’m expecting the annualized net provision expense to make up 0.08% of total loans in each of the remaining quarters of 2022 and 2023. In comparison, the provision expense averaged 0.07% of total loans from 2017 to 2019, and 0.08% in the last five years.
Expecting Core Earnings to Grow by 11%
The surge in the loan portfolio this year will likely be the chief driver of earnings. On the other hand, margin contraction will likely limit the increase in the net interest income, and consequently net income. Overall, I’m expecting Hingham Institution to report core earnings of $28.47 per share for 2022, up 11% year over year. On a GAAP basis, which includes equity gains and losses, I’m expecting the company to report earnings of $21.53 per share for 2022, down 30% year over year. Earnings will decline on a GAAP basis due to hefty losses on sales of equities in the first half of 2022.
For 2023, I’m expecting Hingham Institution to report earnings of $30.73 per share, up 8% year-over-year. The following table shows my income statement estimates.
| FY18 | FY19 | FY20 | FY21 | FY22E | FY23E | |||
| Income Statement | ||||||||
| Net interest income | 66 | 67 | 85 | 102 | 115 | 119 | ||
| Provision for loan losses | 1 | 2 | 2 | 3 | 5 | 3 | ||
| Non-interest income | (2) | 9 | 9 | 15 | (16) | 7 | ||
| Non-interest expense | 20 | 21 | 22 | 22 | 27 | 30 | ||
| Net income – Common Sh. | 30 | 39 | 51 | 67 | 47 | 68 | ||
| EPS – Diluted ($) | 13.90 | 17.83 | 23.25 | 30.65 | 21.53 | 30.73 | ||
| Core EPS – Diluted ($) | 14.99 | 15.12 | 20.43 | 25.70 | 28.47 | 30.73 | ||
|
Source: FDIC Filings, Earnings Releases, Author’s Estimates (In USD million unless otherwise specified) |
||||||||
Actual earnings may differ materially from estimates because of the risks and uncertainties related to inflation, and consequently the timing and magnitude of interest rate hikes. Further, a stronger or longer-than-anticipated recession can increase the provisioning for expected loan losses beyond my estimates.
Current Market Price is Above the Year-End Target Price
Hingham has increased its dividend almost every quarter since early 2018. Given the earnings outlook, this trend will likely be maintained through the end of 2023. Hingham also usually pays a special dividend annually. I’m expecting the company to pay a total cash dividend of $3.47 per share, which suggests a payout ratio of 11%. This payout ratio is in line with the five-year average of 12%. My dividend estimates for 2023 suggest a dividend yield of 1.2%.
I’m using the historical price-to-tangible book (“P/TB”) and price-to-earnings (“P/E”) multiples to value Hingham Institution. The stock has traded at an average P/TB ratio of 1.79 in the past, as shown below.
| FY18 | FY19 | FY20 | FY21 | Average | ||
| Book Value per Share ($) | 97.2 | 113.2 | 133.8 | 161.1 | ||
| Average Market Price ($) | 212.4 | 188.6 | 184.6 | 308.7 | ||
| Historical P/B | 2.19x | 1.67x | 1.38x | 1.92x | 1.79x | |
| Source: Company Financials, Yahoo Finance, Author’s Estimates | ||||||
Multiplying the average P/TB multiple with the forecast tangible book value per share of $179.5 gives a target price of $320.6 for the end of 2022. This price target implies an 8.4% upside from the August 12 closing price. The following table shows the sensitivity of the target price to the P/TB ratio.
| P/B Multiple | 1.69x | 1.74x | 1.79x | 1.84x | 1.89x |
| BVPS – Dec 2022 ($) | 179.5 | 179.5 | 179.5 | 179.5 | 179.5 |
| Target Price ($) | 302.7 | 311.6 | 320.6 | 329.6 | 338.6 |
| Market Price ($) | 295.7 | 295.7 | 295.7 | 295.7 | 295.7 |
| Upside/(Downside) | 2.4% | 5.4% | 8.4% | 11.5% | 14.5% |
| Source: Author’s Estimates |
The stock has traded at an average P/E ratio of around 11.0x in the past, as shown below.
| FY18 | FY19 | FY20 | FY21 | Average | ||
| Earnings per Share ($) | 13.9 | 17.8 | 23.3 | 30.6 | ||
| Average Market Price ($) | 212.4 | 188.6 | 184.6 | 308.7 | ||
| Historical P/E | 15.3x | 10.6x | 7.9x | 10.1x | 11.0x | |
| Source: Company Financials, Yahoo Finance, Author’s Estimates | ||||||
Multiplying the average P/E multiple with the forecast earnings per share of $21.5 gives a target price of $236.1 for the end of 2022. This price target implies a 20.1% downside from the August 12 closing price. The following table shows the sensitivity of the target price to the P/E ratio.
| P/E Multiple | 10.9x | 10.9x | 11.0x | 11.0x | 11.1x |
| EPS – 2022 ($) | 21.5 | 21.5 | 21.5 | 21.5 | 21.5 |
| Target Price ($) | 234.0 | 235.0 | 236.1 | 237.2 | 238.3 |
| Market Price ($) | 295.7 | 295.7 | 295.7 | 295.7 | 295.7 |
| Upside/(Downside) | (20.9)% | (20.5)% | (20.1)% | (19.8)% | (19.4)% |
| Source: Author’s Estimates |
Equally weighting the target prices from the two valuation methods gives a combined target price of $278.4, which implies a 5.9% downside from the current market price. Adding the forward dividend yield gives a total expected return of negative 4.8%. Hence, I’m adopting a hold rating on Hingham Institution for Savings.
Be the first to comment