


anilakkus/iStock via Getty Images
Introduction
1999 was not a great year to be buying initial public offerings in the stock market. The vast majority of stocks that went public that year are no longer around. They either crashed and were bought out at very low prices, or they went bankrupt. Most of the rest have never recovered the stock prices achieved at their IPOs or soon after. There are two exceptions to this dismal trend that I’m aware of, and NVIDIA (NASDAQ:NVDA) is one of them. (BlackRock (BLK) is the other, if you are curious.)
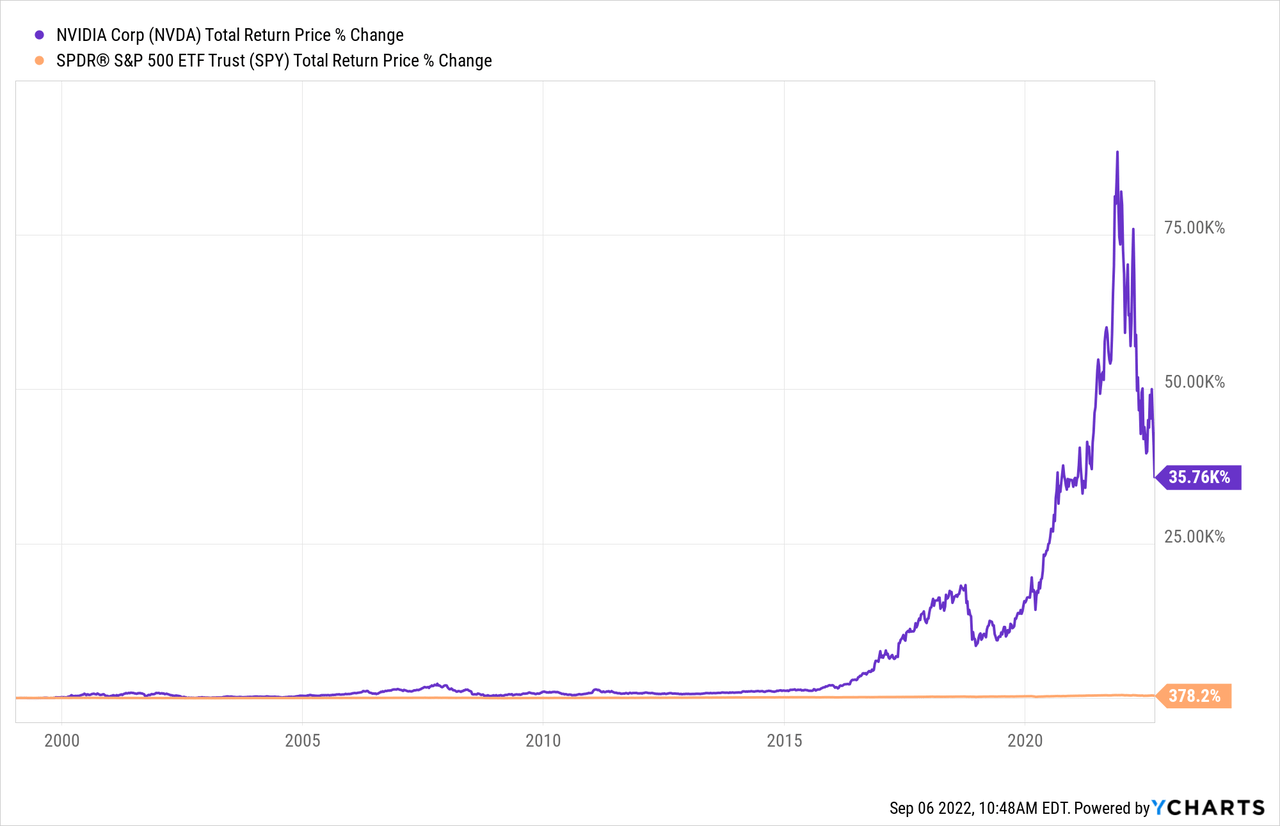
It’s difficult to find a stock from the late 1990s that has returned over 35K%. NVIDIA has without a doubt made a lot of investors rich. That is unless they bought the stock during the past two years. Most of those folks are severely underwater right now.
I’ve never written on NVIDIA before, mostly because I didn’t start writing full-time about investing until 2018, I like to buy stocks when they are very cheap, and NVIDIA has never been very cheap during the past five years. But I have successfully invested in other semiconductor stocks like Micron (MU) and Microchip Technology (MCHP) and written about them publicly. I also happen to think this particular downturn we are headed into is probably going to offer a very good buying opportunity for semiconductor-related stocks generally, and now is the time to develop a plan for when to buy them if you haven’t already.
I have an atypical investing approach when it comes to stocks like NVIDIA, and while I do occasionally write warning articles when these stocks get really overvalued (as NVIDIA was last year) I find that readers are more receptive to my investing style after the stock price has fallen a bit off its highs. Readers seem less likely to pay any attention to my warnings and expectations until the start of a decline. Now that NVIDIA is trading down a little bit, my hope is I’ll have a more receptive audience.
NVIDIA’s Historical Earnings Cyclicality
The first thing I check for every stock I analyze is to see what its historical earnings cyclicality looks like. The reason I do this is because I want to know if this is a stock that fits the profile of a stock I would consider investing in, and also I want to know which strategy and techniques are the most appropriate to analyze the stock in question.
FAST Graphs
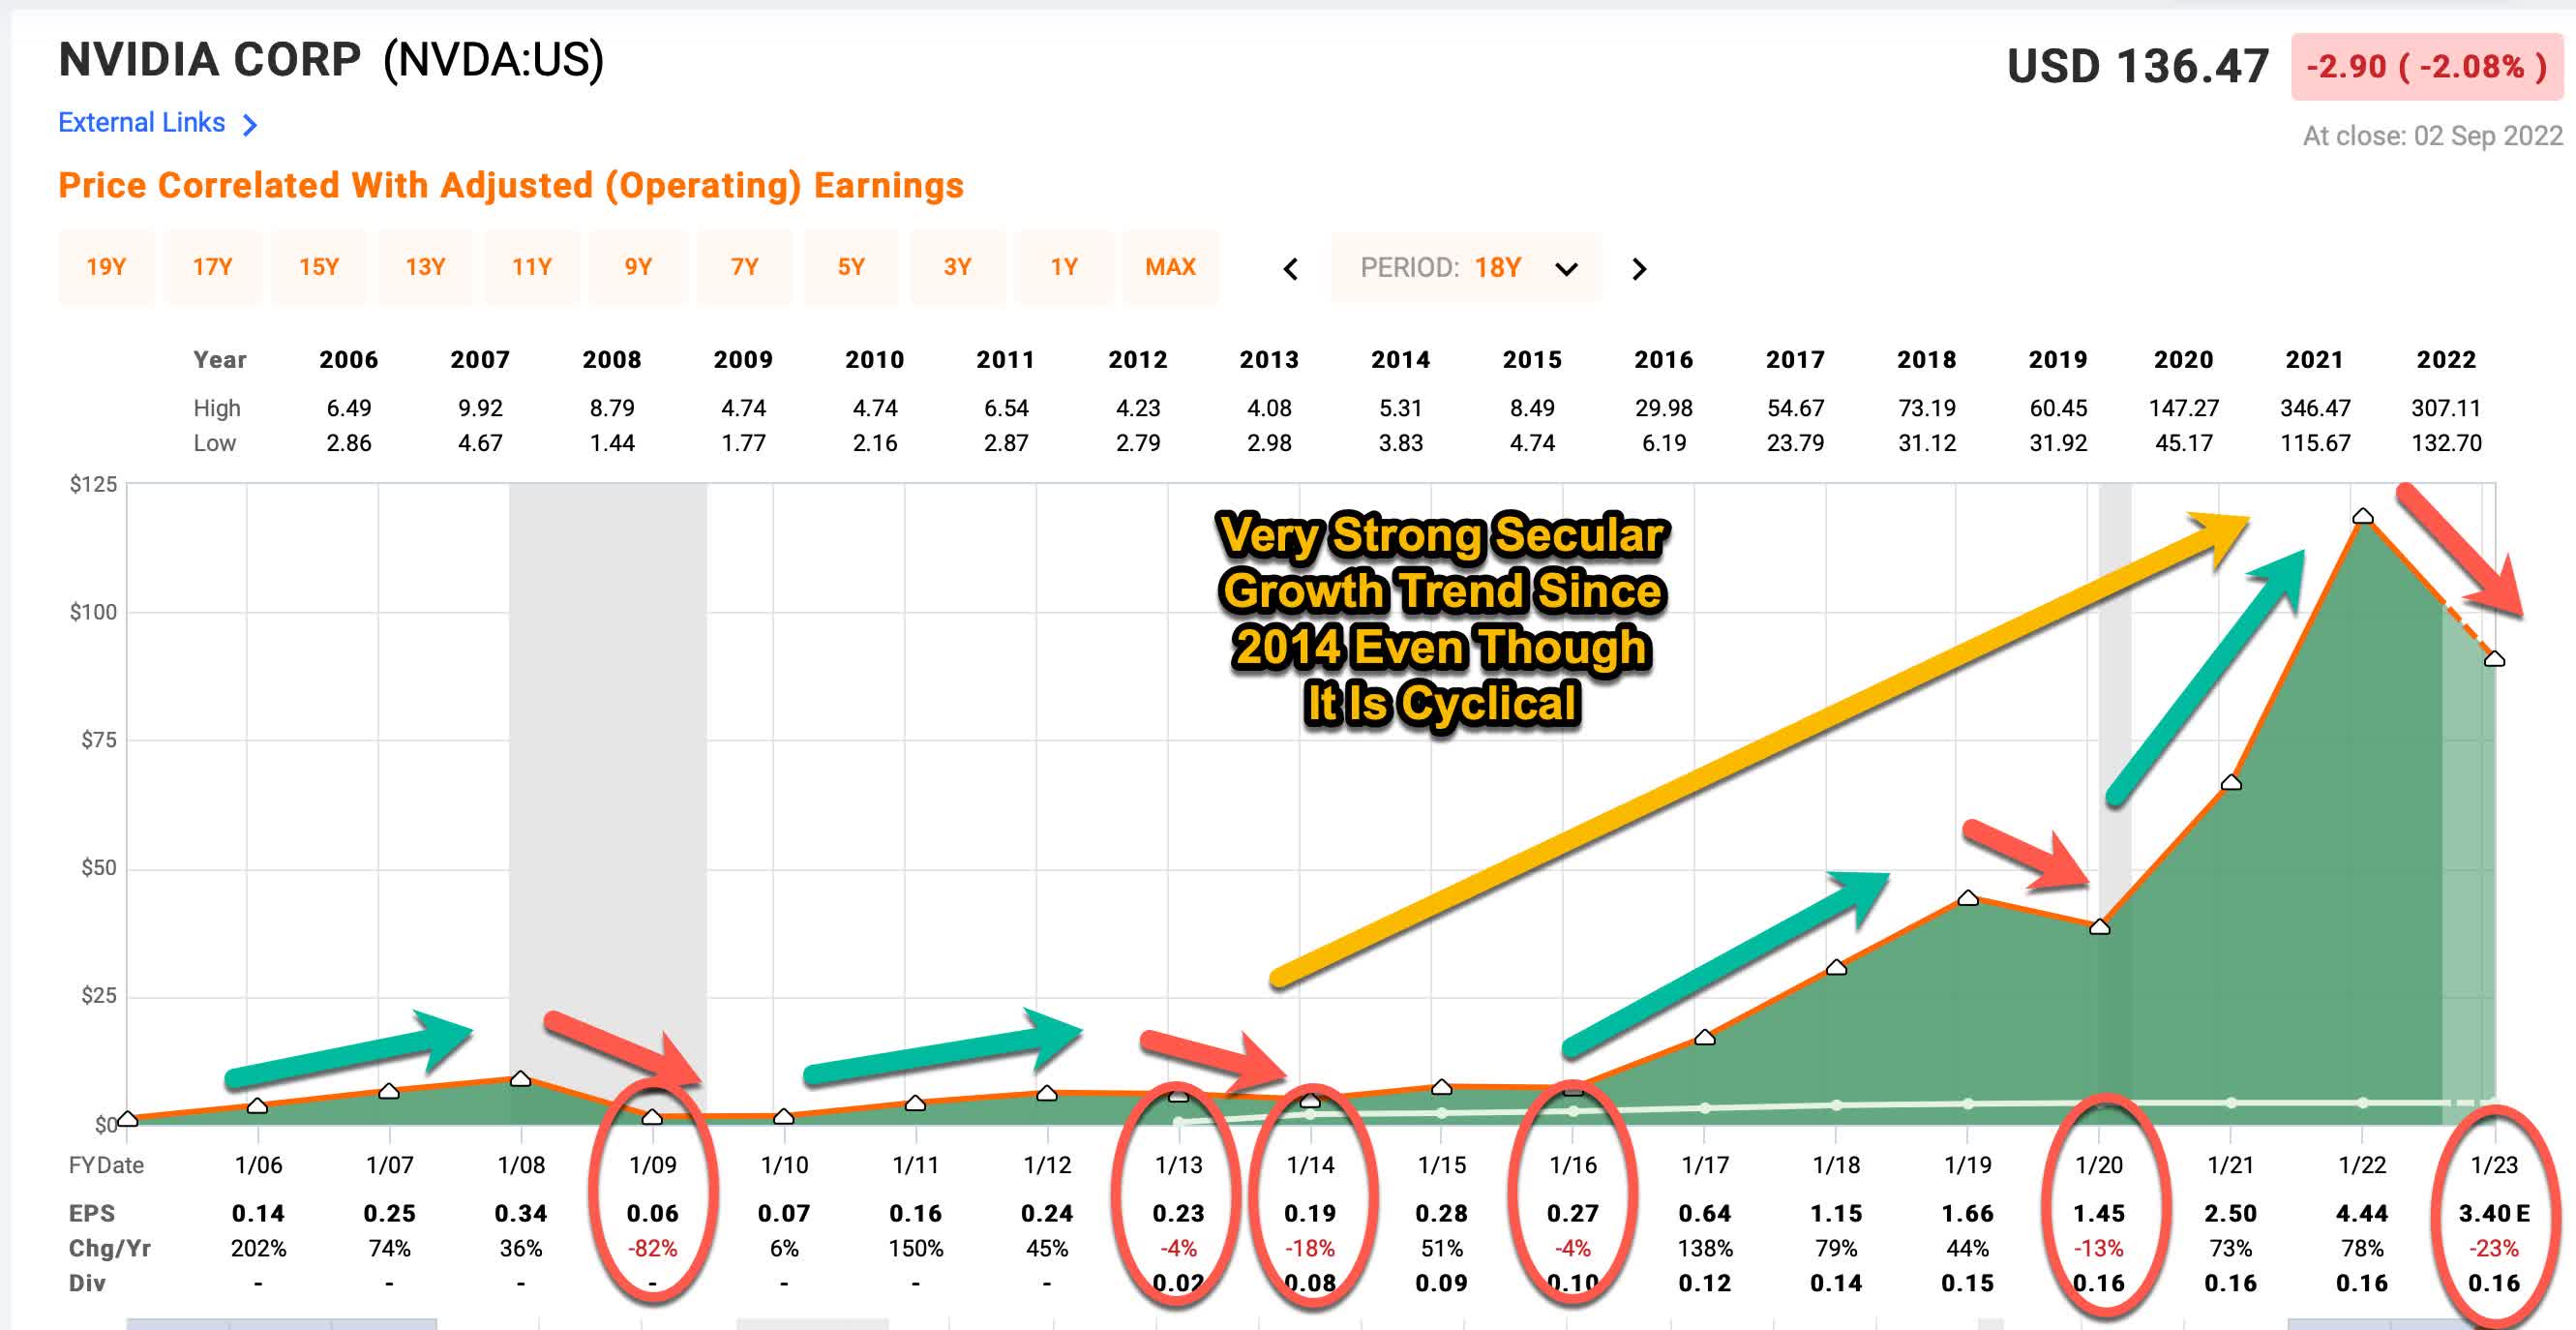
The dark green shaded area in the FAST Graph above represents NVIDIA’s historical earnings per share. Earnings were very deeply cyclical in 2009, falling -82% off their highs, but they did stay positive. During the other three declining periods after 2009, EPS growth declines were modest-to-moderately deep. It is possible that without massive government stimulus and the unusual nature of the pandemic decline in 2020, NVIDIA would have experienced a deeper earnings decline during this period, but we will never know for sure. As it stands, NVIDIA’s earnings exploded to record highs during fiscal years 2021 and 2022. The current year is expected to be NVIDIA’s first really deep decline in EPS since the last true recession in 2009, and I think it’s likely the earnings decline will continue into next year as well. Given that the Fed is still raising rates at this time and there probably will not be any more government stimulus, combined with the huge upcycle over the past two years, I think investors should be prepared for earnings growth to fall around -70% from peak to trough. It may or may not happen, but investors really need to understand that the risk of this sort of earnings decline over the short-to-medium-term is very real.
The primary reason I check earnings cyclicality is so that I can determine what sort of strategy is appropriate to use for a stock. My basic guideline is that if EPS has fallen more than -50% in the past, then I do not use an earnings and earnings-growth based analysis because earnings fluctuate too much to be a reliable guide for when to buy. In fact, earnings metrics like P/E ratios can often send the exact wrong signal for when to buy and sell cyclical stocks. Since NVIDIA saw EPS fall -82% in 2009, and I certainly expect EPS from peak to trough to fall at least -50% during the current downturn, I will be treating NVIDIA as a deeply cyclical stock.
So, instead of using an earnings-based valuation system, I use historical price cyclicality to help guide me when it comes to the prices I am willing to buy. Also, because these stocks can be extremely volatile, each position I take is only weighted approximately 1% of my portfolio.
Versus NVIDIA Stock’s Historical Price Cyclicality
Next, I’m going to examine NVIDIA’s historical price cyclicality in order to help guide a potential purchase price of the stock. While patterns don’t offer a perfect map to the future, they at least offer pretty good guideposts that have a high probability of producing good medium-term returns over the course of 2-5 years.
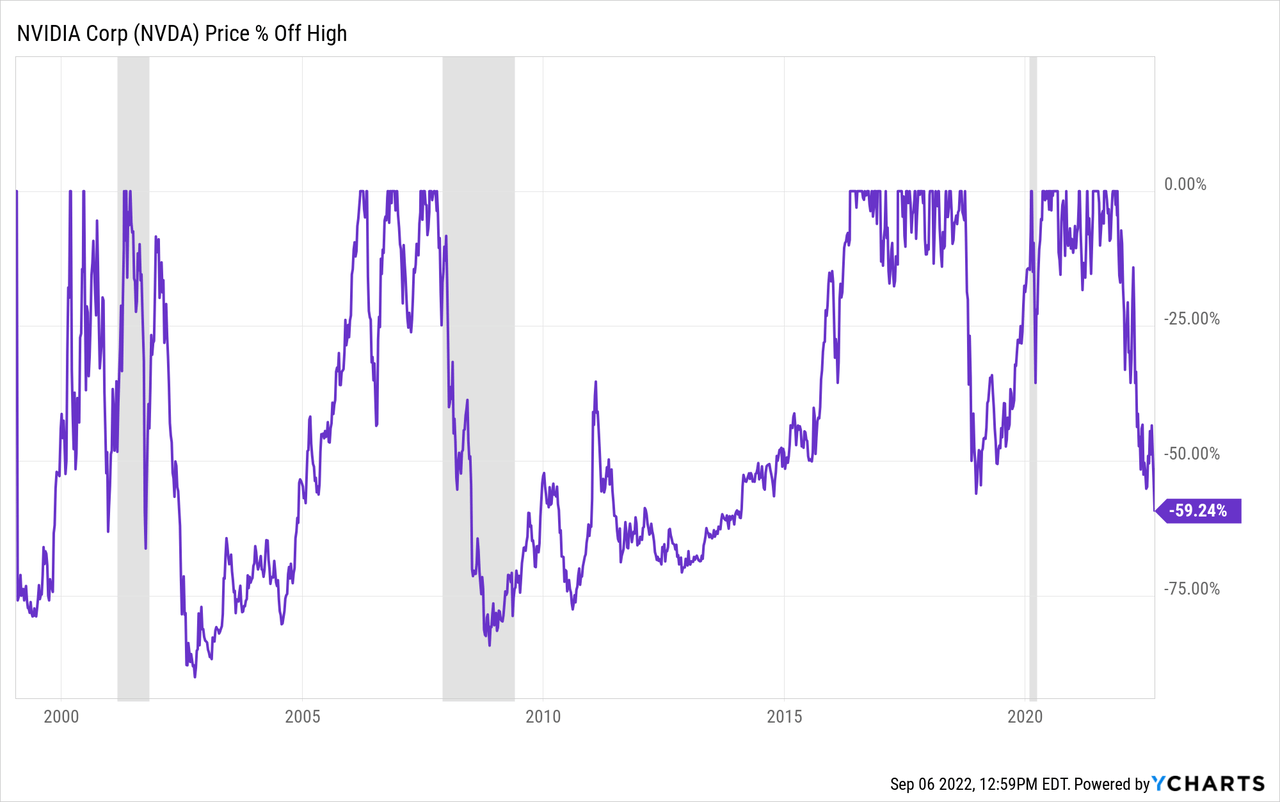
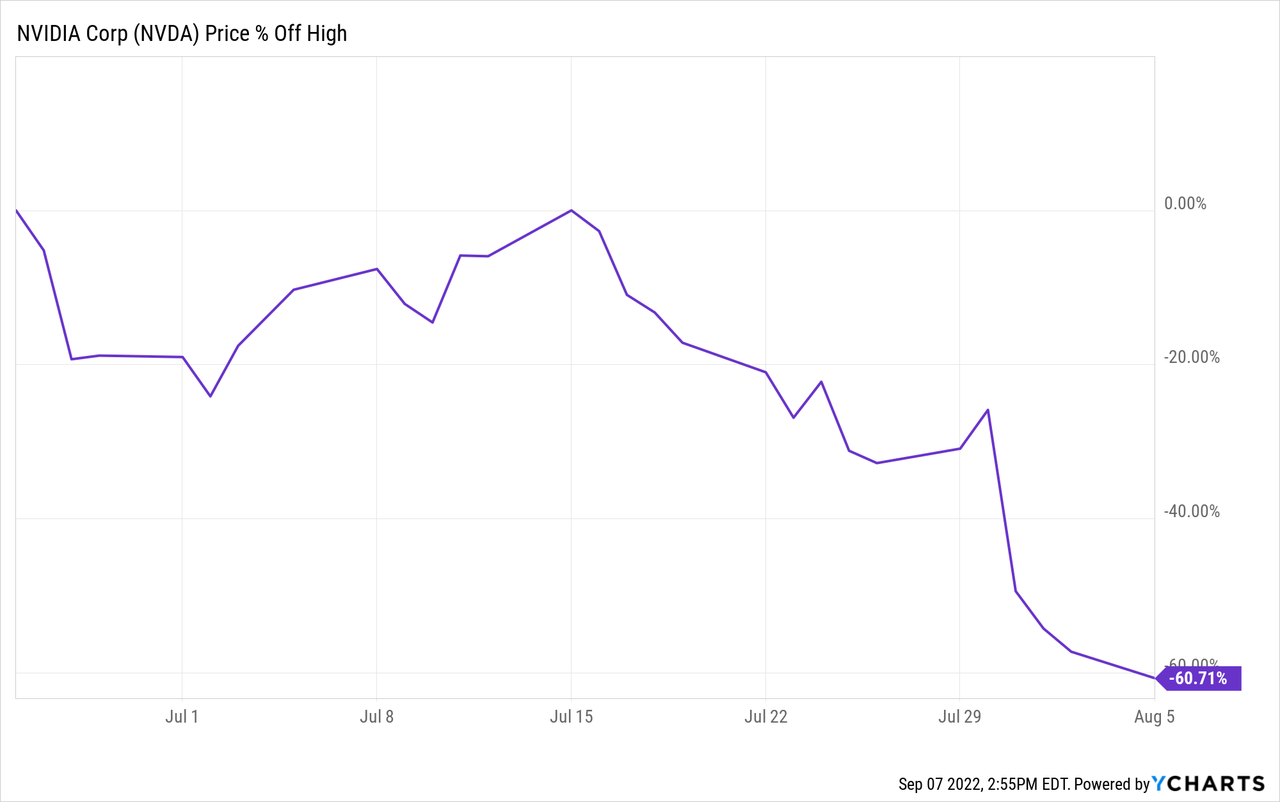
As we can see in the historical drawdown chart above, NVIDIA stock has historically been subject to some very deep price drawdowns. During “normal” recessions, the stock price has fallen deeper than -75% off its highs every time. Below I have put these drawdowns in table form so we can get a clearer picture. I have excluded the drawdown that immediately occurred after their IPO in 1999 since it’s pretty normal for an IPO to fall more than -75% off its highs.
| ~Year | ~Time Until Bottom | ~Duration | ~Depth |
| 2001 | 15 months | 5 years | -90% |
| 2007 | 12 months | 7.25 years | -85% |
| 2018 | 3 months | 2 years | -56% |
| 2020 | 1 month | 3 months | -37% |
| 2021 | 9 months (so far) | ? | -60%+? |
First, as I noted earlier, despite NVIDIA’s fantastic historical returns, the stock’s price drawdowns have been extremely deep. During the 2002 recession the price fell a full -90% off its highs, and during the GFC it fell -85%. These sorts of declines can be brutal for investors to hold through. Additionally, we have seen big price declines during non-recessionary times, like in 2018, when the price fell more than -50%. Already during the current downcycle, the price is down about -60% off its peak.
One of the more interesting things that I think is worth paying attention to in this case, is how long it has taken historically for the stock to bottom during recessions (which is probably where we are headed in the near future in the US). Typically, NVIDIA stock takes roughly 12-15 months before it bottoms (which is actually very fast for declines of -85% and deeper). But right now we are only about 9 months into the current decline. Interestingly, -60% is about what we would expect to see at this point if the stock were to bottom -85% off its highs over the course of about 12-15 months. So far, NVIDIA’s stock price is having a typical drawdown that we should expect during a recessionary period. From what we are seeing right now, absolutely nothing about the stock price behavior seems “different this time”.
Of course, we all know, that things really are a little different (maybe even more than a little different) than they were in 2008. But the truth of the matter is that often the stock market does not care all that much about those potential differences. So, in order to get the best prices (and therefore the best returns) sometimes we need forget the narratives and stories and pay close attention to market behavior. Humans, including investors, are basically identical to what they were in 2001 and 2008, and ultimately it is humans who are investing in the market.
I will frame my thoughts within the framework that my expectation is for a recession in the near future. Unlike 2018 and 2020 when economic growth slowed and the Federal Reserve and Federal Government came to the rescue with economic stimulus, we basically have the opposite happening right now. In an effort to fight inflation, the Fed is determined to raise interest rates, and if after the US elections in November we have a split government, I think we shouldn’t count on anymore stimulus after that, even if the economy falls off a cliff, because there is no incentive for Republicans to help the Biden Administration avoid a bad recession. Putting all this together, my base-case is for a recession to start around Q1 2023 unless something changes between now and then. So, we need to probably take the idea of a shallower NVIDIA stock price dip off the table. (And since the stock price is already down -60%, that seems reasonable.)
Usually, if we have a recession, NVIDIA stock drops -85% off its highs, so I certainly feel comfortable being a buyer of the stock at that point. The more difficult question is whether to have an additional shallower buy price because NVIDIA appears to be in a strong secular growth trend over the past 7 or 8 years. Often (as was the case with my Micron article earlier this week) if a cyclical stock is also in a strong secular growth trend, I will have both a shallow and a deep buy price. One, based on the strength of the secular growth, and one based on the deep cyclicality of the stock. (I will share more detailed thoughts on this a little later in the article.)
My investing approach for deep cyclicals attempts to find historical patterns and then assume they will roughly repeat. However, I do check several things in order to see if there are obvious signs that this cycle really might be different this time and not repeat. I call these checks “impairment tests” and usually they take the form of questions. In the next section, I will run through this list of tests with NVIDIA stock.
Impairment Tests
Are revenues this cyclical peak higher than the last one?
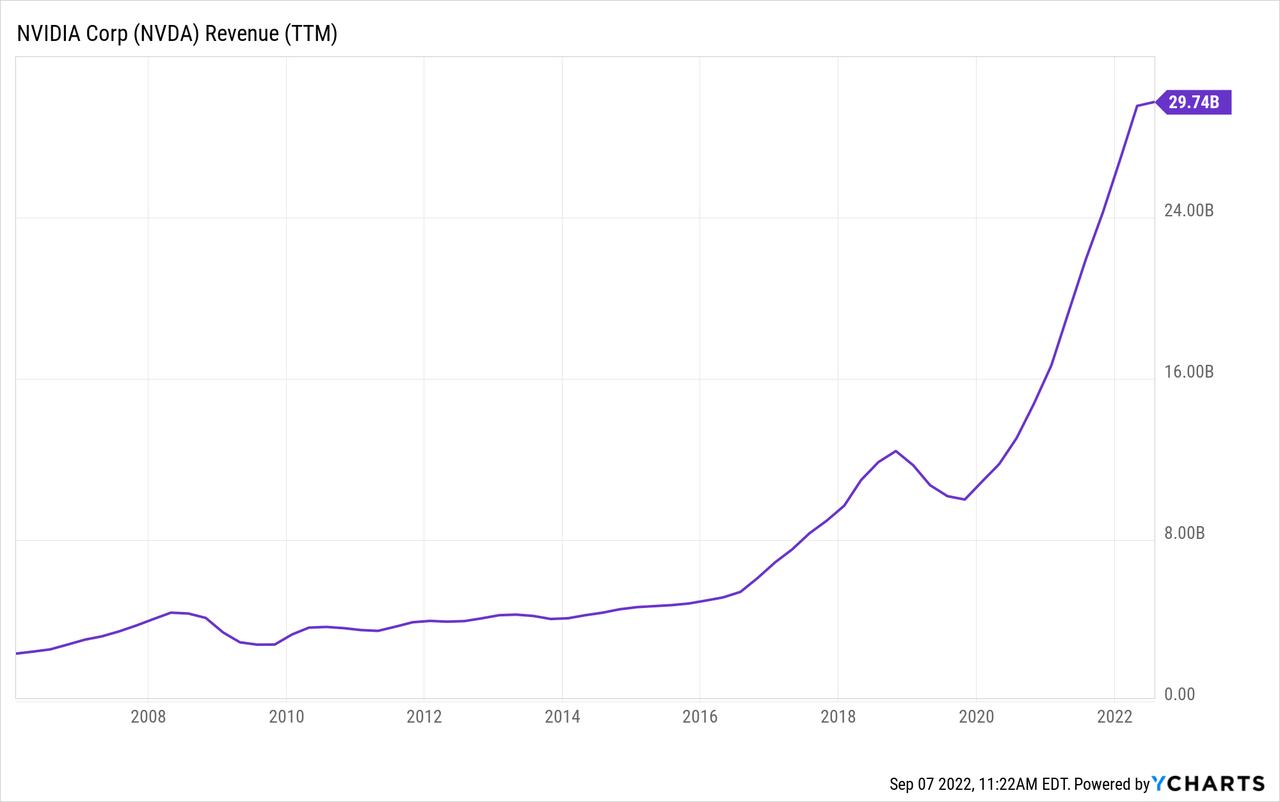
This is a pretty easy one. Revenues this cycle are about triple what they were in 2018. And we have pretty good overall strength since 2006. The post-2008 recovery was a little slow, but NVIDIA eventually got there even before the blast-off after 2016.
Could the business have a hidden fatal flaw?
Since, by definition, the fatal flaw in the business model is “hidden” and cannot be easily seen, my test for this is whether the cyclical business in question has experienced two full business cycles because, typically, recessions are where the flaws are exposed, and sometimes businesses can get lucky and avoid trouble in one recession but have the flaw eventually catch up to them during the next. I typically pre-screen for this before I write an article, and we can see that NVIDIA has survived a couple of decades and been a proven winner and survivor, so I think we are generally safe in this regard.
That said, if we just take the recent years, and the growth associated with it, I do think it’s possible that the rise of Crypto during this time, could potentially be a sort of a fatal flaw, at least with regard to the recent level of growth. I am generally bearish on the usefulness and legality of Crypto in the US, and I don’t think we have seen the end of the Crypto bear market. If NVIDIA’s recent success has had a lot to do with the popularity of Crypto, that’s something to keep in mind. It often takes a big downcycle to expose the truth of the situation, and, in my opinion, Crypto hasn’t had that yet. (Yes, I know there have been previous Crypto-winters, but that was before it became a household name. The current downcycle will be the real test.)
In the end, I think this is a question mark, still, but it should be kept in mind when trying to figure an eventual buying strategy.
Is there a clear and disruptive threat to its core business?
I think competition will always be a threat, so that’s not really what I’m after here (competitive threats will usually show up clearly in revenues, which we already checked). Even with some unknowns, I still think 3-5 years from now NVIDIA’s business will be strong and even if we have a big downcycle with the stock price, I’m still inclined to classify this as a secular growth stock, so I’m not worried much about disruptive threats this cycle.
Has NVDA stock experienced a recent super-cycle?
If I have one single question about NVIDIA that I’m truly uncertain about, I think this is the one. Generally speaking, I think the wider market could certainly have experienced a 2000-like super-cyclical peak at the end of 2021. This can cause a problem for a strategy like mine that measures declines from peak prices because if the peak prices are ridiculously high, then a stock might fall -60% or more off its highs as NVIDIA has and still not exactly be a good value.
I don’t have a clear way to identify super-cycles. It’s kind of an “I’ll know it when I see it” sort of thing. But my quick way to check is to look at a log-scale version of a long-term historical price chart. Super-cycles tend to show up pretty well on these charts without giving as many false positives as a normal long-term price chart might.
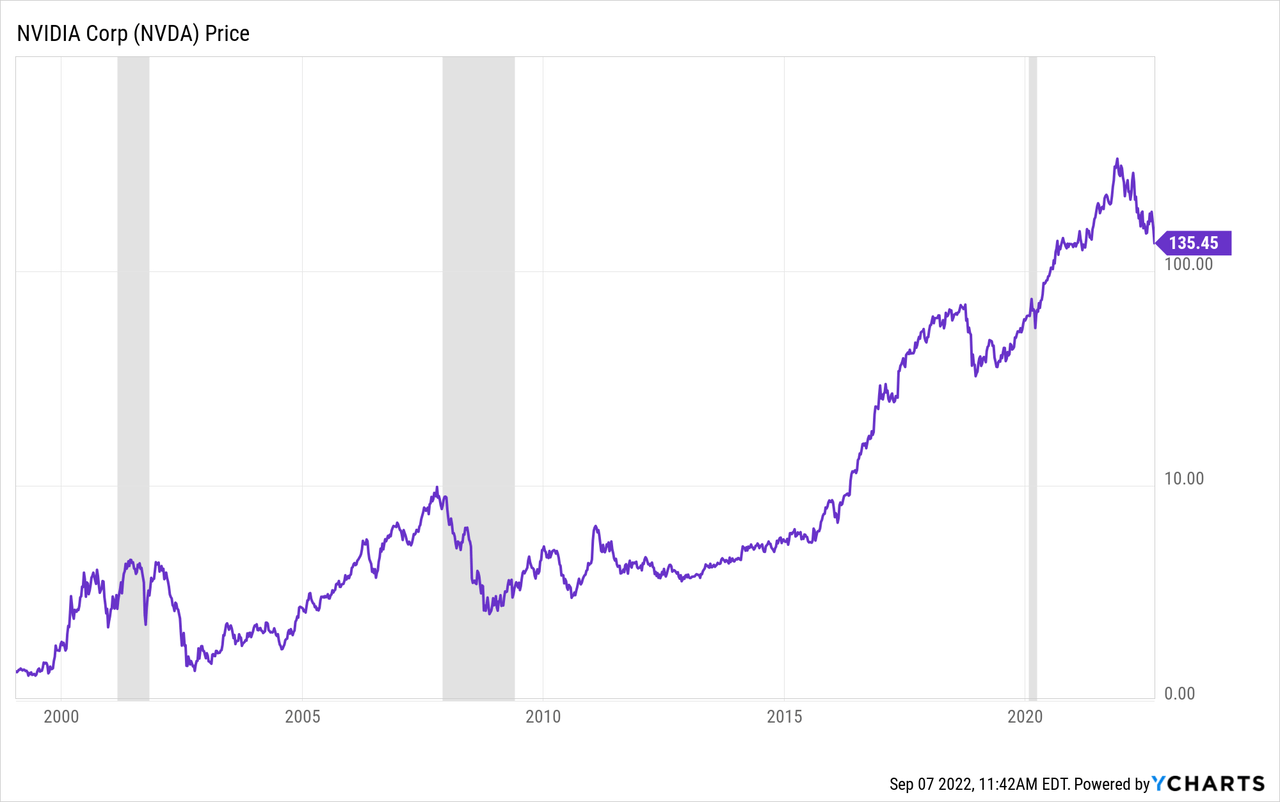
NVIDIA stock’s historical price behavior from 1999 until about 2016 is about what we would expect from a deeply cyclical stock. What is much more difficult to discern is whether the run from 2015 through today is the result of a super upcycle, or simply the result of faster secular growth. It is very difficult to tell. We have a lot of businesses who benefitted from the unique circumstances of the combination of COVID lockdowns and government stimulus in 2020 and 2021. And, without a doubt NVIDIA was one of them. But their hyper-growth (on almost every metric, not just the stock price) actually started much earlier, back in 2015. So I honestly don’t think the answer is especially clear.
While I think it’s fair to say that having a deep buy price about -85% off NVIDIA’s highs for one potential purchase is a pretty easy call given its history, estimating a good first and shallower buy price, is more difficult. I think any price from -60% off its highs, which is where the stock is today, down to about -75% off its highs, would be defensible, depending on where one stood regarding the super-cycle vs secular growth debate. When I initially looked at NVIDIA and started actively tracking it a year or two ago, my initial instinct was to aim for shallow buy price about -65% off its highs. But after reviewing it more closely, I’ve decided to lower that down to an initial buy price that’s -70% off the highs. Here’s why.
While P/E ratios are not particularly good at valuing deeply cyclical stocks, they can be useful when measuring basic valuations across cyclical peaks. The idea is that the peak P/E can give you an estimate of the valuation going into a decline, and if the valuation is higher (or lower) than previous cyclical peaks, then the stock price might fall more (or less) off its highs during the current downturn. In 2007, the monthly P/E cyclical peak for NVIDIA according to FAST Graphs was about 30. The P/E cyclical peak during the current cycle was about 81. NVIDIA was much more richly valued going into the current decline than in the 2007 decline, and remember, the stock price fell a full -85% during the 2007 decline.
It is very important to remember here if a person buys a stock when it is -70% off its highs, and it eventually falls -85% off its highs, that you do not experience a -15% drawdown, you experience a -50% drawdown. For example, imagine a stock peaked at $100 and you bought it $30 (-70% off its peak), but it continued to fall to $15 (-85% off its peak), the distance between $30 and $15 is -50%. So, there is actually a pretty big gap between buying after a -70% decline and buying after a -85% decline. Toss in the uncertainty about Crypto’s future and aiming for an initial buy price when the stock is -70% off its highs seems very reasonable to me.
Is management corrupt or incompetent?
I haven’t seen any signs this might be the case.
How is the company’s debt-to-equity compared to previous cycles?
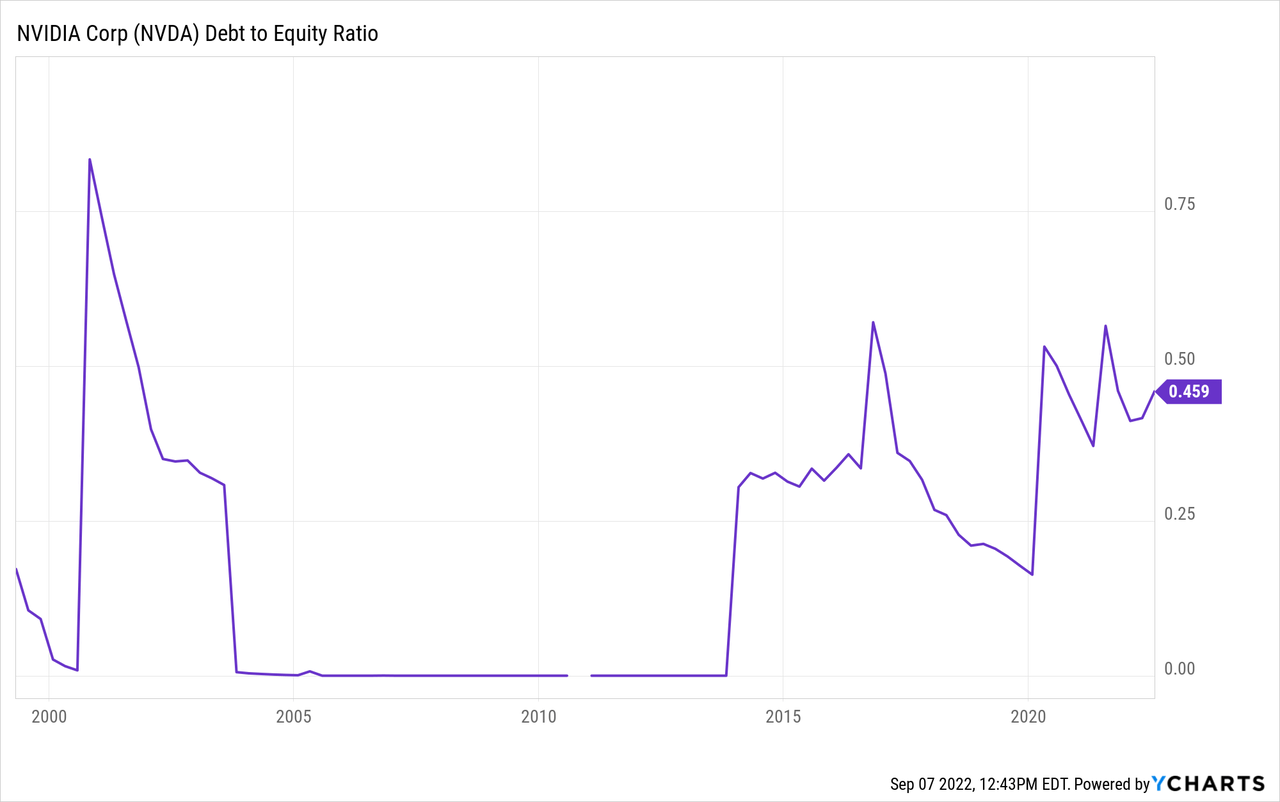
Usually I take pause if I see a debt-to-equity ratio over 1.0 and also elevated compared to where it has been historically. In this case I see neither, so not much of an issue for me.
Has the price dropped enough to produce alpha in the past?
For this backtest, I will be using both the 2001 and the 2007 downcycles and I will be testing what sort of returns an investor would have achieved if they bought the stock after a -70% drawdown and also a -85% drawdown, both of which would have hit during these recessions. I will assume the stock was held until it recovered its previous high (which is usually when I take profits in deep cyclical stocks). I will then annualize that return and compare it to the S&P 500 if bought and sold on the same dates, annualized simple return. The goal is to see if historically this would be an alpha-producing strategy, so the last column is the alpha produced by the investment annualized relative to the S&P 500. If you buy after a -70% decline and sell when the stock price recovers its high, you will produce about a 230% return, so that will be the basic return in the table below.
| Year the Decline Started | Date of Purchase | Date of Sale | ~Months Held | ~Annualized Simple Return | ~Annualized S&P 500 Return | ~Alpha to S&P 500 Annualized |
| 2002 | 6/25/02 | 2/17/06 | 44 | 62.73% | 32.39% | 30.34% |
| 2007 | 7/9/08 | 5/13/16 | 94 | 29.36% | 7.99% | 21.37% |
We can see that buying after a -70% decline off the highs would have produced both good absolute and relative returns. It’s worth noting that investors would have had to be very patient, though, with the 2007 decline taking over seven years to recover its old highs. Typically, I don’t buy cyclical stocks if historically it has taken over five years for the stock to recover its old highs unless the returns are very good. In NVIDIA’s case, they still managed almost 30% simple annualized returns so it still works out, but it helps bolster the case that it’s worth aiming for very low buy prices when the recovery times can be expected to be very long. Additionally, an investor would have had to still be able to sit through a big drawdown if they bought after a -70% decline.
An investor who bought after a -70% still would have had to sit through a further -60% decline in 2002.
Next, let’s move on to what the numbers look like if an investor would have bought after an -85% decline (which would produce a little over a 600% basic return after a full stock price recovery).
| Year the Decline Started | Date of Purchase | Date of Sale | ~Months Held | ~Annualized Return | ~Annualized S&P 500 Return | ~Alpha to S&P 500 Annualized |
| 2002 | 8/1/02 | 2/17/06 | 42 | 171.43% | 12.88% | 158.55% |
| 2007 | 11/20/08 | 5/13/16 | 90 | 80.00% | 22.80% | 57.2% |
As we can see, both absolute and relative returns here are excellent, but an investor would have still needed lots of patience in order to benefit from the full recovery.
Certainly the odds of NVIDIA stock falling this much again, are fairly low, but if we were to have a moderately bad recession, investors, at the very least, need to be prepared mentally to handle this sort of decline.
Additional Strategic Considerations
The way I am approaching the handful of deeply cyclical semiconductor stocks I intend to buy twice during this downcycle is that for the first, and shallower purchase, I am currently holding about 25-30% cash, and the funds for that purchase will come from the cash. For the second, and deeper potential purchase, it’s likely that if the prices go that low, I will have invested most of my cash already into the market, and I don’t have any special cash earmarked for the second purchase, so what will likely happen is I will sell a stock or two that is either lower beta or lower quality to fund the purchase. I had a question in my Micron article asking for an example of what stock this might be. Of my current holdings, a low-beta and not especially high quality example, would be Altria (MO), or Tyson Foods (TSN), both of which are unlikely to fall nearly as deeply as NVIDIA in a recession, but which are both also less likely to provide the great returns of NVIDIA during the next upcycle. So those are the sorts of stocks I would tap for cash if we get into a very deep bear market.
Because it is possible that NVIDIA may have recently experienced a much bigger super-cycle than I am currently factoring in (remember the 2007 30 peak P/E compared to the 81 peak P/E this time) I think it’s worth mentioning that just because a stock has had a super-upcycle doesn’t mean it’s uninvestable during the super-downcycle. But, typically what I do if I am more certain of the super-upcycle is to wait for a reasonably clear double-bottom instead of buying the stock on the way down. When super-upcycles come down they can be extremely brutal, but I have had success in the past with stocks like 3D Systems (DDD) and Albemarle (ALB) simply waiting for a somewhat clear bottom after a super-cycle, and I think that’s a reasonable strategy here as well. I decided not to use it because my buy prices are already so low I’m sort of prepared for a super-downcycle already.
Putting all this together, my first buy price for NVIDIA is about -25% lower from today’s price at $103.94, and my second, deeper buy price, is $51.97. Importantly, these are not what many refer to as “price targets”, which imply that I’m predicting with some high level of confidence and probability the stock will hit these prices. What I am saying is these are the prices at which I will be a buyer if they hit. The shallower buy price I do think has a greater than 50% chance of hitting, and the lower one, perhaps closer to a 10-15% chance of hitting. The important thing for investors to know is that if we have a recession, then it is normal for NVIDIA’s stock price to move down to these levels. NVIDIA stock can literally fall -85% off its highs and that price movement doesn’t tell you anything about the quality of the business itself, other than the business is cyclical. So, if you hold NVIDIA stock and you believe in the long-term, I think this article can be useful to you as well if it helps prevent you from selling (likely to someone like me) near the bottom.
Be the first to comment